Comprehensive Business Analysis: Data Collection and Sampling Report
VerifiedAdded on 2023/06/10
|16
|5247
|76
Report
AI Summary
This business analysis report explores key concepts such as population analysis, sampling techniques, and data collection methods. It differentiates between primary and secondary data, highlighting their respective advantages and disadvantages. The report delves into various sampling techniques, including simple random sampling, systematic sampling, stratified sampling, and cluster sampling, explaining their applications and relevance in statistical studies. Furthermore, it discusses the characteristics, accuracy, cost, and sources of primary and secondary data, emphasizing the importance of understanding these differences for effective business analysis and decision-making. Desklib provides this document and many more solved assignments for students.

Business Analysis
Paraphrase This Document
Need a fresh take? Get an instant paraphrase of this document with our AI Paraphraser
Contents
QUESTION 1..................................................................................................................................3
A. Population:..............................................................................................................................3
B. Sampling technique.................................................................................................................4
QUESTION 2..................................................................................................................................6
1) The main differences between primary and secondary data...................................................6
b) The advantages and disadvantages of primary and secondary data........................................8
QUESTION 3................................................................................................................................10
QUESTION 4................................................................................................................................11
REFERENCES..............................................................................................................................15
QUESTION 1
Exploratory research is usually done on examples of the topic, not on the entire population.
Incredibly demanding parts of hands-on work including getting irregular Tests from designated
populations into which review results will be aggregated. Basically, the movements that various
test tendencies occur are very difficult almost every review gets more or less attention. To assess
the strength of this tendency Scientists, need to understand the population from which the test
will be obtained. This Possible choice as to whether the findings of a given exploration can be
summarized as More people rely on this information. The resulting negotiation relies on Check
the system and various test procedures (Feng and et.al., 2019). In this part, we will Importance of
analysing the population and vetting procedures in focusing on partners measure their response
to the opportunity to send vacation pay.
A. Population:
Population refers to the total number of individuals occupying an area weather it can be a
city or region, country or the world and continuously being changes by increase and decrease.
Population can increase when birth rates are more than death rates while it decreases when death
rates are higher than birth rates. According to the biological population, the length of a human
population is depending on the supply of food, impact of diseases and other environmental
factors.
Population also affected by social controlled reproduction and by technological advancement,
mainly in the medicine and people health, which decrease the length of human life. The study
refers to the human population is called demography. In 18th century population is first
acknowledged that human mortality can analysed as an evolution with statistical regularities
(Lai, Liu and Wang, 2021).
Population is an important factor that help to create balance the environment. Population
should always in an equilibrium with the means and resources. A balance population refers to the
total number of the means equal to the available resources. If the population increase over the
resources than environment of country or an area cannot preserve. A balance population can
fulfil needs and demands of people can satisfy easily.
Theory and concepts of Population:
⊘ This is a preview!⊘
Do you want full access?
Subscribe today to unlock all pages.
Trusted by 1+ million students worldwide
There is a very famous theory which tells that a balance between population development
and demand of food can be established by positive checks. This is Malthusian theory of
population which is proposed by Thomas Robert Malthus. Some elements of population theory
are discussed below:
1. Population and food supply: there is a massive increase in the population and the food
supply increases at a very low rate as compare to production. Due to low growth in food
supply this will be limited in few years. Food shortage unbalance the environment an also
indicate population growth (Kochmann and et.al., 2019).
2. Population Checks: Increase in population over the food resources is the situation of
disequilibrium where demands and needs of people cannot fulfil. People will not get food
for their survival and they can die due to shortage of food. Nature has item way to
manage this resources and population. It can take population level to food supply levels
by natural disasters such as earthquakes, flood etc.
Use of population in statistics:
Population can have used in the statics it is used to observe behaviour, market trends and
patterns in the way individual or audience in an established group interact with the world around
them. It is important to identifying the target audience, so any company or individual can
understand for whom and what data referring to. If it is not understanding by the company than
collected data may be worthless. A statistical population is any unit of representatives who are
the subject of a study, simply it refers to the group of people which grouped for a common
purpose, sometime two common purpose. For example, in a study that is trying to measure the
mean weight of all 30 years old females in UK, the population would be all 30-year-old female
in the UK. Statistical population can be specific as the individual wants. It mainly depends on the
objectives or goals of the investigation being conducted (Karthik and Krishnan, 2021).
B. Sampling technique
This technique of sampling is the determination of the particular procedures by which the
companies of the sample have been chosen. There are some various techniques of sampling
which are given below:
Simple random sampling: If each and every individual is selected completely by
opportunity and each person of the population has a same opportunity, or probability of
Paraphrase This Document
Need a fresh take? Get an instant paraphrase of this document with our AI Paraphraser
choosing a person. There is some another way to acquiring a random sampling is to
provide each person in a population a number. After that utilize the table of random series
to decide which person is involved (Ranjandish and Schmid, 2021). From example: if an
individual having a sampling of a 1000 persons, and it labelled as 0 to 999, then utilize
teams of three digits from the random number table to choose the sample. So, in that case
the first three numbers from the random number table were 094, which select the person
labelled 94.
Systematic sampling: This is one of the another type of sampling technique in which
persons are chooses at daily intervals in the frame of sampling. This interval is choosing
to check an appropriate size of sample. If they necessary, a sample size of n from the
population of x size. It need to choose each and every x/nth person for the sample. For
example: If they need a sample size of 200 from a population of 2000, then it selects
every 2000/200 = 10th person of the sampling frame. This method of sampling is easier
as compare to the simple random sampling method and it is easy to understand also.
Stratified sampling: In this type of technique, the population is first divided into the sub-
teams who all contribute the same significance. It is utilizing when they might reasonably
estimate the analysis of interest which depends among the different sub-teams and it need
to check the indications from all sub-teams. For example: In a research of stroke outputs,
it may stratify the population by sex to check same indications of male and female. The
research of this sample is acquired by considering same sizes of sample from each and
every stratum. In stratified sampling, it also relevant to select non-equal sizes of sample
from each and every stratum. This stratified sampling improves the adequacy and the
indicators of the results by decreasing sampling bias. Apart from this it also need the
knowledge of the relevant significance of the sampling frame.
Clustered sampling: In this type of sampling technique, sub-teams of the population are
utilized as each units of sampling, apart from the individuals. This population is divided
into sub-teams which is known as clusters, which are selected randomly and involved in
the research (Gnann and et.al., 2018). For example: Individual GP practices of towns
could be determined as clusters. In individual-level of cluster sampling, all peoples of the
selected clusters are involved in the research. In second -level of cluster sampling, a
selection of persons from each and every cluster is randomly choosing for
comprehension.
QUESTION 2
1) The main differences between primary and secondary data.
Data collection is a very important part of factual information review. Within the scope of the
exploration, different approaches are used for information classification, all of which belong to
two sets; namely basic information and auxiliary information. Basic information refers to
information that scientists have accumulated interestingly, while secondary information refers to
information collected by others (Trinh, 2018).
There are various contrasts between basic and optional information that make sense in
this section. Nonetheless, the crucial contrast is that basic information is unique and based on
reality, while optional information is just an evaluation and translation of basic information.
While basic information is accumulated to find solutions to existing problems, optional
information is collected for different reasons.
Primary Data:
The primary data is the data which is collected by the researcher at first time by giving
direct efforts. This data is also known as the first and single hand data that means the research
are taken place by himself researcher without any help from any other prepared sources. The
main origin of primary data is face to face interview, investigation, conference, surveys and
many more. It is not depended to any other sources which are already present. It takes more time
to gather the useful information and it also contain more people to conduct this activity.
Secondary Data:
Secondary data is the type of data which is collected by the organization or other people
with the help of some other researcher already prepared data. This type of gathered data is also
known as second – hand data. It takes more time to gather the information. The sources which
secondary data include are social networking sites, books, articles, newspaper, etc. This type of
data are easy to collect and implement because they are ready and available all the time in its
sources or applications (Oliveira and et.al., 2020).
Basis Primary Data Secondary Data
⊘ This is a preview!⊘
Do you want full access?
Subscribe today to unlock all pages.
Trusted by 1+ million students worldwide
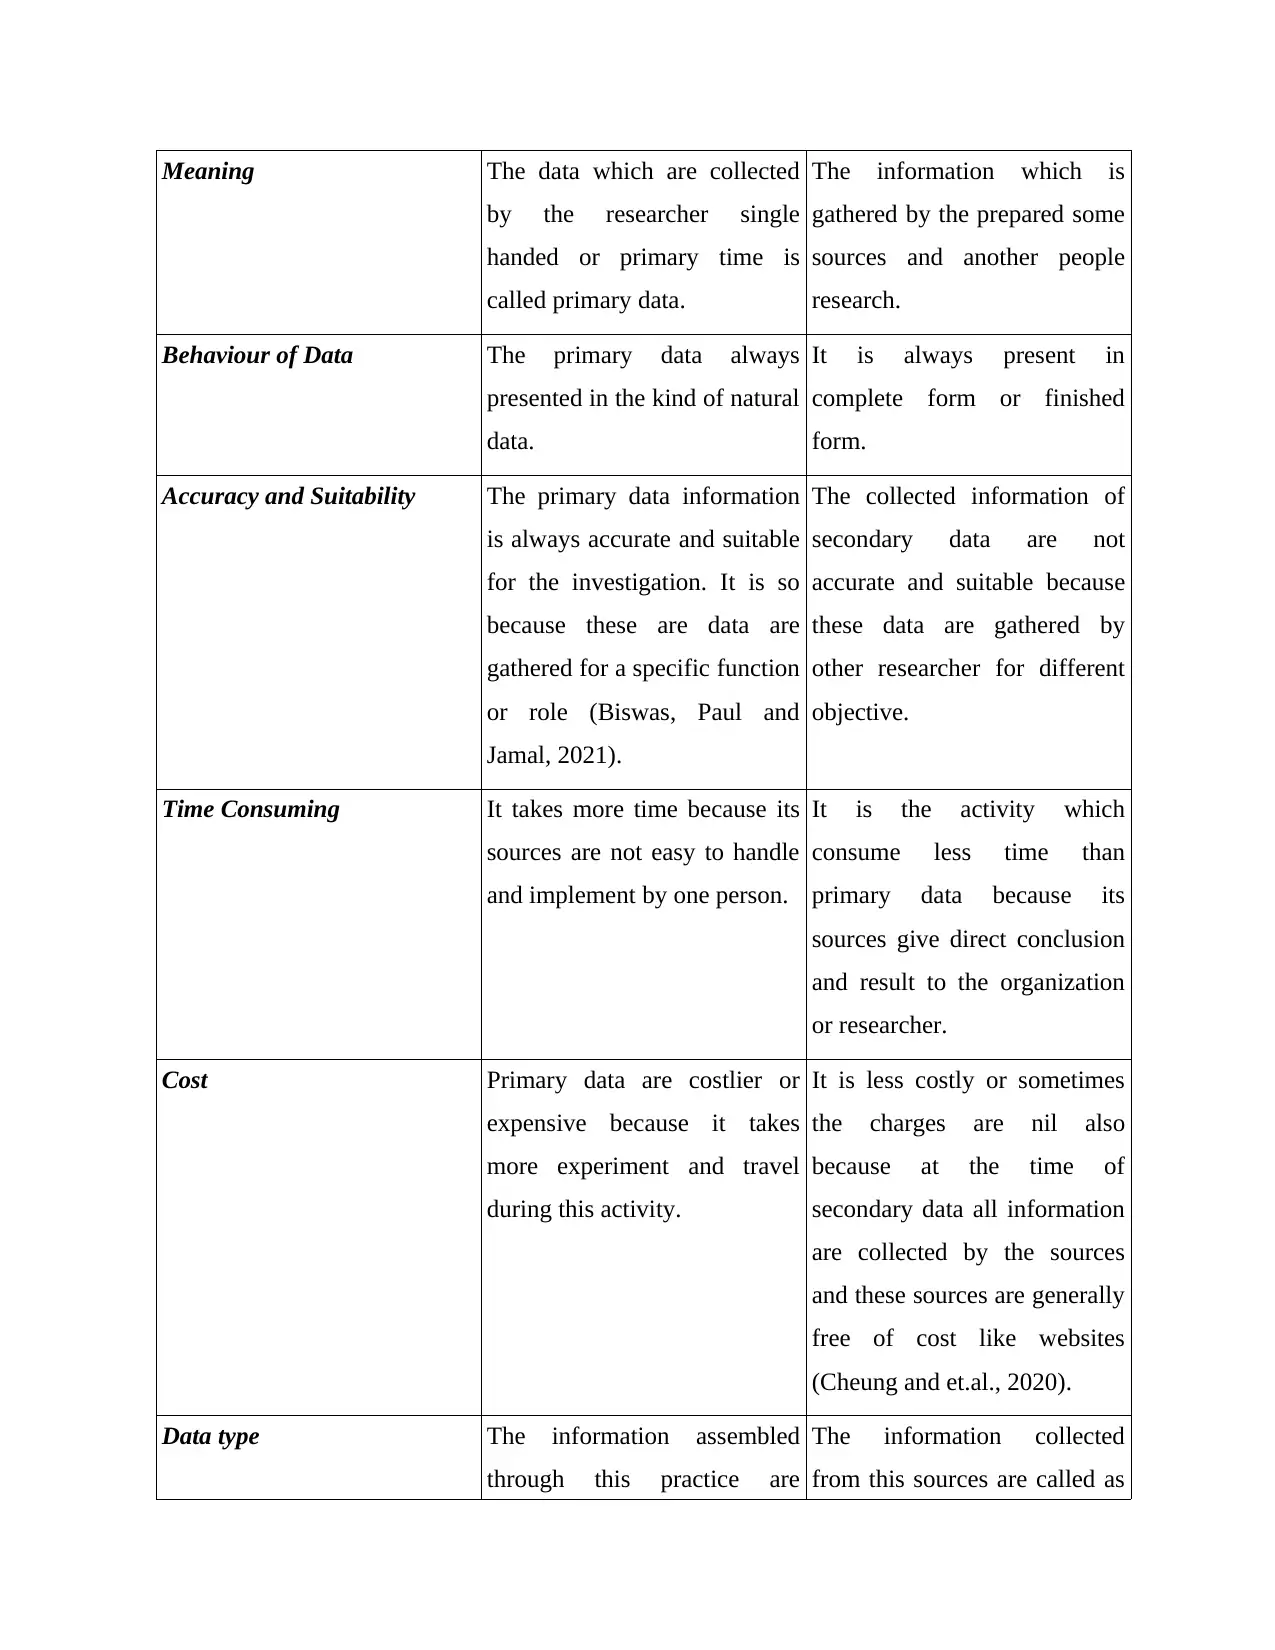
Meaning The data which are collected
by the researcher single
handed or primary time is
called primary data.
The information which is
gathered by the prepared some
sources and another people
research.
Behaviour of Data The primary data always
presented in the kind of natural
data.
It is always present in
complete form or finished
form.
Accuracy and Suitability The primary data information
is always accurate and suitable
for the investigation. It is so
because these are data are
gathered for a specific function
or role (Biswas, Paul and
Jamal, 2021).
The collected information of
secondary data are not
accurate and suitable because
these data are gathered by
other researcher for different
objective.
Time Consuming It takes more time because its
sources are not easy to handle
and implement by one person.
It is the activity which
consume less time than
primary data because its
sources give direct conclusion
and result to the organization
or researcher.
Cost Primary data are costlier or
expensive because it takes
more experiment and travel
during this activity.
It is less costly or sometimes
the charges are nil also
because at the time of
secondary data all information
are collected by the sources
and these sources are generally
free of cost like websites
(Cheung and et.al., 2020).
Data type The information assembled
through this practice are
The information collected
from this sources are called as
Paraphrase This Document
Need a fresh take? Get an instant paraphrase of this document with our AI Paraphraser
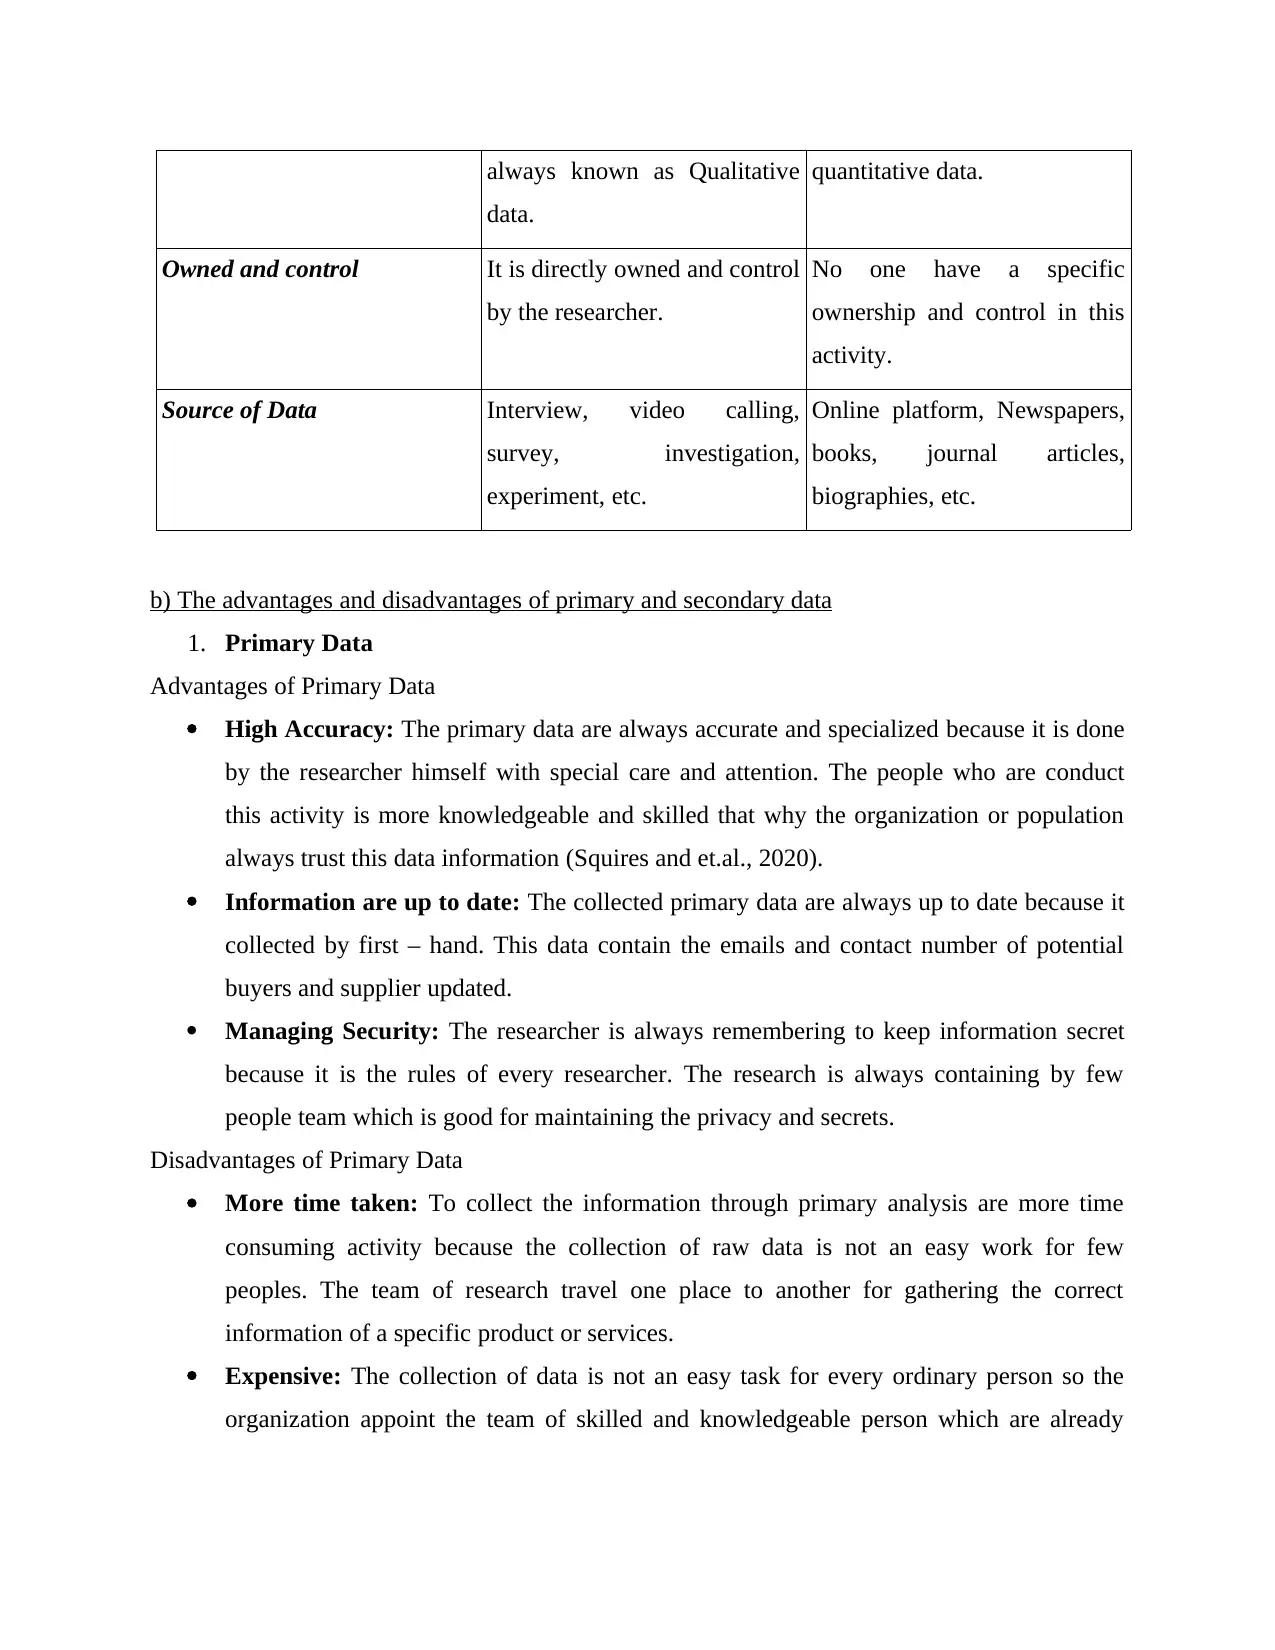
always known as Qualitative
data.
quantitative data.
Owned and control It is directly owned and control
by the researcher.
No one have a specific
ownership and control in this
activity.
Source of Data Interview, video calling,
survey, investigation,
experiment, etc.
Online platform, Newspapers,
books, journal articles,
biographies, etc.
b) The advantages and disadvantages of primary and secondary data
1. Primary Data
Advantages of Primary Data
High Accuracy: The primary data are always accurate and specialized because it is done
by the researcher himself with special care and attention. The people who are conduct
this activity is more knowledgeable and skilled that why the organization or population
always trust this data information (Squires and et.al., 2020).
Information are up to date: The collected primary data are always up to date because it
collected by first – hand. This data contain the emails and contact number of potential
buyers and supplier updated.
Managing Security: The researcher is always remembering to keep information secret
because it is the rules of every researcher. The research is always containing by few
people team which is good for maintaining the privacy and secrets.
Disadvantages of Primary Data
More time taken: To collect the information through primary analysis are more time
consuming activity because the collection of raw data is not an easy work for few
peoples. The team of research travel one place to another for gathering the correct
information of a specific product or services.
Expensive: The collection of data is not an easy task for every ordinary person so the
organization appoint the team of skilled and knowledgeable person which are already
named as researcher. The researcher charges more amount for researching in a specific
field and also they take money for travel and food expenses.
Need of skilled person: As the organization or peoples know that research is not a small
task for any person that is why it want the person who have high degree of knowledge
and skills and good in communication (Cole, Friedlander and Trinh, 2018).
2. Secondary Data
Pros of Secondary Data:
Easy to get to: Yet sources of optional information flock to the web. Today, a wealth
of information can be accessed with just a few clicks of a PC mouse.
It's free or reasonable: Most sources of optional information are completely free and
at a very low cost. This saves scientist’s effort and cash. In contrast to basic
inspections, which require planning and directing the entire basic review technique
from the outset, selective exploration enables scientists to collect data without any
financial investment.
save time. Optional information takes only a few minutes to process. Sometimes a
small Google search is required to obtain reliable and trustworthy data sources.
Create more current information and experiences from past surveys: Dissecting past
information again may lead to unexpected new experiences and perspectives, or more
up-to-date relevant results.
larger sample size: Huge information indexes often use a larger example to contrast
with those that might be collected through basic information gathering. A larger
example shows that extreme derivation becomes more straightforward and simpler.
Anyone can collect information: Optional information research can be led by non-
world-renowned individuals with different types of subjective and quantitative
exploration strategies. Basically, anyone can accumulate optional information.
Cons of secondary data
There is no good definition of what is necessary for a scientist. For a scientist's
necessities, the optional date is not well defined because it was assembled beforehand by
another person. This makes it worthless and untrustworthy in various promotions and
business cases. Also, a large amount of optional information does not mean it is suitable
(MacInnes, 2020).
⊘ This is a preview!⊘
Do you want full access?
Subscribe today to unlock all pages.
Trusted by 1+ million students worldwide
Restricted control over the nature of the information. Scientists have absolutely zero
influence on the quality of information. This suggests that the nature of these optional
data needs to be overhauled given the potentially problematic data sources.
Biasness: Since optional information is accumulated by others, the data on the side of the
person collecting the data is generally uneven. This may not solve every problem an
expert has.
Inappropriate: Ancillary data has accumulated, suggesting that it is likely out of date. In a
variety of situations, this challenge may be necessary.
QUESTION 3
The central tendency implies the value of resolving the focal or normal channel of the dataset.
Significant normal proportions of central tendency contain the mean and mode, while the
standard deviation is the proportion of the variable (Chadi and et.al., 2019). The below data is
collected for Marks and Spencer of 5 consecutive years.
Mean: The mean implies the sum of all sets of information divided by the number of sets or
parts. It can also be described as the number of each noted result from an example partition, and
the total number of times. ẋ is the direct mean, and numerically, the mean of revenue of Marks
and Spencer is determined as follows:
Man = Total Sum of data set / Total number of data set
For example, using the above information from The Marks and Spencer, the average is
determined as follows:
Mean = (10662 + 10698 + 10377.3 + 10181.9 + 9155.7) / 5
= 51075.1 / 5 = 10215.2
The main benefit of the mean is that there is no need to put information in the ascending
request, which is a very appealing value and addresses what each value would be if they were not
any different. The disadvantage of using the mean is that it is computationally expensive, usually
given as a decimal number; one requires every number in the dataset to be included, and it is
likely to be skewed by anomalies.
Mode: It refers to the respect that recurs or occurs at the highest level. A collection of
information can have one pattern, more than one pattern, or no pattern. In the absence of partial
duplication, information indexing requires patterns. Given the index of information given by
Paraphrase This Document
Need a fresh take? Get an instant paraphrase of this document with our AI Paraphraser
Marks and Spencer, there is no pattern to any imagination. Anyway, it is nice to note that the
pattern is simple and can be found (Kim, Kim and Park, 2020). Nonetheless, the main obstacle to
using this mode is that it may not process information unambiguously.
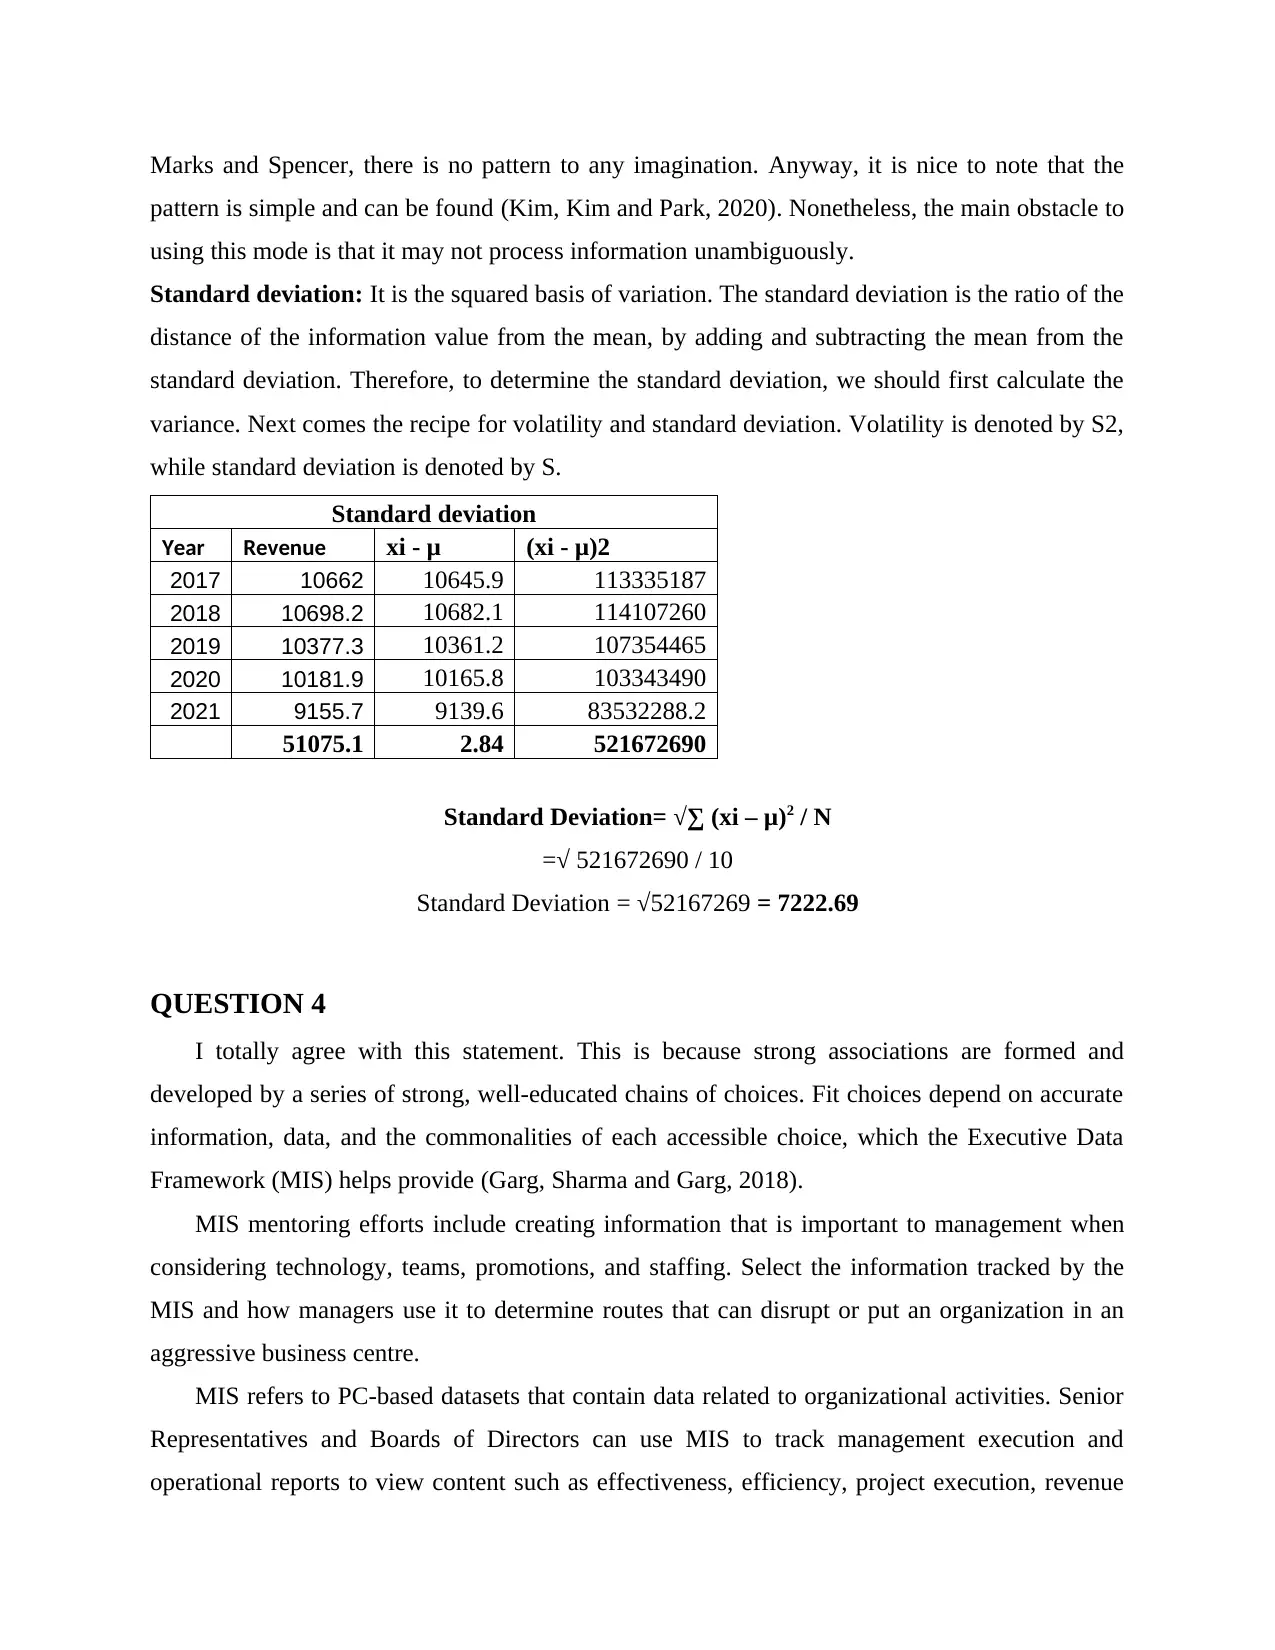
Standard deviation: It is the squared basis of variation. The standard deviation is the ratio of the
distance of the information value from the mean, by adding and subtracting the mean from the
standard deviation. Therefore, to determine the standard deviation, we should first calculate the
variance. Next comes the recipe for volatility and standard deviation. Volatility is denoted by S2,
while standard deviation is denoted by S.
Standard deviation
Year Revenue xi - μ (xi - μ)2
2017 10662 10645.9 113335187
2018 10698.2 10682.1 114107260
2019 10377.3 10361.2 107354465
2020 10181.9 10165.8 103343490
2021 9155.7 9139.6 83532288.2
51075.1 2.84 521672690
Standard Deviation= √∑ (xi – μ)2 / N
=√ 521672690 / 10
Standard Deviation = √52167269 = 7222.69
QUESTION 4
I totally agree with this statement. This is because strong associations are formed and
developed by a series of strong, well-educated chains of choices. Fit choices depend on accurate
information, data, and the commonalities of each accessible choice, which the Executive Data
Framework (MIS) helps provide (Garg, Sharma and Garg, 2018).
MIS mentoring efforts include creating information that is important to management when
considering technology, teams, promotions, and staffing. Select the information tracked by the
MIS and how managers use it to determine routes that can disrupt or put an organization in an
aggressive business centre.
MIS refers to PC-based datasets that contain data related to organizational activities. Senior
Representatives and Boards of Directors can use MIS to track management execution and
operational reports to view content such as effectiveness, efficiency, project execution, revenue
pattern is simple and can be found (Kim, Kim and Park, 2020). Nonetheless, the main obstacle to
using this mode is that it may not process information unambiguously.
Standard deviation: It is the squared basis of variation. The standard deviation is the ratio of the
distance of the information value from the mean, by adding and subtracting the mean from the
standard deviation. Therefore, to determine the standard deviation, we should first calculate the
variance. Next comes the recipe for volatility and standard deviation. Volatility is denoted by S2,
while standard deviation is denoted by S.
Standard deviation
Year Revenue xi - μ (xi - μ)2
2017 10662 10645.9 113335187
2018 10698.2 10682.1 114107260
2019 10377.3 10361.2 107354465
2020 10181.9 10165.8 103343490
2021 9155.7 9139.6 83532288.2
51075.1 2.84 521672690
Standard Deviation= √∑ (xi – μ)2 / N
=√ 521672690 / 10
Standard Deviation = √52167269 = 7222.69
QUESTION 4
I totally agree with this statement. This is because strong associations are formed and
developed by a series of strong, well-educated chains of choices. Fit choices depend on accurate
information, data, and the commonalities of each accessible choice, which the Executive Data
Framework (MIS) helps provide (Garg, Sharma and Garg, 2018).
MIS mentoring efforts include creating information that is important to management when
considering technology, teams, promotions, and staffing. Select the information tracked by the
MIS and how managers use it to determine routes that can disrupt or put an organization in an
aggressive business centre.
MIS refers to PC-based datasets that contain data related to organizational activities. Senior
Representatives and Boards of Directors can use MIS to track management execution and
operational reports to view content such as effectiveness, efficiency, project execution, revenue
and group transactions. Various MIS show a comparison of current execution to scheduled or
expected execution, with the ultimate goal being that chiefs can decide if they are behind,
achieving or exceeding their goals.
The significance of MIS in the dynamic cycle is that it can change the way the executive
body and the association as a whole. For example, if the MIS report shows that all but one
executive department is performing better than expected for quarterly execution, additional help
could be initiated to aid the effort's rallies, or the authorities may choose to fire and then replace
badly performing a group of (Lee and Kim, 2018).
There are different MIS managements for independent directions, including:
Choose an emotional support network. Regulators use these frameworks to facilitate class
selection.
A framework for information workers. These frameworks are used by workers who rely
on information to perform routine tasks, such as financial subject matter experts and
human resources personnel.
Office Automation Framework. These frameworks help enhance everyday practice in the
office environment and include such things as word processing applications, email and
voice messaging frameworks.
Lead Emotional Support Network. These frameworks provide senior administrations with
the information they expect when making significant choices about an organization's
curriculum and workforce execution procedures.
These MISs create reports on all types of information that are critical for administrator
guidance. It contains articles on professional execution, labour proficiency, readiness feasibility,
and work done and work that is still in progress or needs to be done. MIS can be used to analyse
expert executions, rank labour executions, and link executions to assumptions and forecasts.
For example, the design department of a major telecommunications company might have a
management information system that screens for responsibility for workers, occupations, errand
deadlines, and accuracy rates. When supervisors run MIS reports on a quarterly, monthly or
weekly basis, these reports will show late errands, workers who are performing below
partnership norms, and workers who are overworked. Executives then review these reports with
executives while engrossed in investigating issues in those meetings before turning them into
emergencies (Balta, 2019).
⊘ This is a preview!⊘
Do you want full access?
Subscribe today to unlock all pages.
Trusted by 1+ million students worldwide
1 out of 16
Related Documents


Your All-in-One AI-Powered Toolkit for Academic Success.
+13062052269
info@desklib.com
Available 24*7 on WhatsApp / Email
![[object Object]](/_next/static/media/star-bottom.7253800d.svg)
Unlock your academic potential
Copyright © 2020–2026 A2Z Services. All Rights Reserved. Developed and managed by ZUCOL.