Business Analyst Report: Newcastle United FC BI & Analytics (NX0472)

Verified

Added on  2020/06/04

|18
|2191
|100
Report
AI Summary
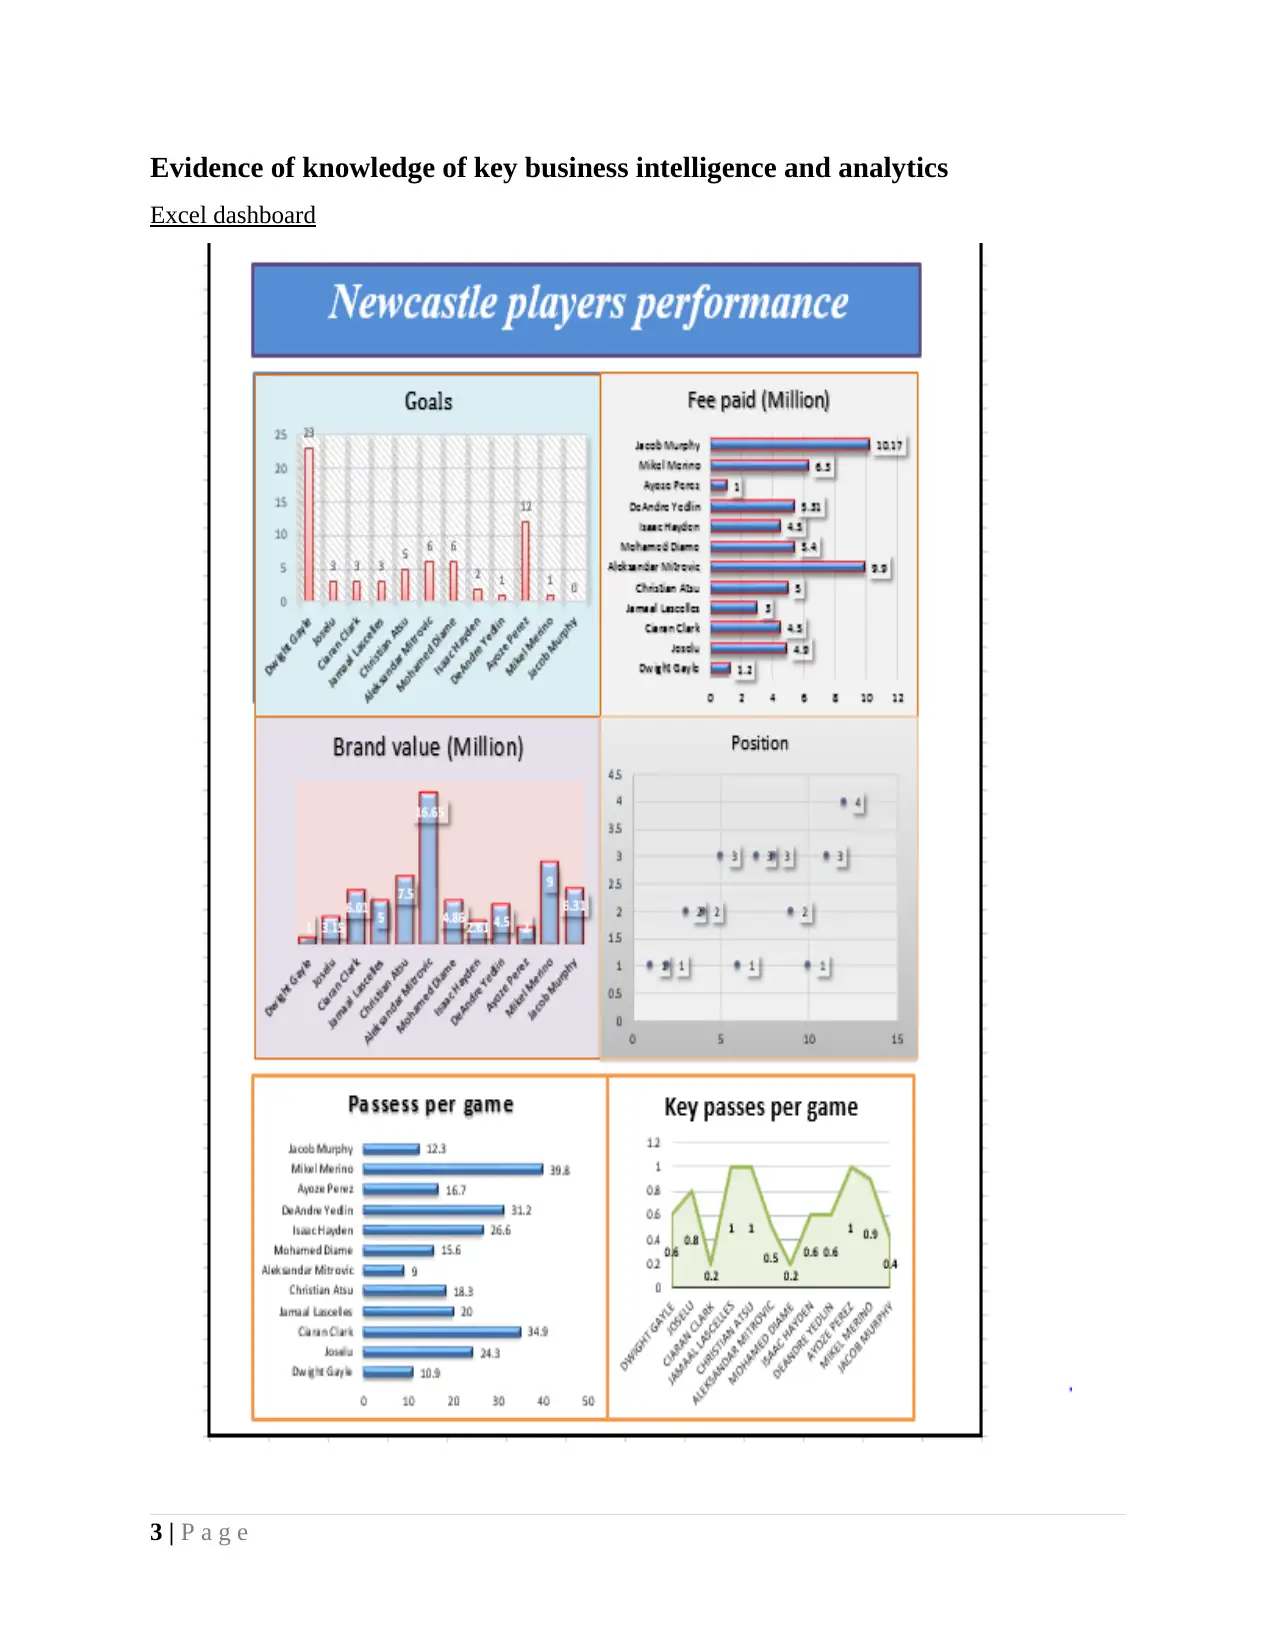
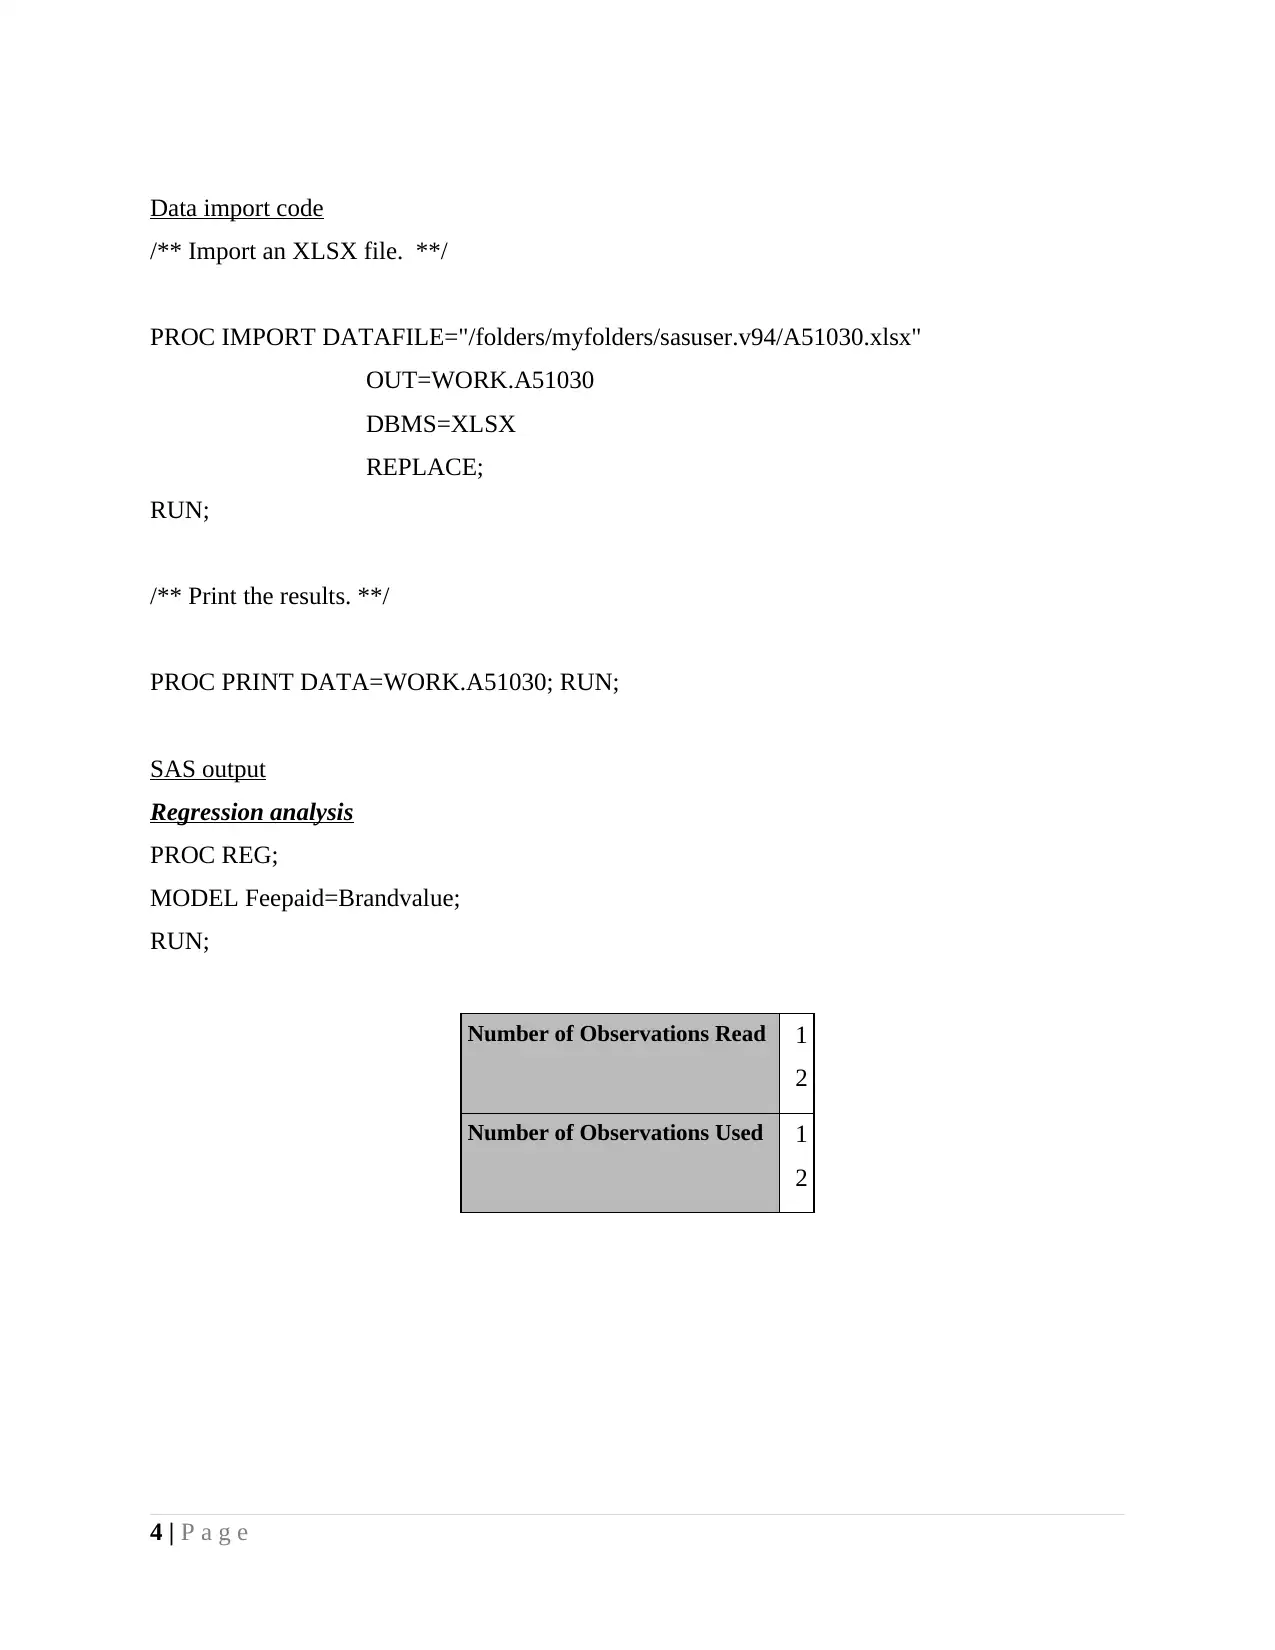
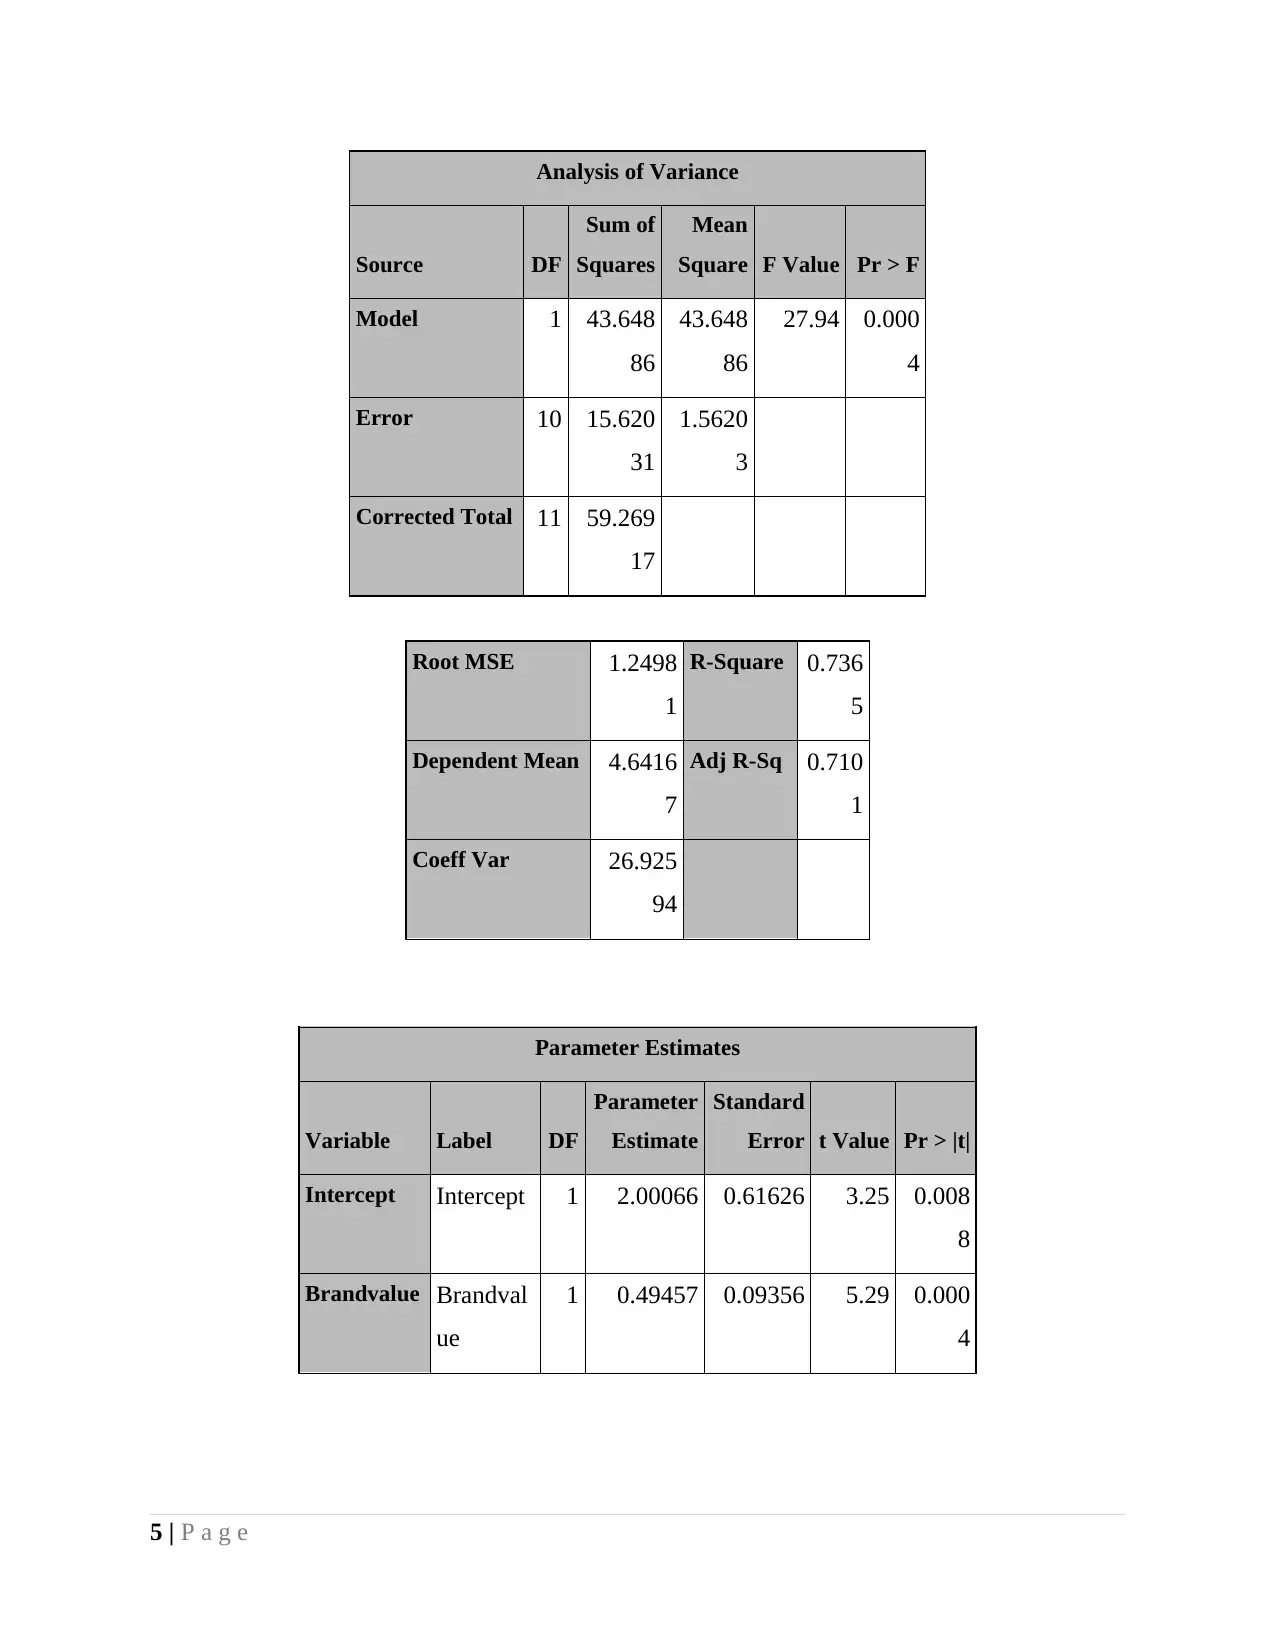
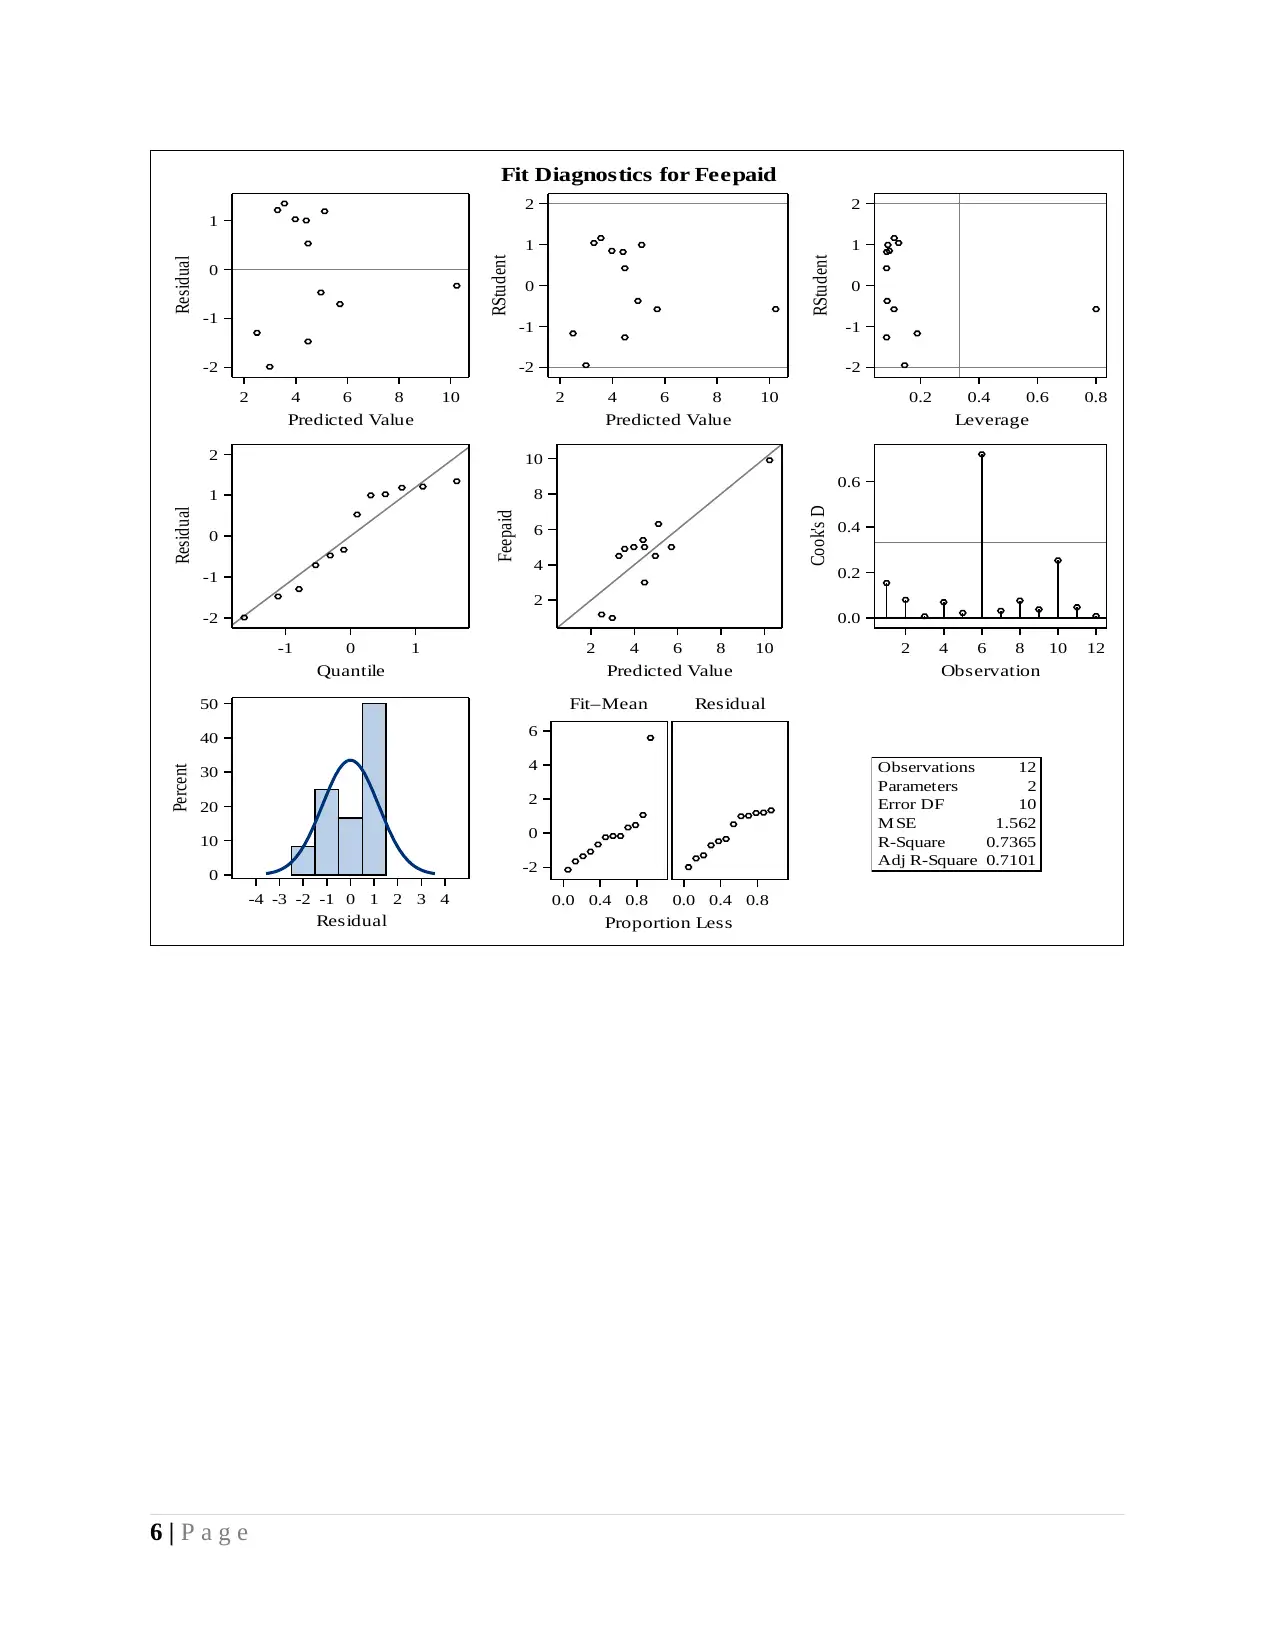
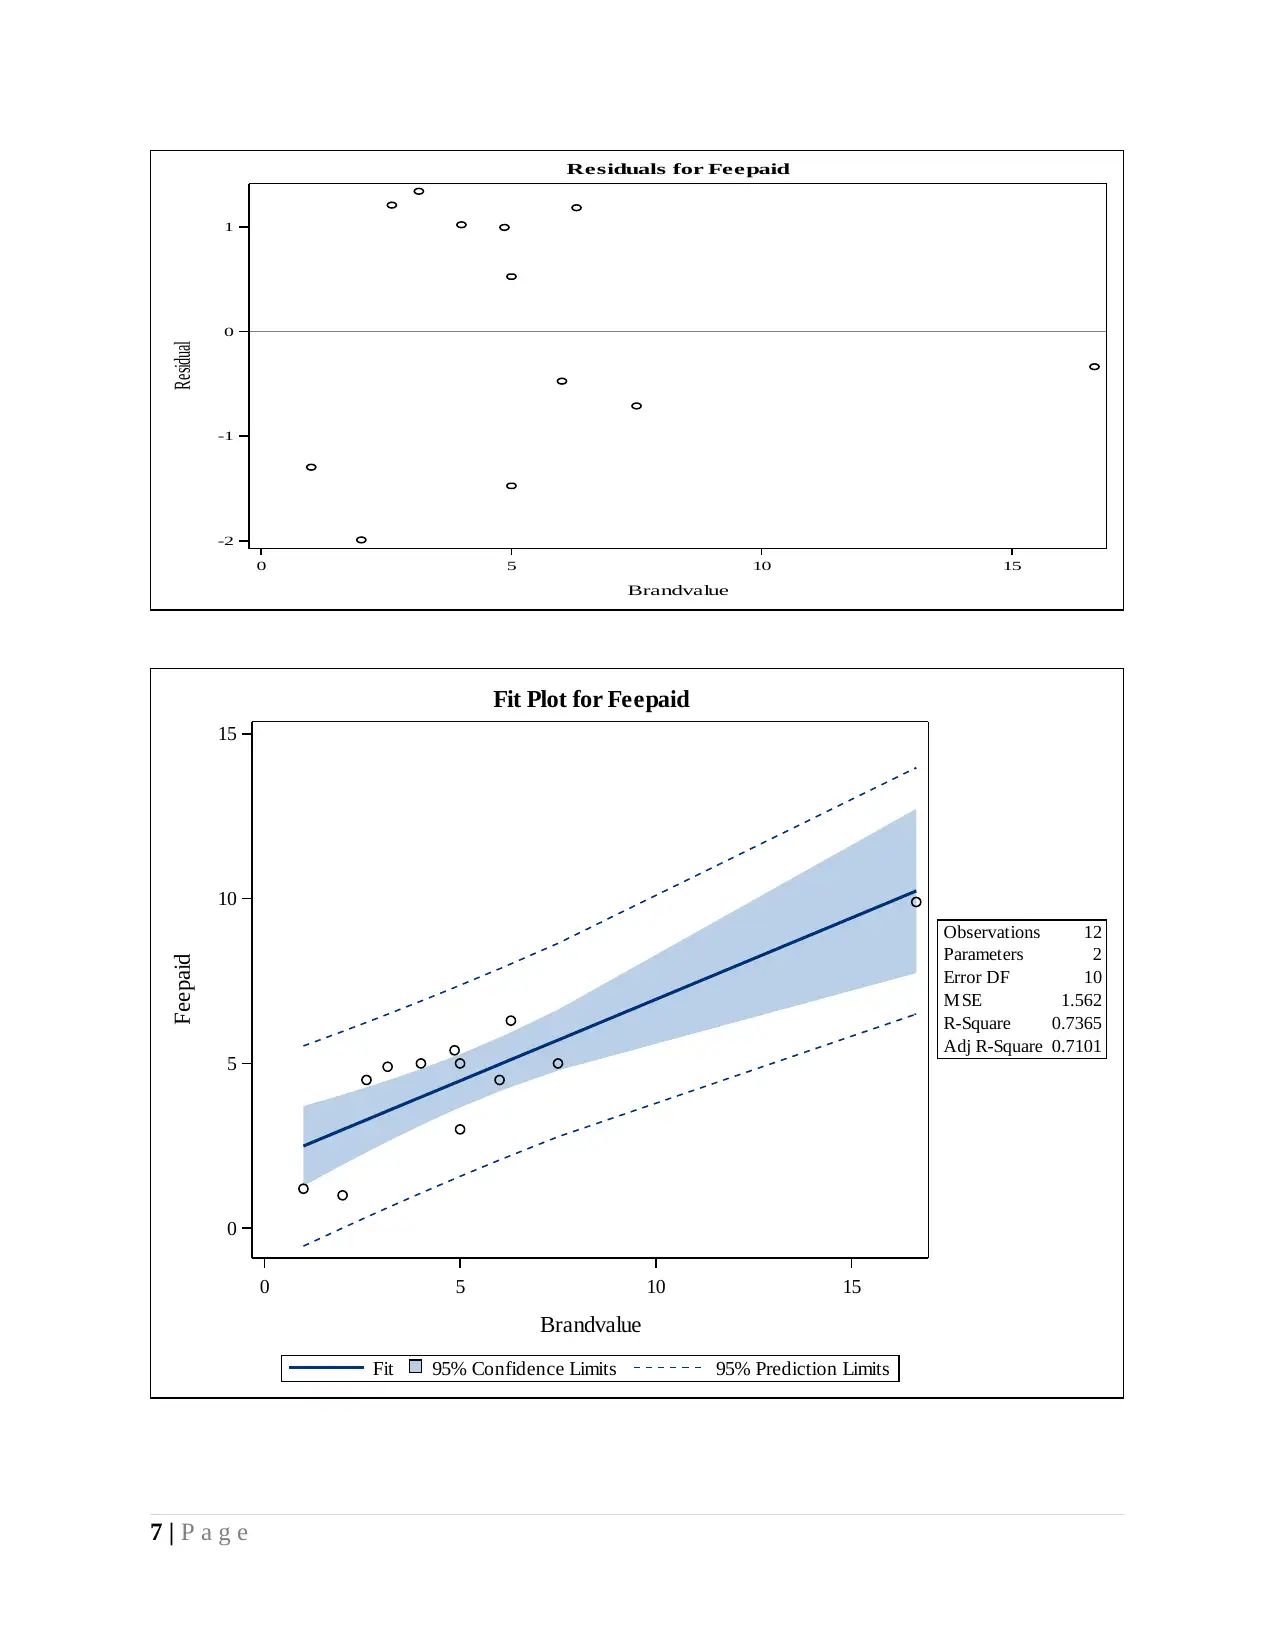
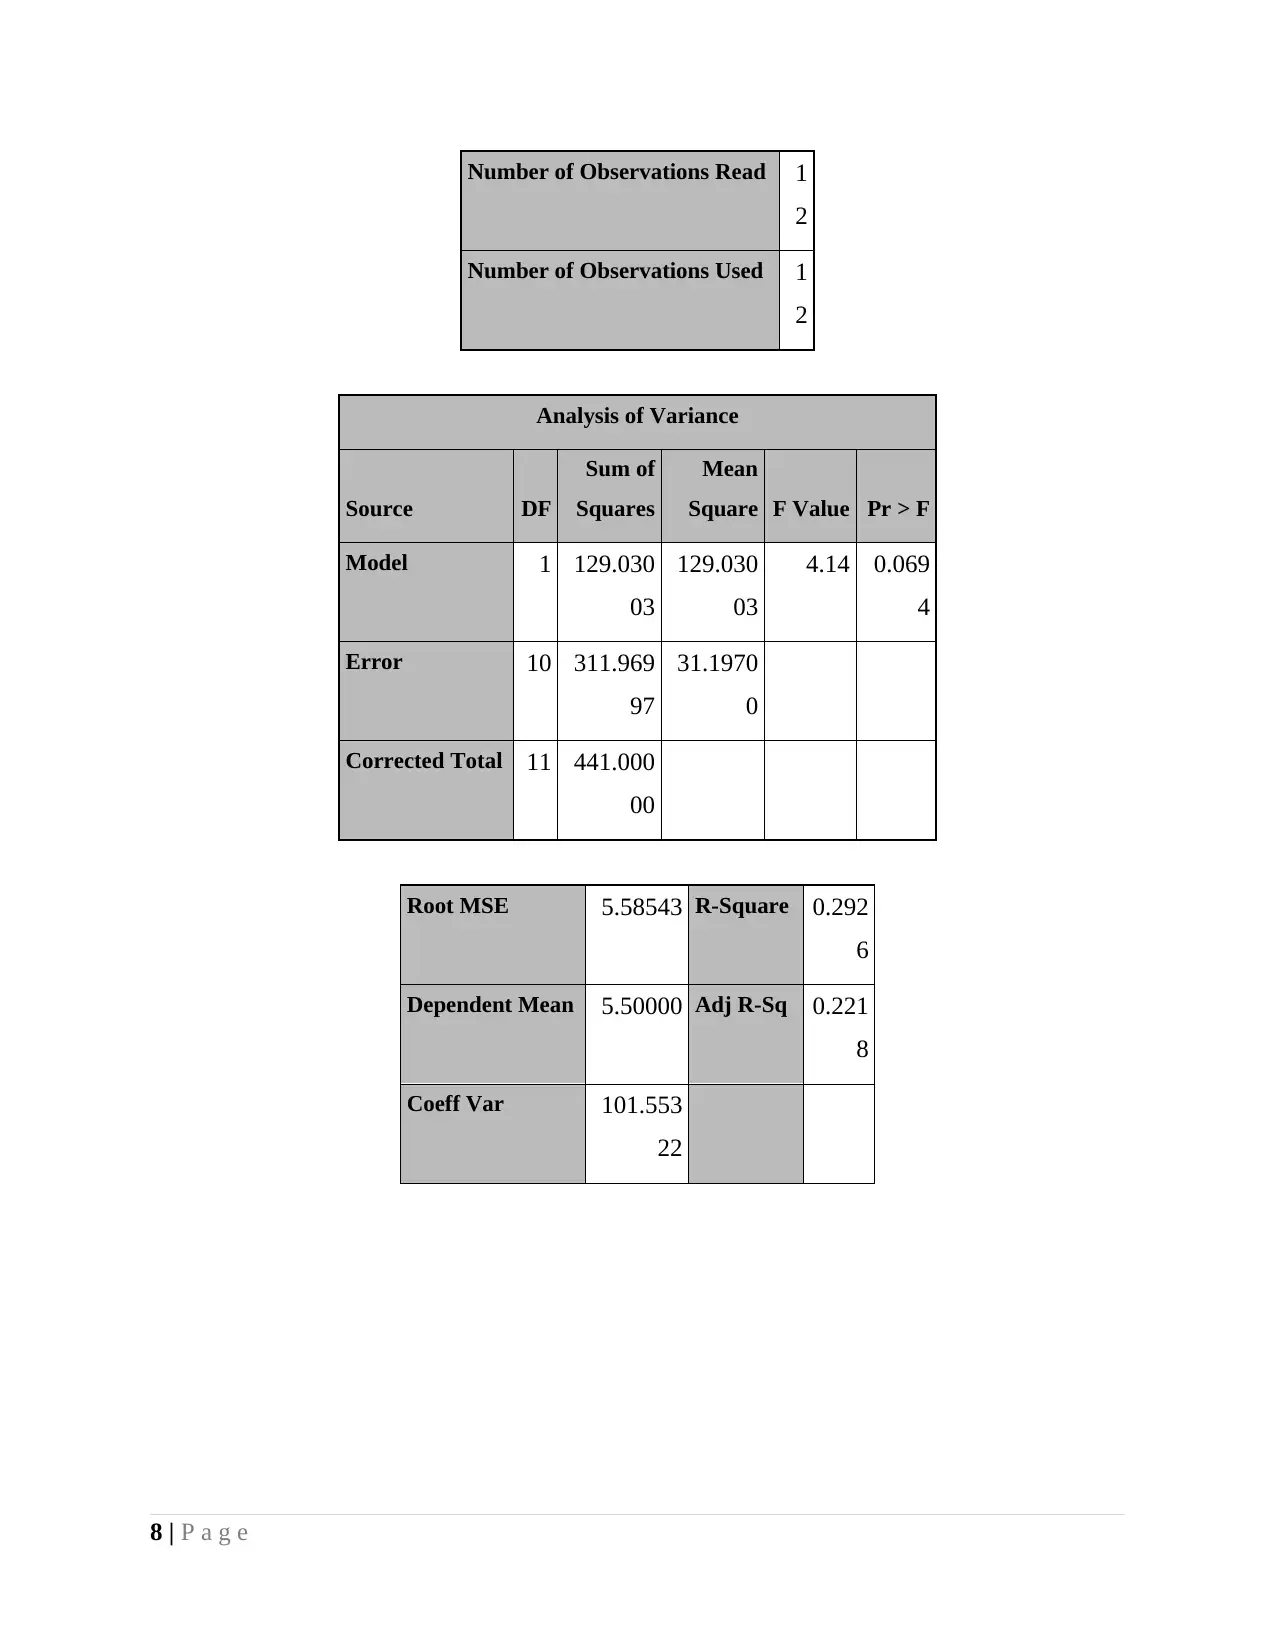
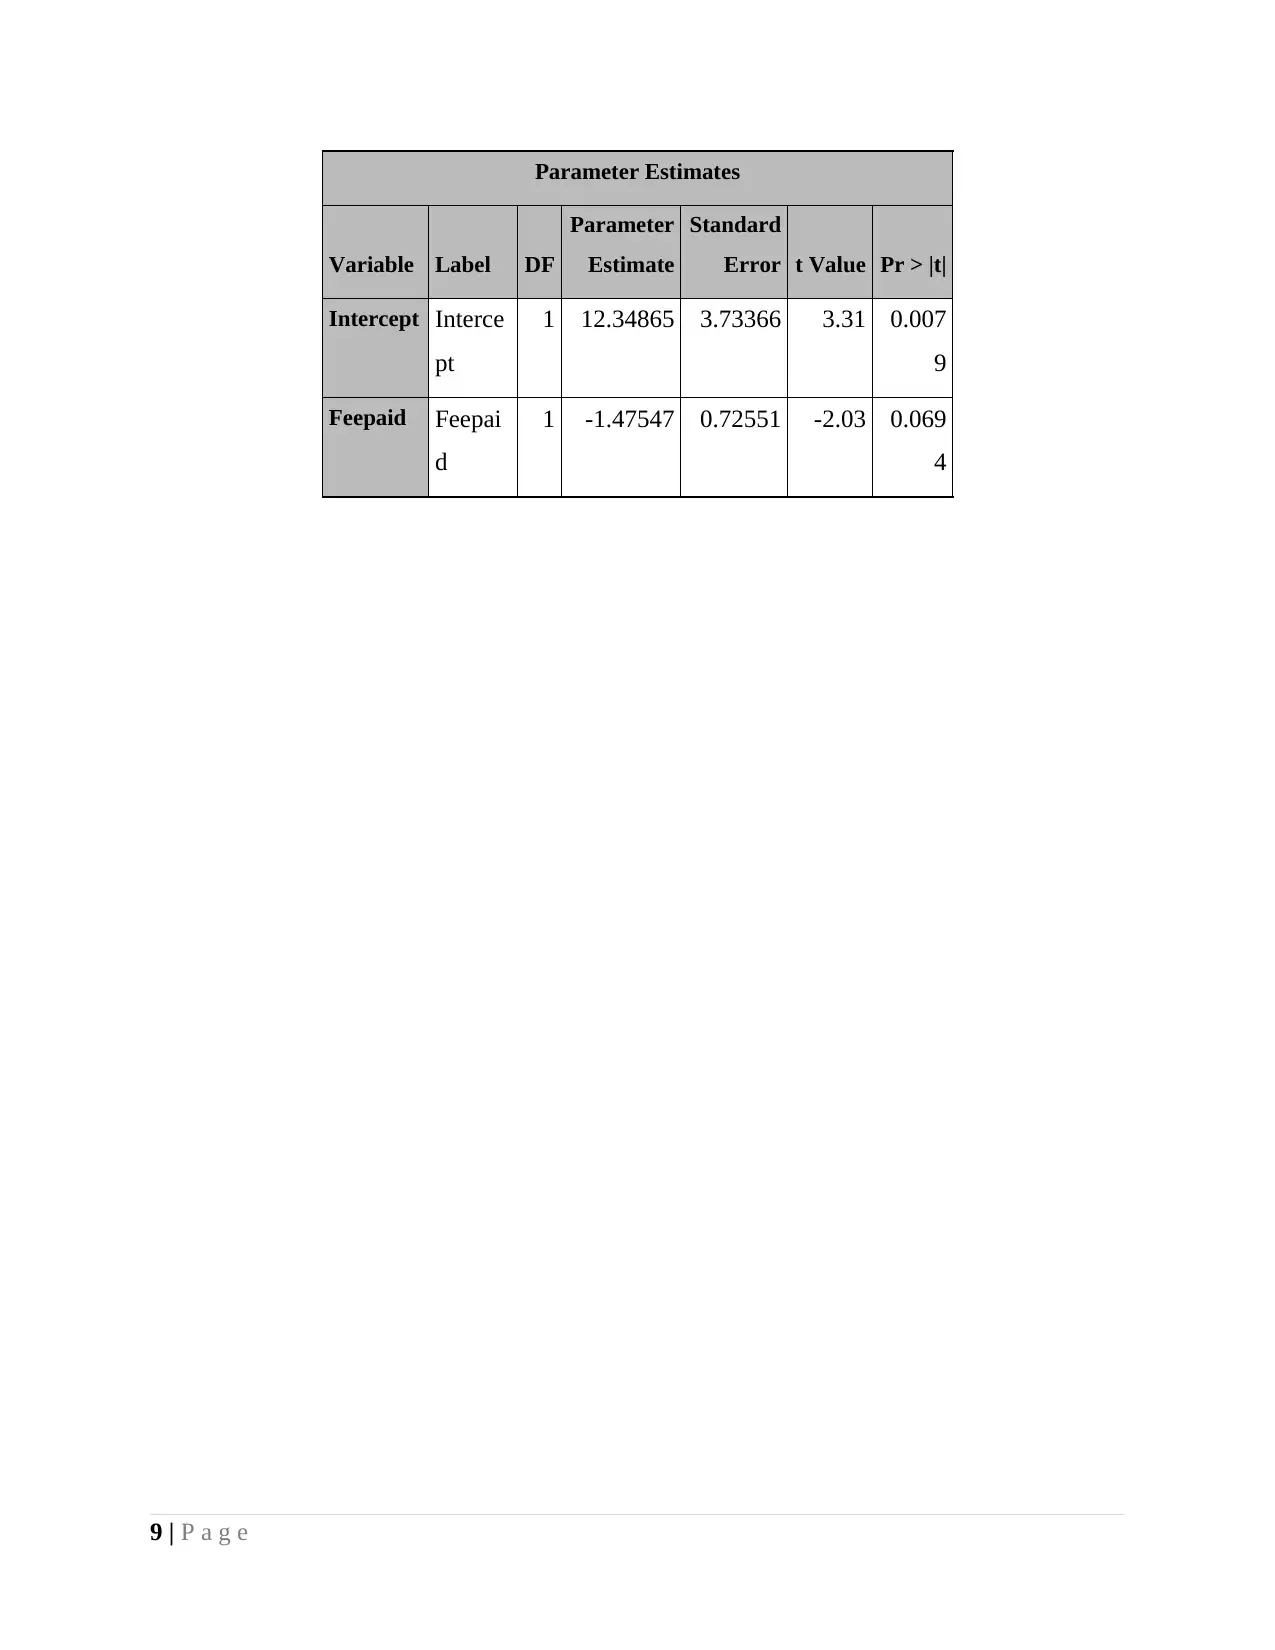
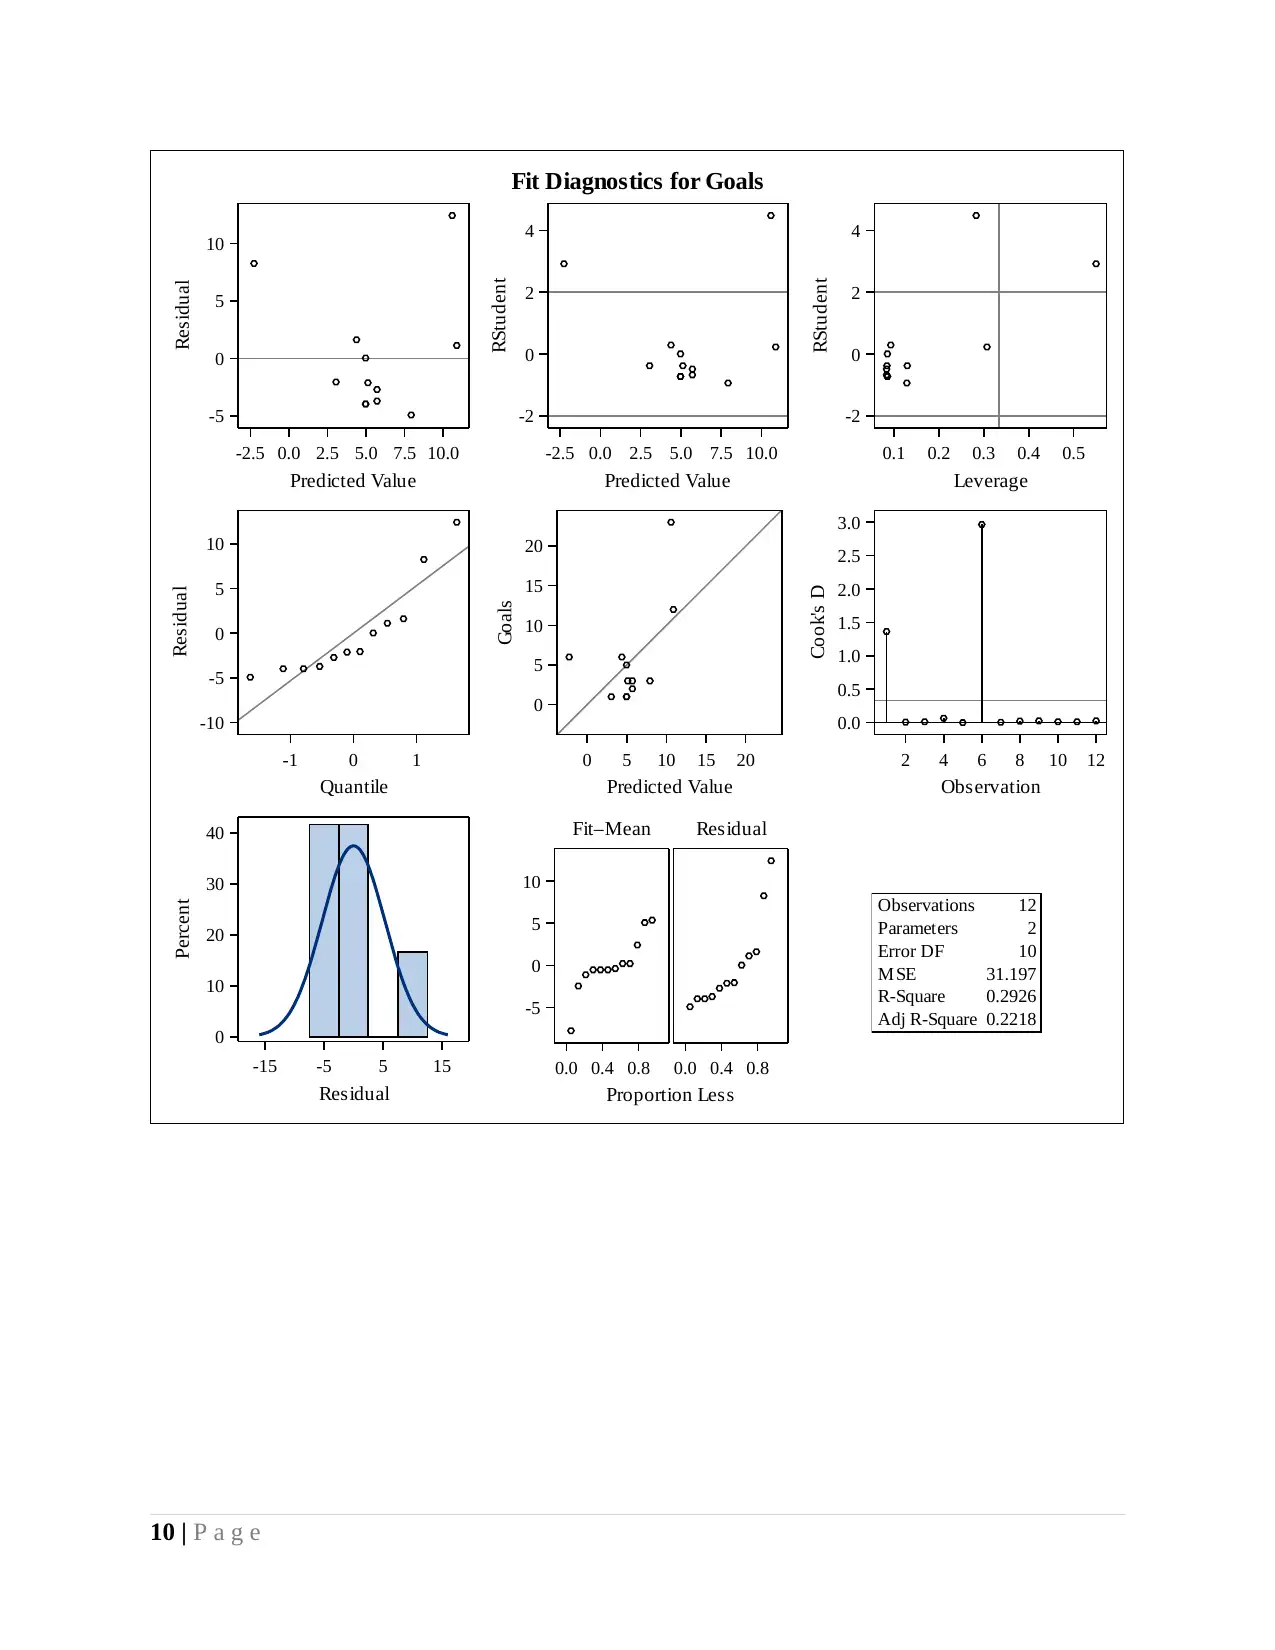
This report analyzes Newcastle United Football Club's (FC) performance using business intelligence (BI) and data analytics (DA). The study investigates the relationship between player fees and on-field performance, identifying key players and assessing the effectiveness of current payment structures. The report utilizes Excel dashboards for data visualization and SAS software for regression and cluster analysis. The analysis reveals that player fees do not directly correlate with performance, suggesting a need for a more data-driven approach to player valuation and team selection. The conclusion recommends a comprehensive BI system, including regular performance tracking in SQL server, to optimize player utilization and improve the football club's overall strategy. The report provides detailed analysis of the data, including the statistical output from SAS, and concludes with specific recommendations for the successful implementation of BI and DA solutions.
Document Page
BUSINESS ANALYST IN CHARGE OF
NEWCASTLE UNITED FOOTBALL
CLUB (FC)
tabler-icon-diamond-filled.svg

Paraphrase This Document

Need a fresh take? Get an instant paraphrase of this document with our AI Paraphraser
Document Page
TABLE OF CONTENTS
INTRODUCTION...........................................................................................................................1
Problem or opportunity statement for football club........................................................................1
Theoritical framework to link problem statement with business intelligence and analytics
systems.............................................................................................................................................2
Evidence of knowledge of key business intelligence and analytics................................................3
Excel dashboard...........................................................................................................................3
Data import code..........................................................................................................................4
SAS output...................................................................................................................................4
.......................................................................................................................................................15
Critical analysis and justification of effective and efficient use of BI and DA Systems
implemented..................................................................................................................................15
Conclusion and recommendation for successful implementation and use of BI and analytics
solution..........................................................................................................................................17
REFERENCES..............................................................................................................................18
Document Page
INTRODUCTION
Newcastle united FC is known as English professional association football club. It was
established in 1892 with the merger of Newcastle east end and west end. It has the member of
premier league for all. They have won four league championship titles, six FA cups and a charity
shield. It has ninth highest total of award won by an English club. This project report is all about
determining various issues and opportunity those are affecting performance of Football club.
There are certain evidences are collected regarding their business intelligence. It also provide
proper analysis about using BI / DA system in order to remove problems and performances. In
the present research study dashboard will be prepared and programing will be done on SAS in
respect to regression or any other technique. On basis of dashboard and results obtained from
SAS relevant conclusion and recommendation will be made in the report.
Problem or opportunity statement for football club
Football is one of the popular game in the Europe and viewed by large number of people
across the continent. In single football club there are specific number of players that are
purchased and higher amount of fees is paid to them. Out of all players there are few one that
perform good on ground and there are some people that failed to perform better. It is very
important to keep close track of players performance on ground and accordingly payment of fee
must be made to them. It must be noted that there is common thinking amog football association
maangers that if good amount will be paid to the players then definitely they will perform better
at ground (Halvorsen. and et.al., 2013). However, it is not necessary that always such kind of
assumptions will prove true. Hence, in present research study analysis of data will be done by
preparing dashboards and application of tools on SAS software which is linear regression. It can
be said that major problem that is faced by football association is that it is hard for them to
determine appropriate fee amount as higher amount is paid to players but they consistently failed
to make goals in match. Thus, football association need to be selective in respect to preparing
football team for next season. Solution of this problem will be identified by using dashboard and
results obtained on SAS.
1 | P a g e
Document Page
Theoritical framework to link problem statement with business intelligence
and analytics systems
Business intelliegence is the one of the important domain that assist firm in making its
business decisions. There are number of business intelligence tools like Tableau and Quilkview
or Excel in which attractive dashboards can be prepared (van Renesse and et.al., 2013). On these
dashboards variables are visualized which help one in understanding variable and making
business decisions. On other hand, there is another tool which is SAS in which data can be
imported and by using analysis methods like regression analysis and cluster analysis useful
information can be derived. It can be said that there is huge importance of analytics software for
the business firm. By using dashboard that is prepared in Excel it will be identified that which of
the player perform well on playground and amount of fee paid to it for playing from football
club. It can be said that by making comparison of both variables on single sheet one will be able
to determine that which players must be kept in football club after completion of duration of
contract and which one need to be expelled from club on ground of poor performance
(Newcastle limited, 2017). In analytics system which is SAS by using regression analysis method
relationship between fee paid and goals made will be identified. Varied tables generated by
regression analysis method will reflect that with change in one variable what sort of variation
comes in other variable. On other hand, cluster analysis method will reflect grouping of players
on basis of varied parameters which will support more to manager of football club in making
decisions.
2 | P a g e
tabler-icon-diamond-filled.svg

Paraphrase This Document

Need a fresh take? Get an instant paraphrase of this document with our AI Paraphraser
Document Page
Evidence of knowledge of key business intelligence and analytics
Excel dashboard
3 | P a g e
Document Page
Data import code
/** Import an XLSX file. **/
PROC IMPORT DATAFILE="/folders/myfolders/sasuser.v94/A51030.xlsx"
OUT=WORK.A51030
DBMS=XLSX
REPLACE;
RUN;
/** Print the results. **/
PROC PRINT DATA=WORK.A51030; RUN;
SAS output
Regression analysis
PROC REG;
MODEL Feepaid=Brandvalue;
RUN;
Number of Observations Read 1
2
Number of Observations Used 1
2
4 | P a g e
Document Page
Analysis of Variance
Source DF
Sum of
Squares
Mean
Square F Value Pr > F
Model 1 43.648
86
43.648
86
27.94 0.000
4
Error 10 15.620
31
1.5620
3
Corrected Total 11 59.269
17
Root MSE 1.2498
1
R-Square 0.736
5
Dependent Mean 4.6416
7
Adj R-Sq 0.710
1
Coeff Var 26.925
94
Parameter Estimates
Variable Label DF
Parameter
Estimate
Standard
Error t Value Pr > |t|
Intercept Intercept 1 2.00066 0.61626 3.25 0.008
8
Brandvalue Brandval
ue
1 0.49457 0.09356 5.29 0.000
4
5 | P a g e
tabler-icon-diamond-filled.svg

Paraphrase This Document

Need a fresh take? Get an instant paraphrase of this document with our AI Paraphraser
Document Page
Fit Diagnostics for Feepaid
0.7101Adj R-Square
0.7365R-Square
1.562M SE
10Error DF
2Parameters
12Observations
Proportion Less
0.0 0.4 0.8
Residual
0.0 0.4 0.8
Fit–Mean
-2
0
2
4
6
-4 -3 -2 -1 0 1 2 3 4
Residual
0
10
20
30
40
50
Percent
2 4 6 8 10 12
Observation
0.0
0.2
0.4
0.6
Cook's D
2 4 6 8 10
Predicted Value
2
4
6
8
10
Feepaid
-1 0 1
Quantile
-2
-1
0
1
2
Residual
0.2 0.4 0.6 0.8
Leverage
-2
-1
0
1
2
RStudent
2 4 6 8 10
Predicted Value
-2
-1
0
1
2
RStudent
2 4 6 8 10
Predicted Value
-2
-1
0
1
Residual
6 | P a g e
Document Page
0 5 10 15
Brandvalue
-2
-1
0
1
Residual
Residuals for Feepaid
0 5 10 15
Brandvalue
0
5
10
15
Feepaid
95% Prediction Limits95% Confidence LimitsFit
0.7101Adj R-Square
0.7365R-Square
1.562M SE
10Error DF
2Parameters
12Observations
Fit Plot for Feepaid
7 | P a g e
Document Page
Number of Observations Read 1
2
Number of Observations Used 1
2
Analysis of Variance
Source DF
Sum of
Squares
Mean
Square F Value Pr > F
Model 1 129.030
03
129.030
03
4.14 0.069
4
Error 10 311.969
97
31.1970
0
Corrected Total 11 441.000
00
Root MSE 5.58543 R-Square 0.292
6
Dependent Mean 5.50000 Adj R-Sq 0.221
8
Coeff Var 101.553
22
8 | P a g e
tabler-icon-diamond-filled.svg

Paraphrase This Document

Need a fresh take? Get an instant paraphrase of this document with our AI Paraphraser
Document Page
Parameter Estimates
Variable Label DF
Parameter
Estimate
Standard
Error t Value Pr > |t|
Intercept Interce
pt
1 12.34865 3.73366 3.31 0.007
9
Feepaid Feepai
d
1 -1.47547 0.72551 -2.03 0.069
4
9 | P a g e
Document Page
Fit Diagnostics for Goals
0.2218Adj R-Square
0.2926R-Square
31.197M SE
10Error DF
2Parameters
12Observations
Proportion Less
0.0 0.4 0.8
Residual
0.0 0.4 0.8
Fit–Mean
-5
0
5
10
-15 -5 5 15
Residual
0
10
20
30
40
Percent
2 4 6 8 10 12
Observation
0.0
0.5
1.0
1.5
2.0
2.5
3.0
Cook's D
0 5 10 15 20
Predicted Value
0
5
10
15
20
Goals
-1 0 1
Quantile
-10
-5
0
5
10
Residual
0.1 0.2 0.3 0.4 0.5
Leverage
-2
0
2
4
RStudent
-2.5 0.0 2.5 5.0 7.5 10.0
Predicted Value
-2
0
2
4
RStudent
-2.5 0.0 2.5 5.0 7.5 10.0
Predicted Value
-5
0
5
10
Residual
10 | P a g e
chevron_up_icon
1 out of 18
circle_padding
hide_on_mobile
zoom_out_icon