Business Analytics: Costing and Revenue Behavior, Advertising Expenditure Impact, and Marketing Strategies
Added on 2022-12-13
14 Pages4495 Words213 Views
Business Analytic
Table of Contents
INTRODUCTION...........................................................................................................................3
TASKS.............................................................................................................................................3
Question 1....................................................................................................................................3
Question 2....................................................................................................................................5
Question 4....................................................................................................................................7
CONCLUSION................................................................................................................................9
REFERENCES..............................................................................................................................10
INTRODUCTION
The practise about using quantitative approaches to extract value from data to create better
company operations is known as business analytics (Al-Mudimigh, Zairi and Al-Mashari, 2018).
BA is really a collection of knowledge, tools, and methods that are used to analyse a firm's
findings and analysis throughout order to generate knowledge and create data-driven mistakes in
coping with the best. BA's mission is to determine which databases are valuable but which can
boost sales, growth and performance. When it comes to private companies and processing
information from a large number of channels, BA includes multiple applications. Cloud apps,
marketing automation systems and CRM systems are also examples of this methodology. To find
trends in databases, use predictive analytics as well as statistics. These dynamics will assist
others in predicting future movements and gaining new insights into the customer and the
attitudes. In actual, keep an eye on KPIs and patterns and this allows companies to not only
provide all of their information in one location, as well as to create fast and reliable decisions.
This should be focused on the latest up-to-date facts. They should be confident that they are well
prepared about not one, but many separate cases because BA has such a large array of evidence
to back up the decisions.
In the report, three question are addressed related with costing and revenue behaviour,
impact of advertising expenditure on sales and company can gain a competitive advantage in the
fitness industry by adopting other relevant marketing strategies. In addition, national statistical
archives for any two economic variables which are correlated that is GDP and employment is
discussed in this report.
TASKS
Question 1
A) Mathematical model
The mathematical model for the above cost information is as follows:
Budgeted annual output= 180000 unit
Fixed cost= 60000
Variable cost= 0.75 per unit = (0.75 * 180000) = 135000
Sales price = 2. Per unit = 360000
B) Profit or loss of MKF Ltd.
Total profit for the company for the above information is calculated below:
Profit = Sales – (Fixed cost + variable cost)
= 360000 – (60000+135000)
= 360000 – 195000
= 165000 GBP
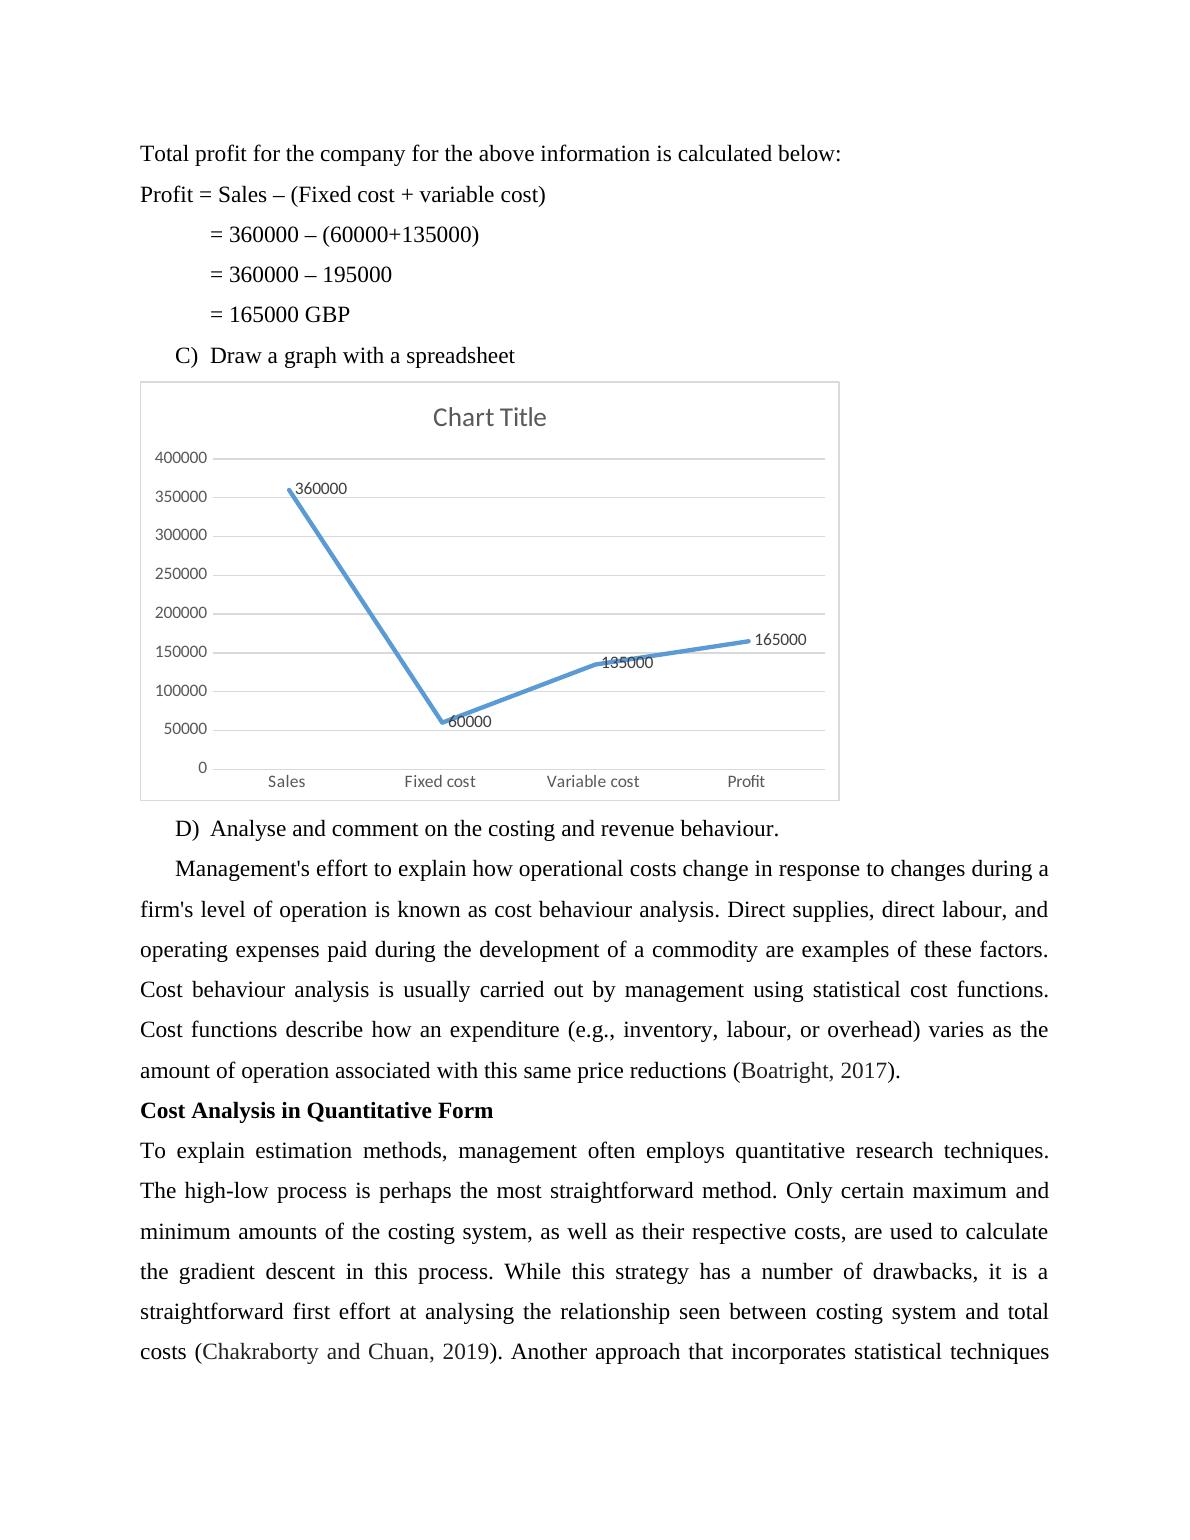
C) Draw a graph with a spreadsheet
Sales Fixed cost Variable cost Profit
0
50000
100000
150000
200000
250000
300000
350000
400000
360000
60000
135000
165000
Chart Title
D) Analyse and comment on the costing and revenue behaviour.
Management's effort to explain how operational costs change in response to changes during a
firm's level of operation is known as cost behaviour analysis. Direct supplies, direct labour, and
operating expenses paid during the development of a commodity are examples of these factors.
Cost behaviour analysis is usually carried out by management using statistical cost functions.
Cost functions describe how an expenditure (e.g., inventory, labour, or overhead) varies as the
amount of operation associated with this same price reductions (Boatright, 2017).
Cost Analysis in Quantitative Form
To explain estimation methods, management often employs quantitative research techniques.
The high-low process is perhaps the most straightforward method. Only certain maximum and
minimum amounts of the costing system, as well as their respective costs, are used to calculate
the gradient descent in this process. While this strategy has a number of drawbacks, it is a
straightforward first effort at analysing the relationship seen between costing system and total
costs (Chakraborty and Chuan, 2019). Another approach that incorporates statistical techniques
Profit = Sales – (Fixed cost + variable cost)
= 360000 – (60000+135000)
= 360000 – 195000
= 165000 GBP
C) Draw a graph with a spreadsheet
Sales Fixed cost Variable cost Profit
0
50000
100000
150000
200000
250000
300000
350000
400000
360000
60000
135000
165000
Chart Title
D) Analyse and comment on the costing and revenue behaviour.
Management's effort to explain how operational costs change in response to changes during a
firm's level of operation is known as cost behaviour analysis. Direct supplies, direct labour, and
operating expenses paid during the development of a commodity are examples of these factors.
Cost behaviour analysis is usually carried out by management using statistical cost functions.
Cost functions describe how an expenditure (e.g., inventory, labour, or overhead) varies as the
amount of operation associated with this same price reductions (Boatright, 2017).
Cost Analysis in Quantitative Form
To explain estimation methods, management often employs quantitative research techniques.
The high-low process is perhaps the most straightforward method. Only certain maximum and
minimum amounts of the costing system, as well as their respective costs, are used to calculate
the gradient descent in this process. While this strategy has a number of drawbacks, it is a
straightforward first effort at analysing the relationship seen between costing system and total
costs (Chakraborty and Chuan, 2019). Another approach that incorporates statistical techniques
End of preview
Want to access all the pages? Upload your documents or become a member.
Related Documents
Business Analytics: Costing and Revenue Behavior, Advertising Expenditure Impactlg...
|13
|4638
|483
Business Analytics: Mathematical Model, Costing, and Advertisement Impactlg...
|20
|4639
|92
Impact of Advertising Expenditure on Sales Revenuelg...
|17
|4457
|157
Business Analytics: Mathematical Model, Analysis, and Break-even Analysislg...
|11
|1646
|60
LUBM303 : Business Analyticlg...
|18
|3687
|356
Business Analytics: Mathematical Model, Costing and Revenue Behaviour, Advertising Impact on Saleslg...
|15
|4547
|125