MITS6002 Business Analytics Assignment: Retail Insights & Regression
VerifiedAdded on 2023/03/30
|9
|1212
|387
Homework Assignment
AI Summary
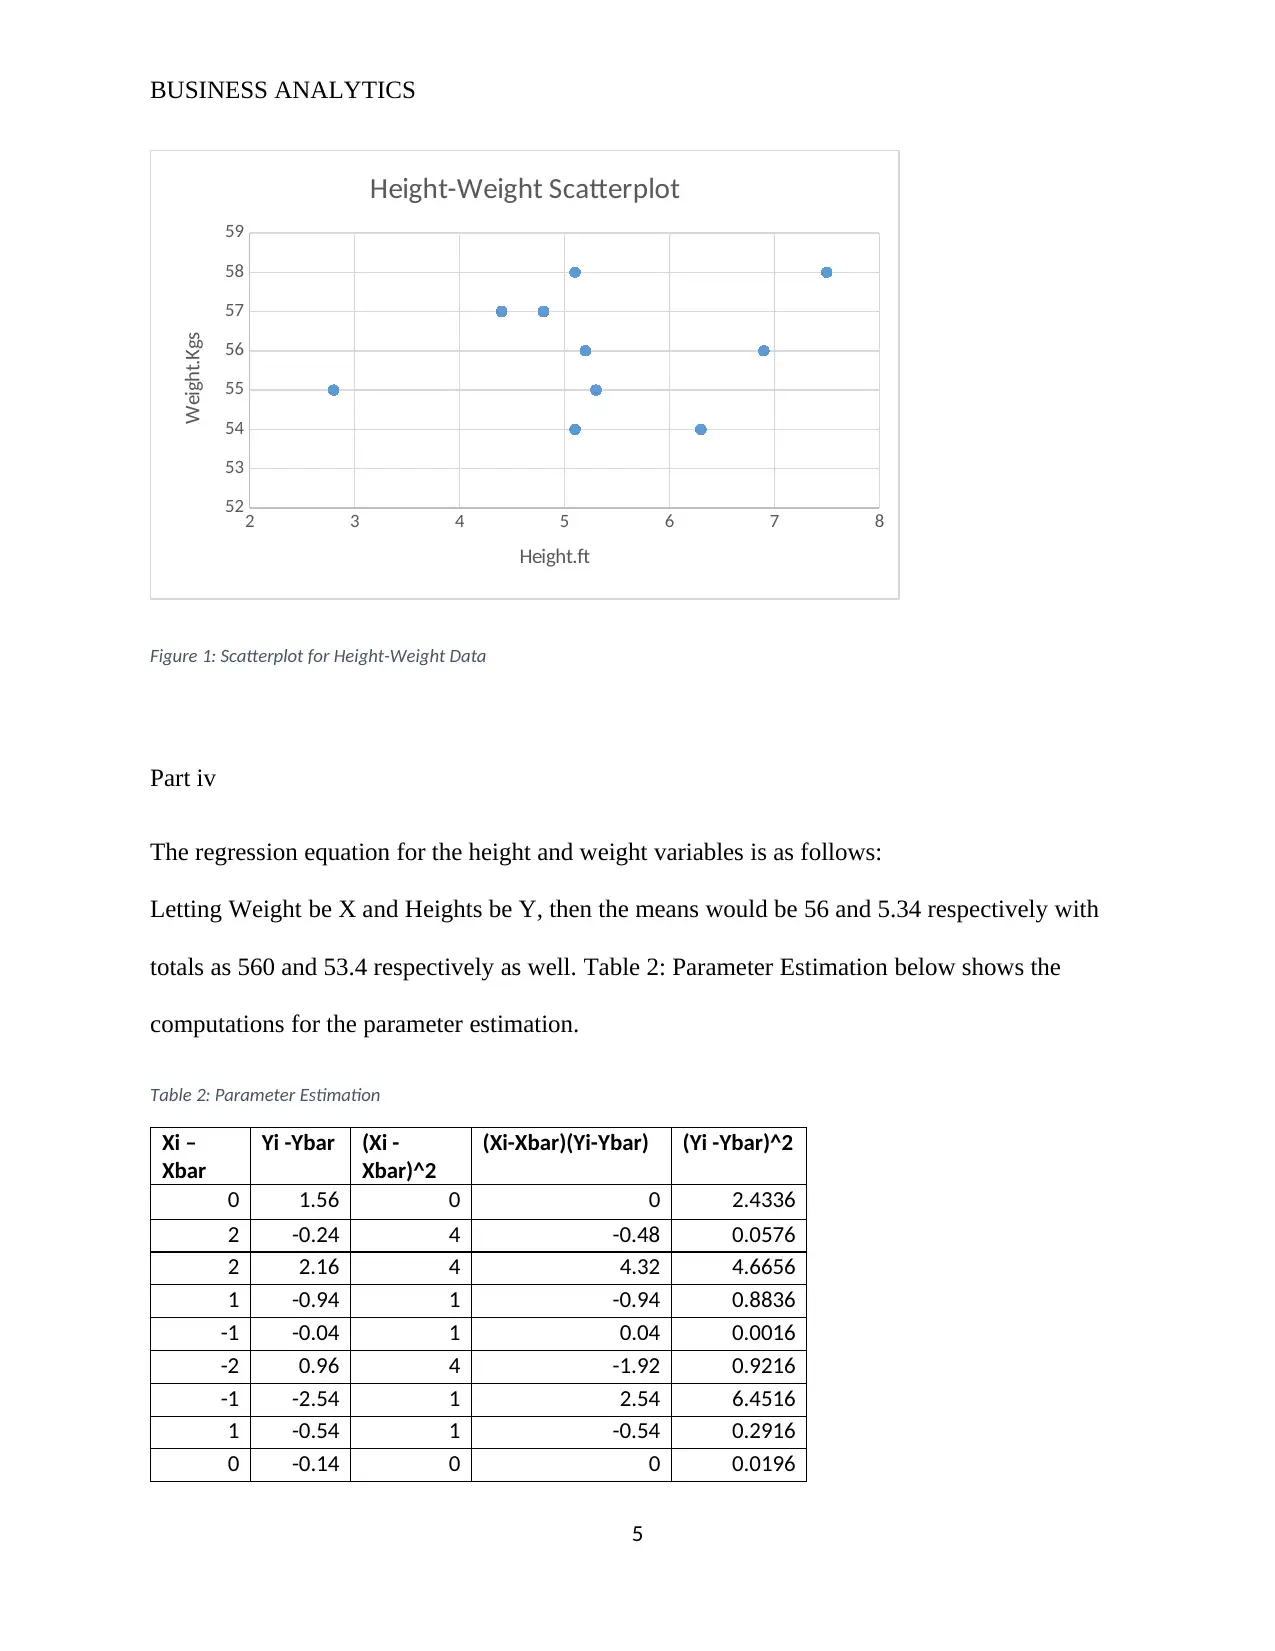
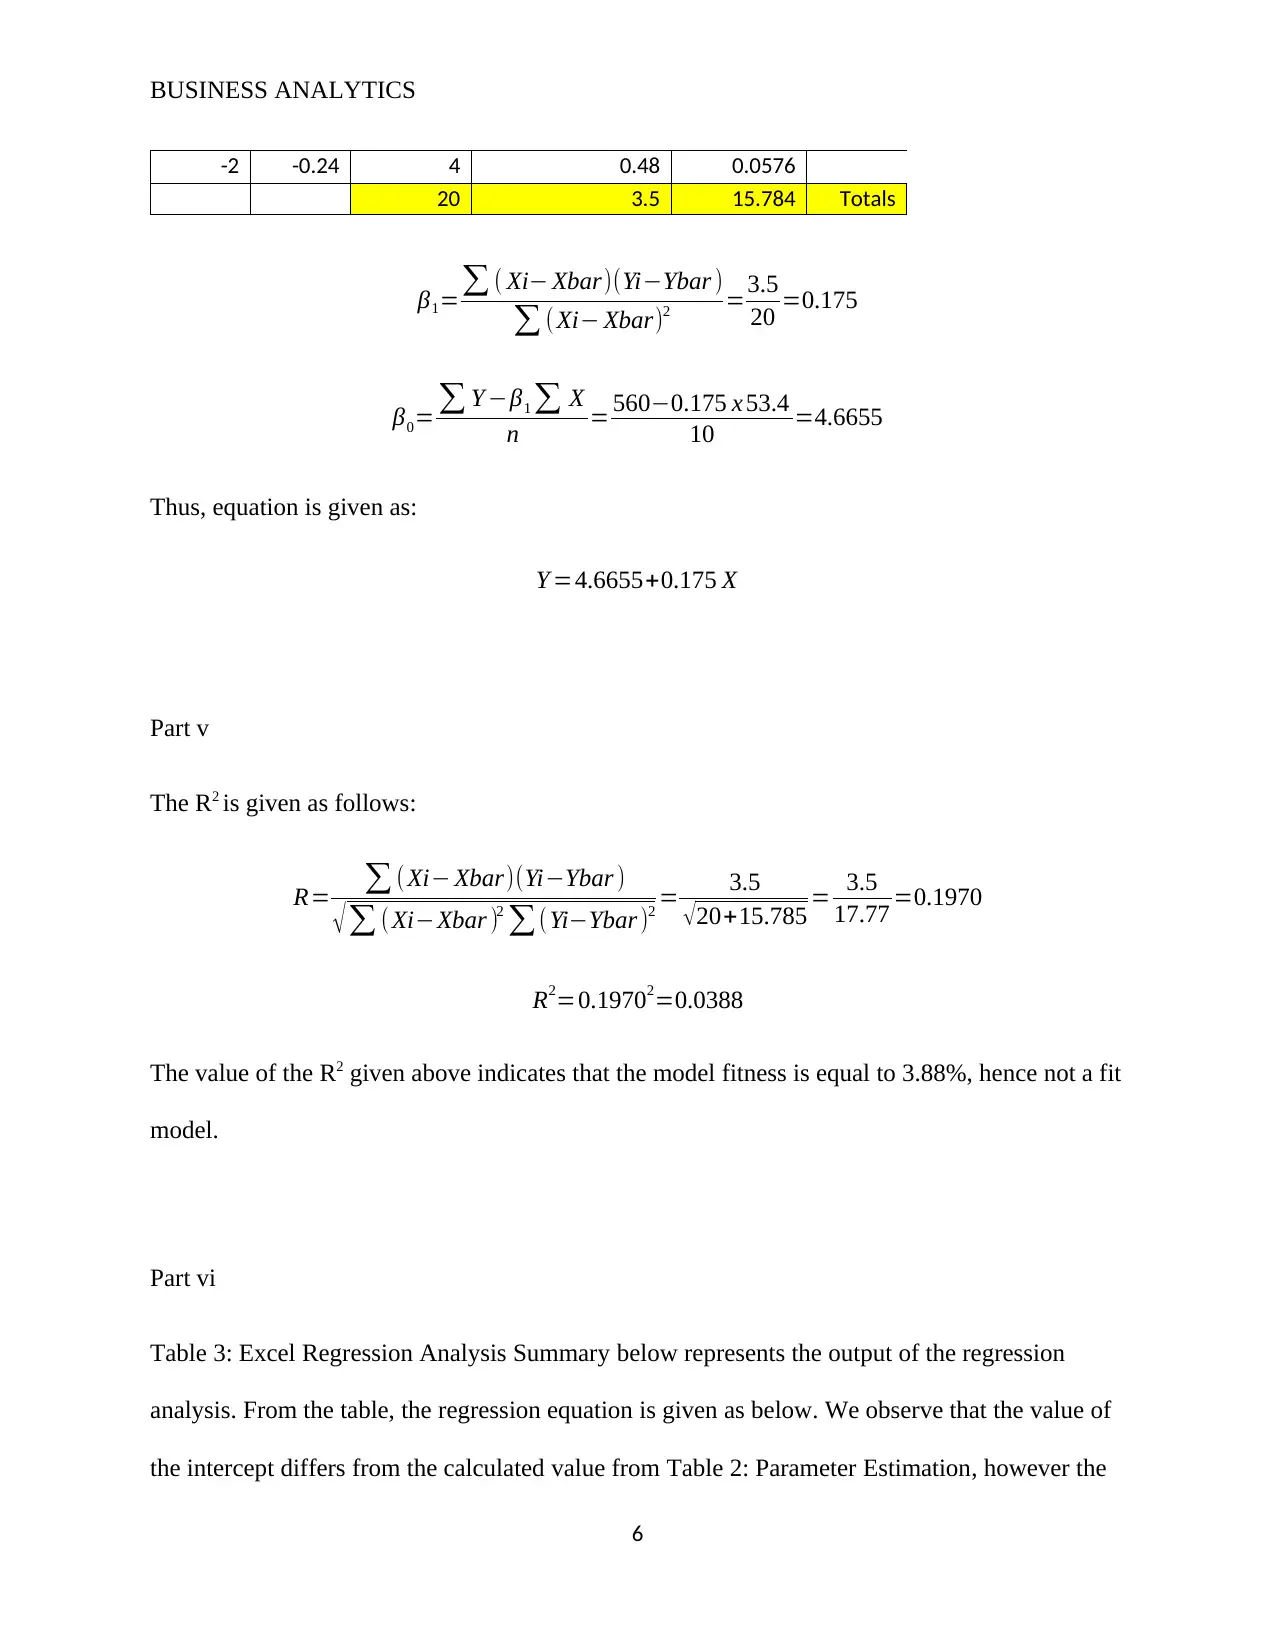
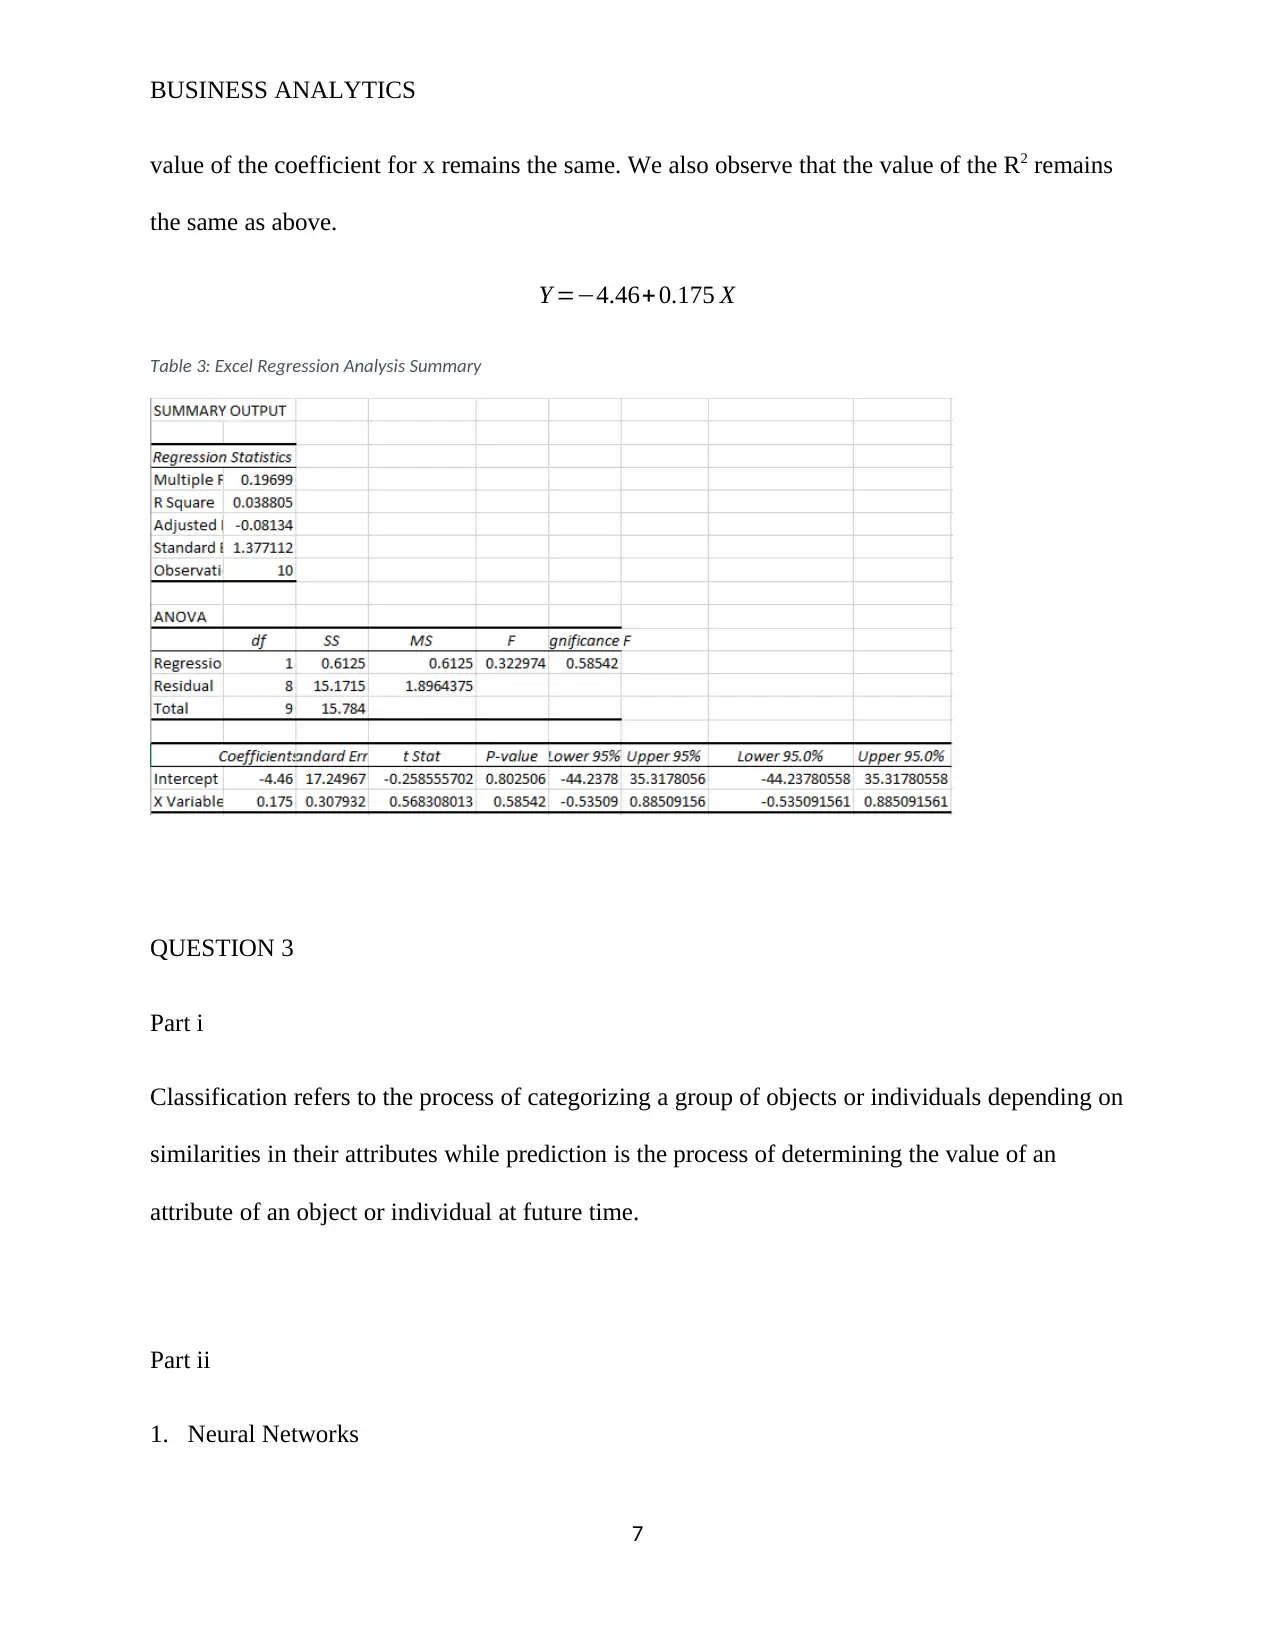
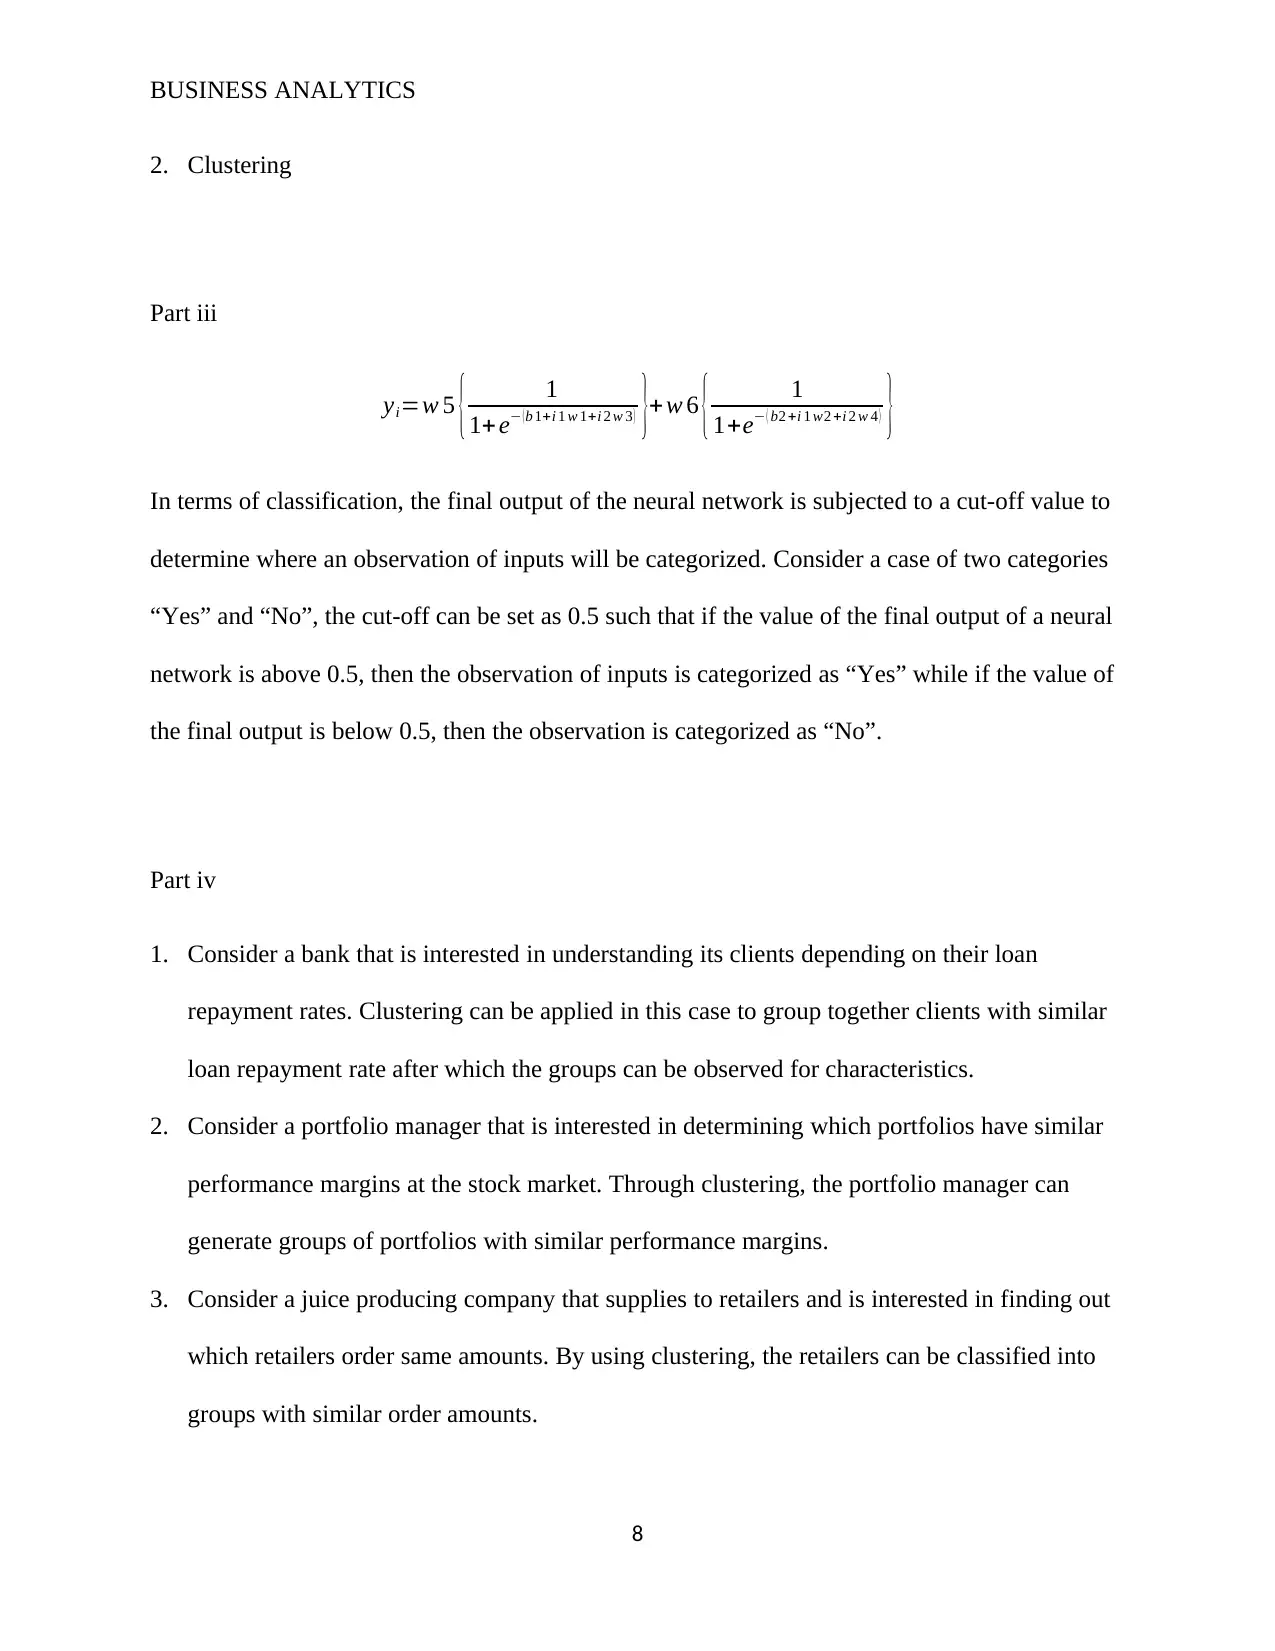
This assignment solution addresses key questions related to business analytics, focusing on the CommBank Retail Business Insight Report FY2018 and regression analysis. It evaluates the report's visualization quality, presentability, and information relevance, extracting key insights for decision-making and suggesting improvements. The solution also delves into regression analysis, providing an example of its application in determining consumer behavior trends, computing the regression line equation using height and weight data, calculating the R2 value, and using Excel for regression analysis. Furthermore, it differentiates between classification and prediction, explains the application of neural networks in classification, and provides examples of clustering applications in various business contexts, such as banking, portfolio management, and juice production. The neural network section demonstrates the application with equations and cut-off values. The assignment uses data to determine relationships among variables.

1 out of 9
Related Documents


Your All-in-One AI-Powered Toolkit for Academic Success.
+13062052269
info@desklib.com
Available 24*7 on WhatsApp / Email
![[object Object]](/_next/static/media/star-bottom.7253800d.svg)
Copyright © 2020–2026 A2Z Services. All Rights Reserved. Developed and managed by ZUCOL.