Business Analytics: Power BI Report on Hartford Restaurant Analysis
VerifiedAdded on 2023/06/12
|8
|726
|256
Report
AI Summary
This report details a business analytics project focused on restaurants in Hartford, utilizing Power BI for data analysis and visualization. The initial steps involved loading a dataset of Class 1 through Class 4 restaurant establishments into Power BI, defining appropriate data types, and addressing d...

Business Analytics
Name of the Student
Name of the University
Author Note
Name of the Student
Name of the University
Author Note
Paraphrase This Document
Need a fresh take? Get an instant paraphrase of this document with our AI Paraphraser

Table of Contents
Answer to question 1..................................................................................................................3
Answer to question 2:.................................................................................................................4
Answer to question 3:.................................................................................................................4
Answer to question 4:.................................................................................................................7
Bibliography...............................................................................................................................8
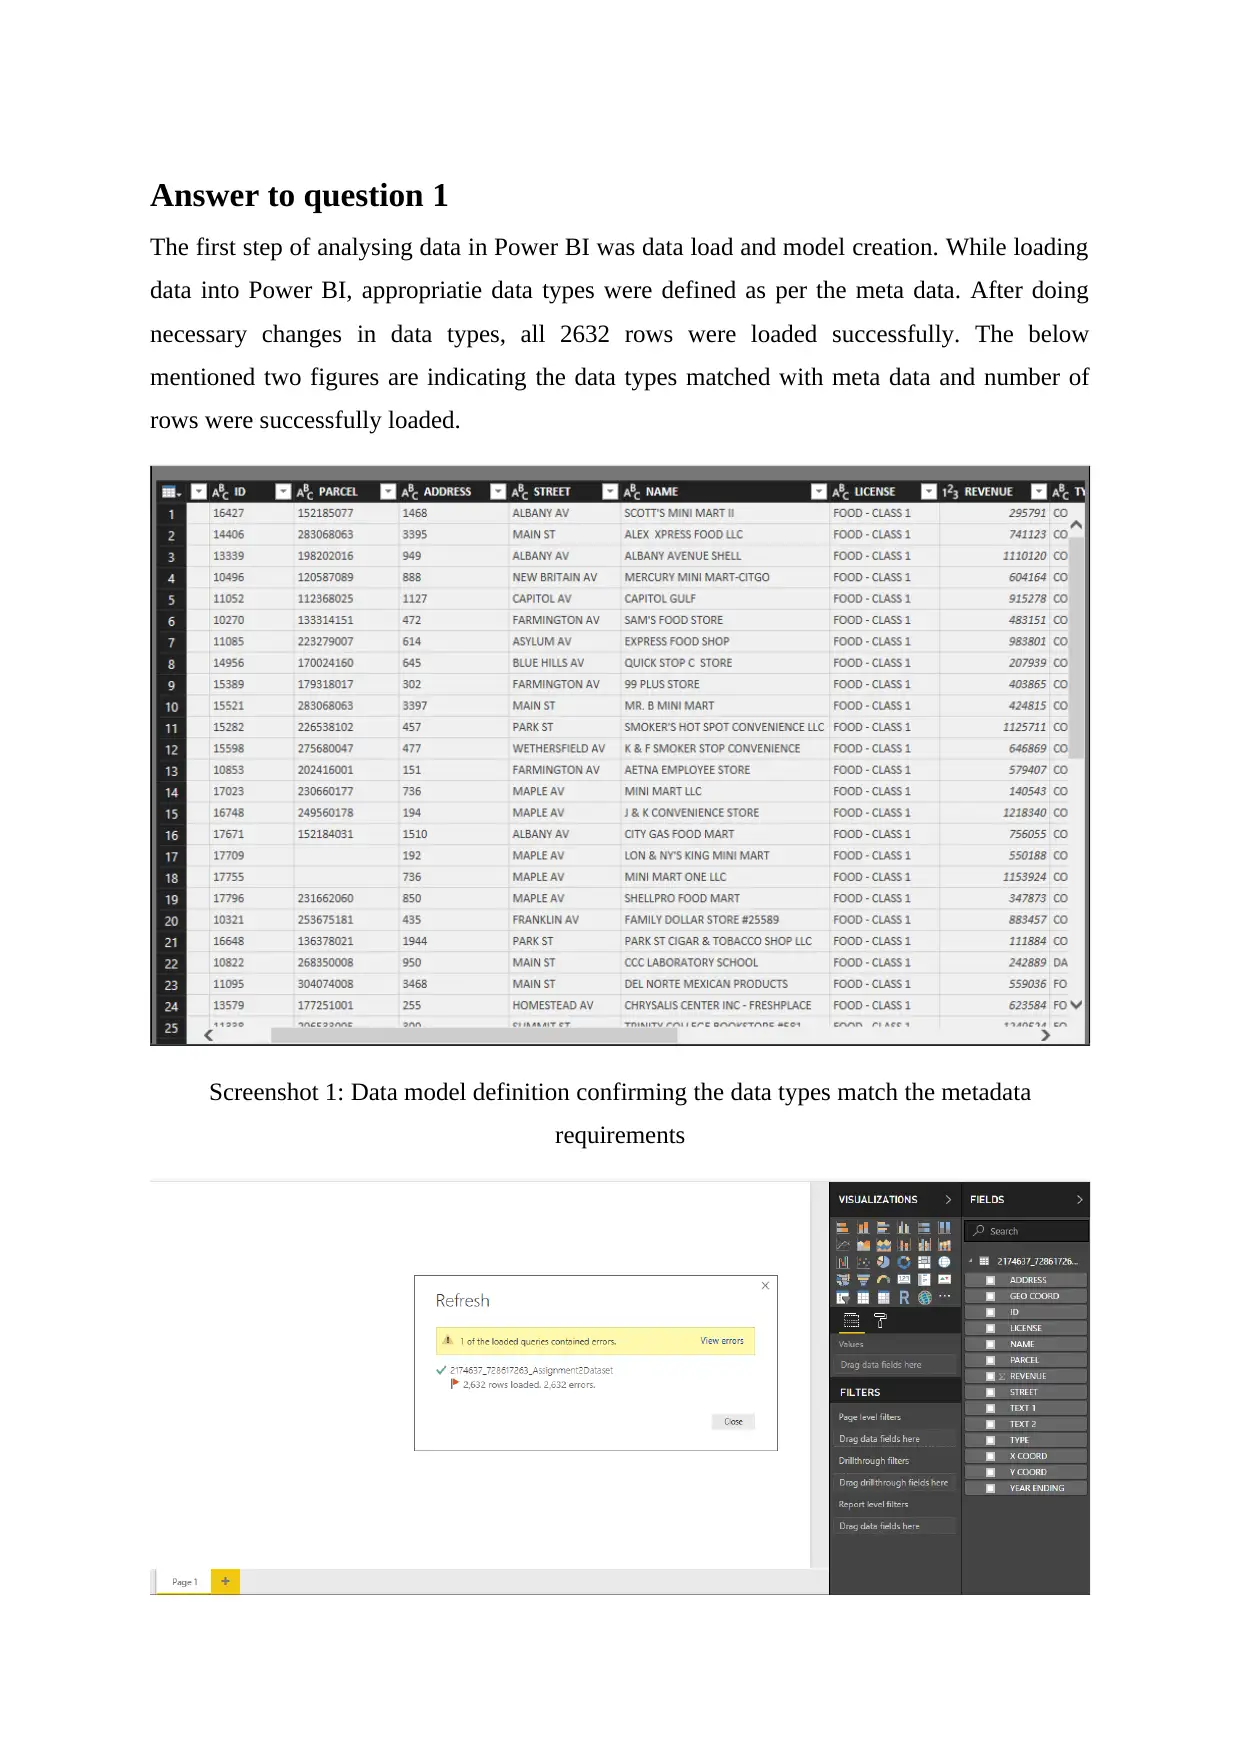
Answer to question 1
The first step of analysing data in Power BI was data load and model creation. While loading
data into Power BI, appropriatie data types were defined as per the meta data. After doing
necessary changes in data types, all 2632 rows were loaded successfully. The below
mentioned two figures are indicating the data types matched with meta data and number of
rows were successfully loaded.
Screenshot 1: Data model definition confirming the data types match the metadata
requirements
You're viewing a preview
Unlock full access by subscribing today!


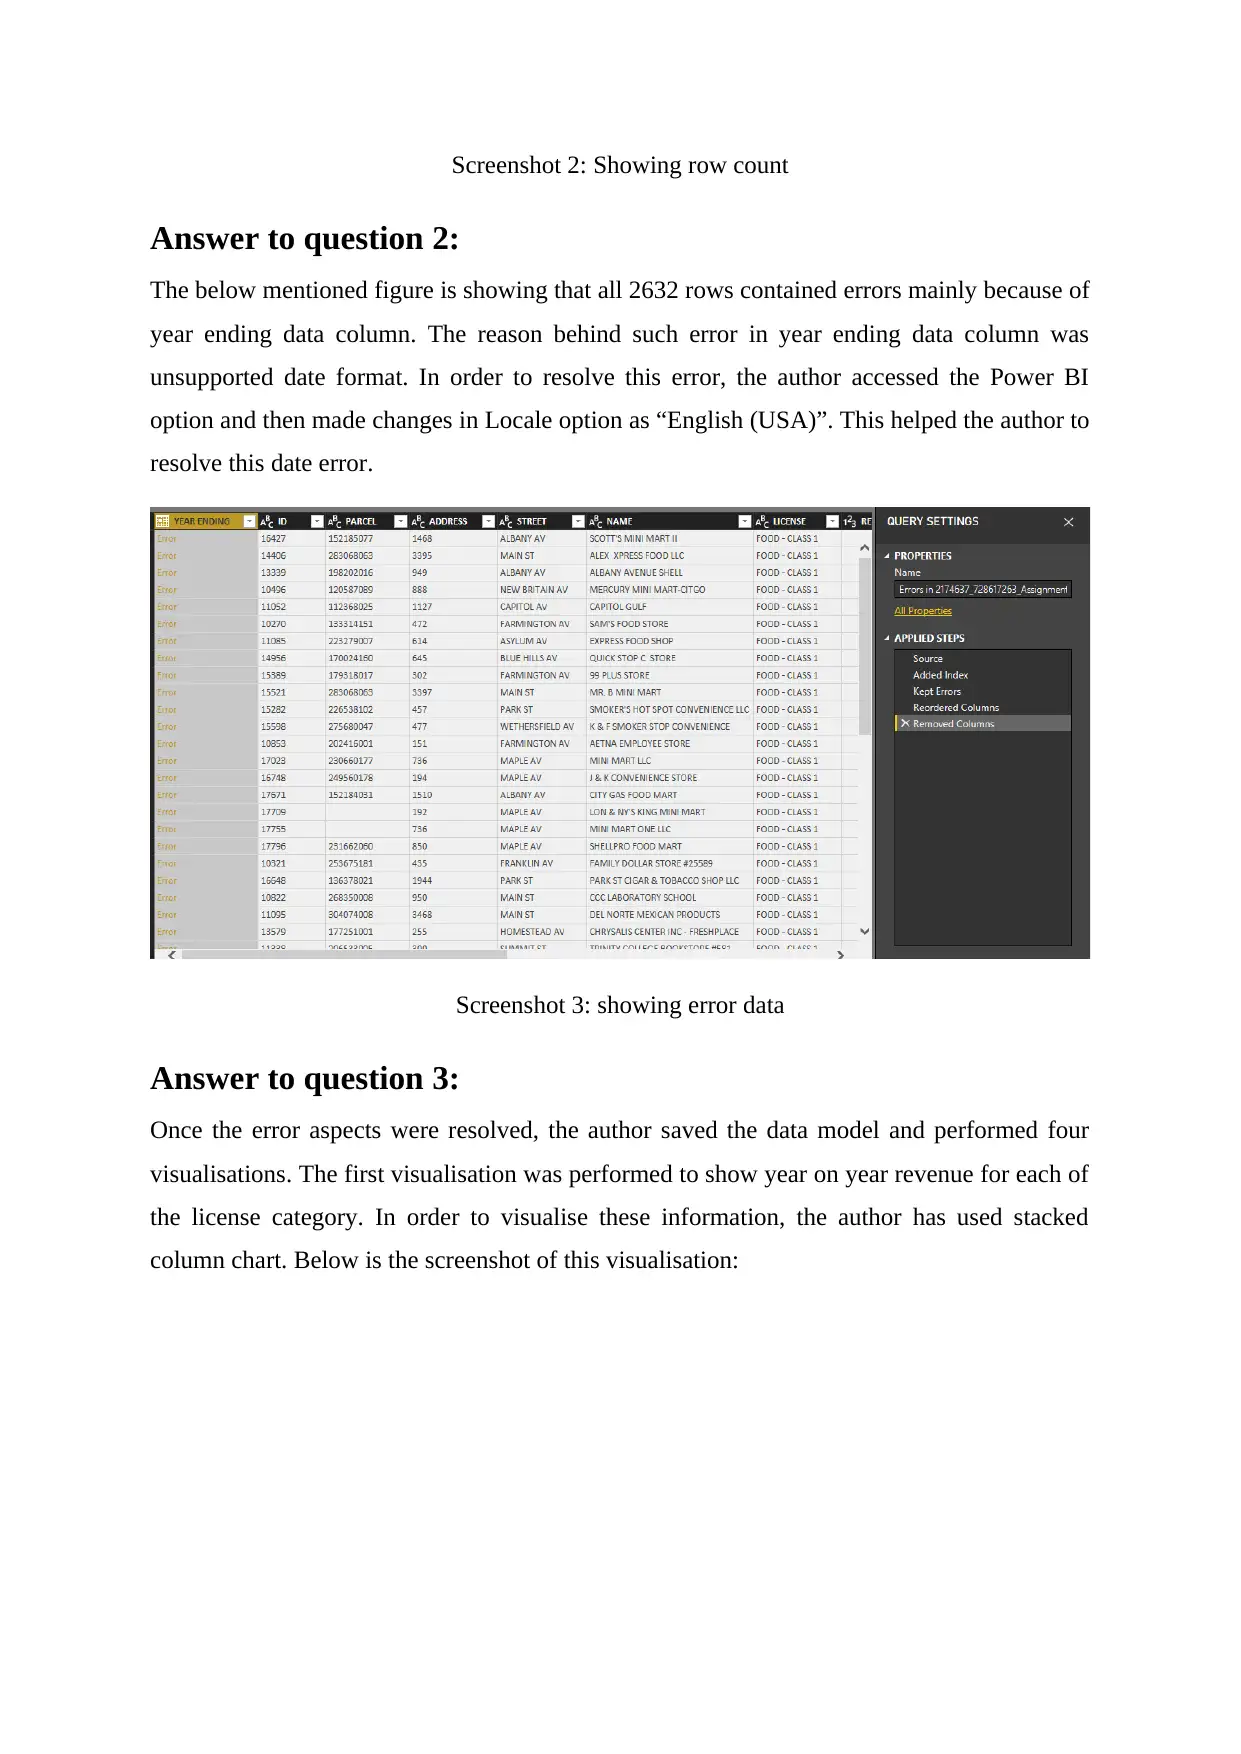
Screenshot 2: Showing row count
Answer to question 2:
The below mentioned figure is showing that all 2632 rows contained errors mainly because of
year ending data column. The reason behind such error in year ending data column was
unsupported date format. In order to resolve this error, the author accessed the Power BI
option and then made changes in Locale option as “English (USA)”. This helped the author to
resolve this date error.
Screenshot 3: showing error data
Answer to question 3:
Once the error aspects were resolved, the author saved the data model and performed four
visualisations. The first visualisation was performed to show year on year revenue for each of
the license category. In order to visualise these information, the author has used stacked
column chart. Below is the screenshot of this visualisation:
Paraphrase This Document
Need a fresh take? Get an instant paraphrase of this document with our AI Paraphraser
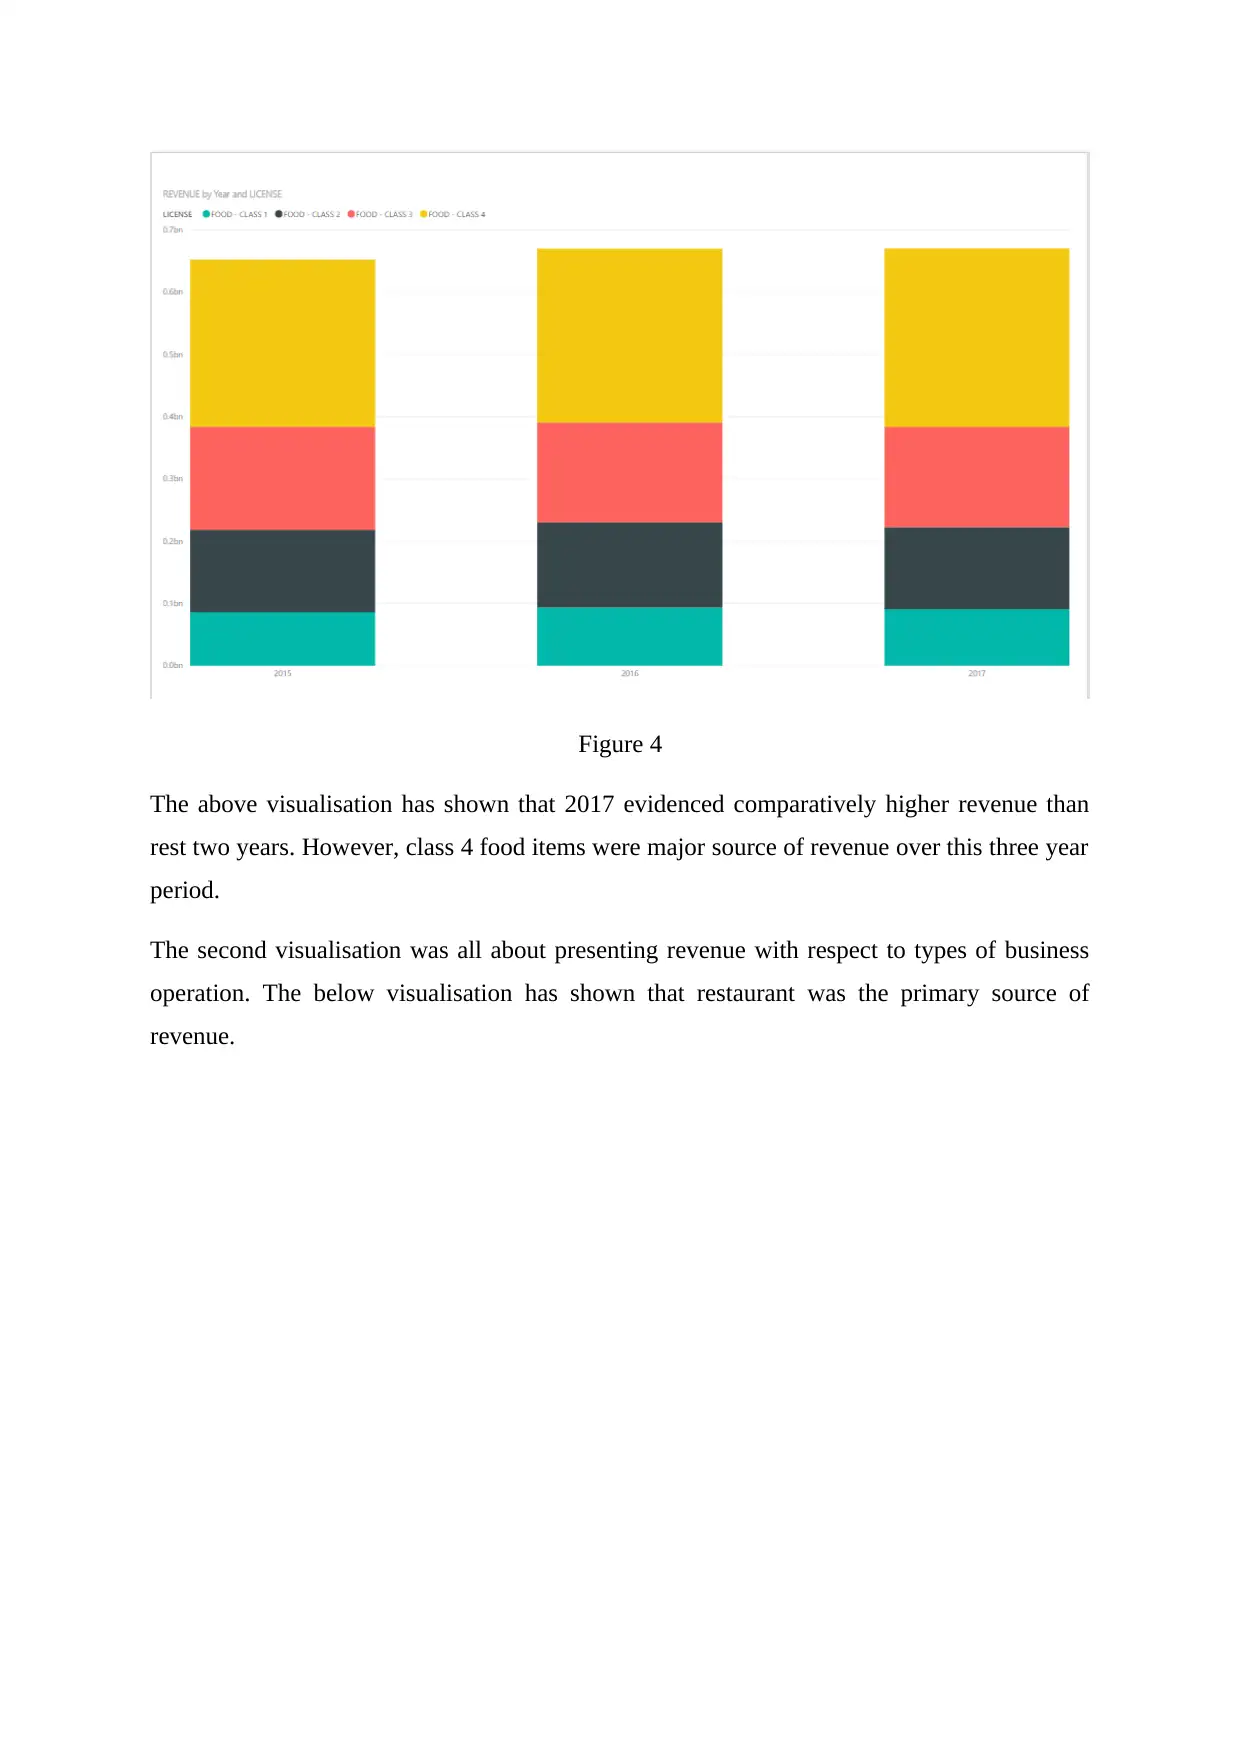
Figure 4
The above visualisation has shown that 2017 evidenced comparatively higher revenue than
rest two years. However, class 4 food items were major source of revenue over this three year
period.
The second visualisation was all about presenting revenue with respect to types of business
operation. The below visualisation has shown that restaurant was the primary source of
revenue.
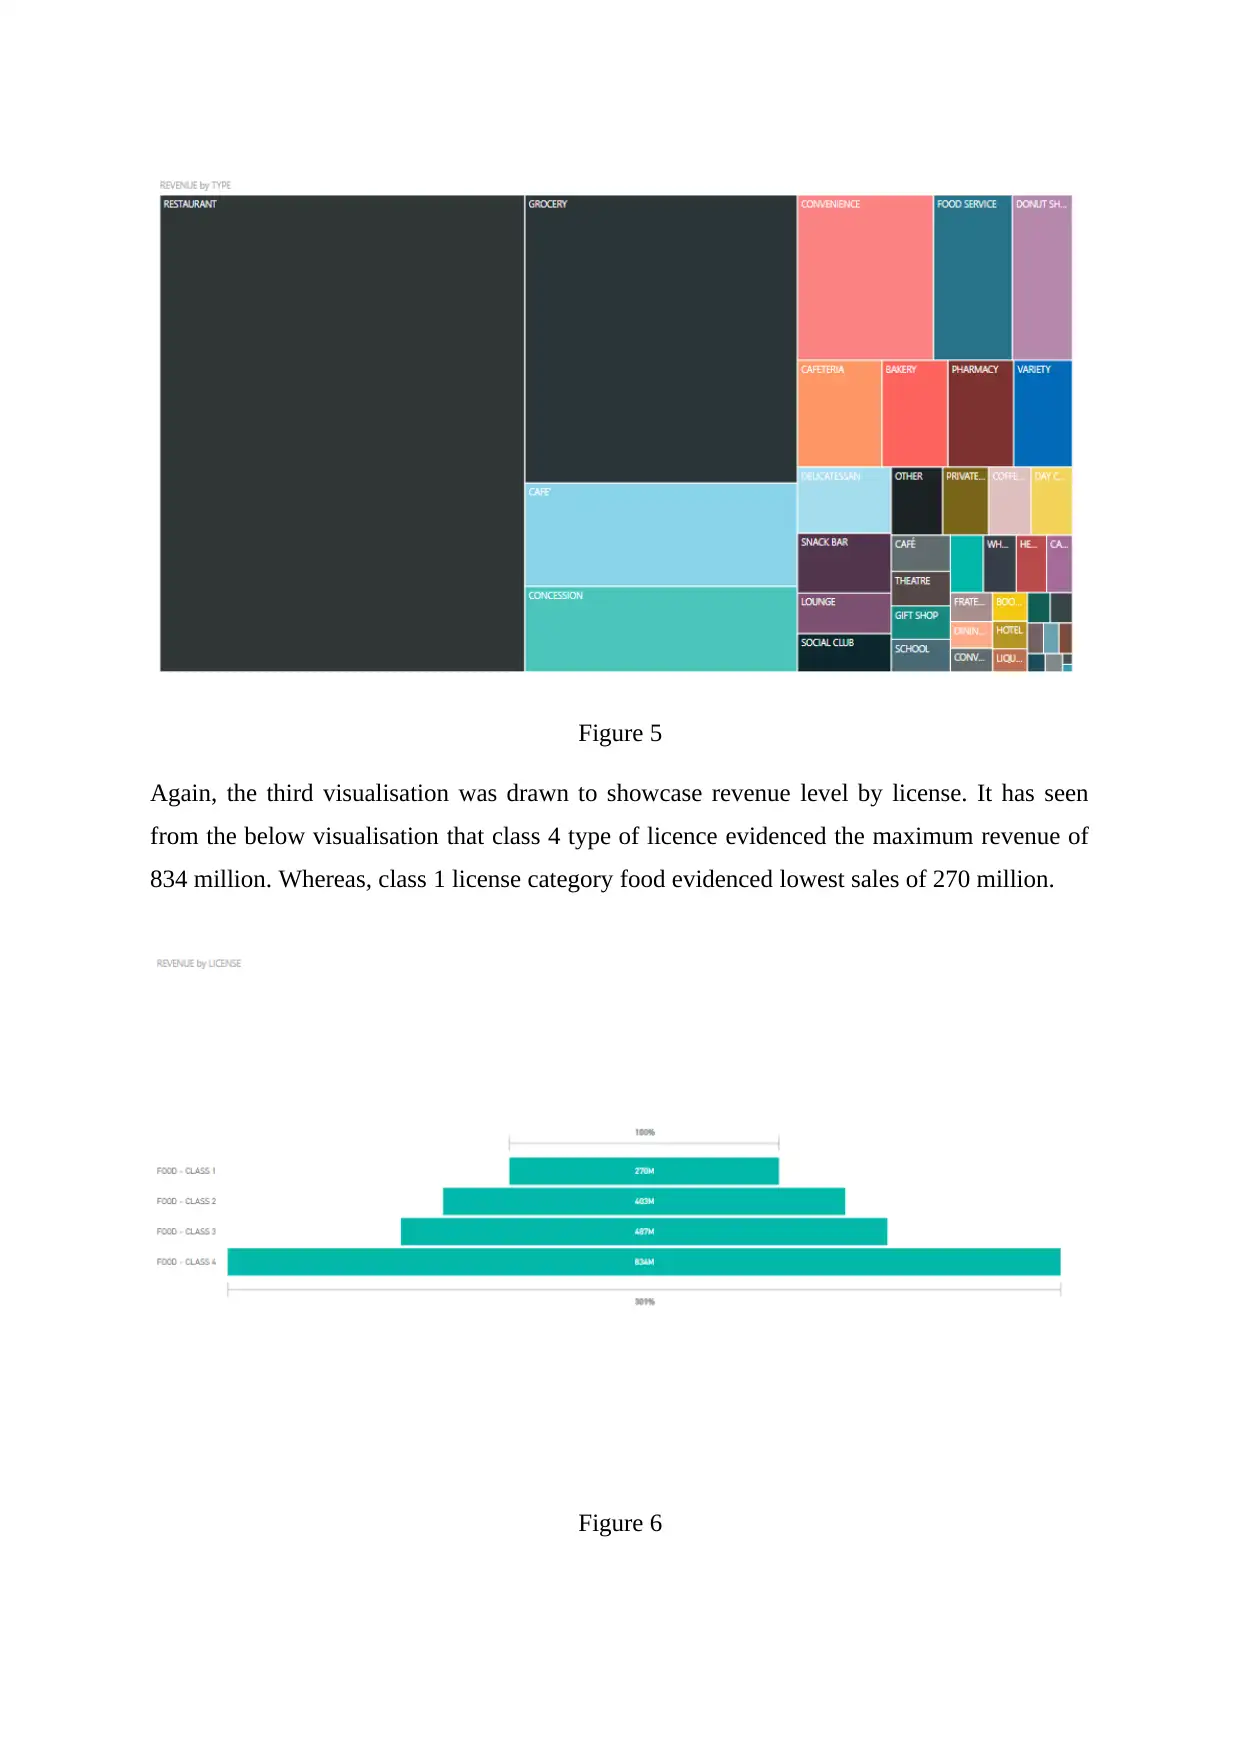
Figure 5
Again, the third visualisation was drawn to showcase revenue level by license. It has seen
from the below visualisation that class 4 type of licence evidenced the maximum revenue of
834 million. Whereas, class 1 license category food evidenced lowest sales of 270 million.
Figure 6
Again, the third visualisation was drawn to showcase revenue level by license. It has seen
from the below visualisation that class 4 type of licence evidenced the maximum revenue of
834 million. Whereas, class 1 license category food evidenced lowest sales of 270 million.
Figure 6
You're viewing a preview
Unlock full access by subscribing today!
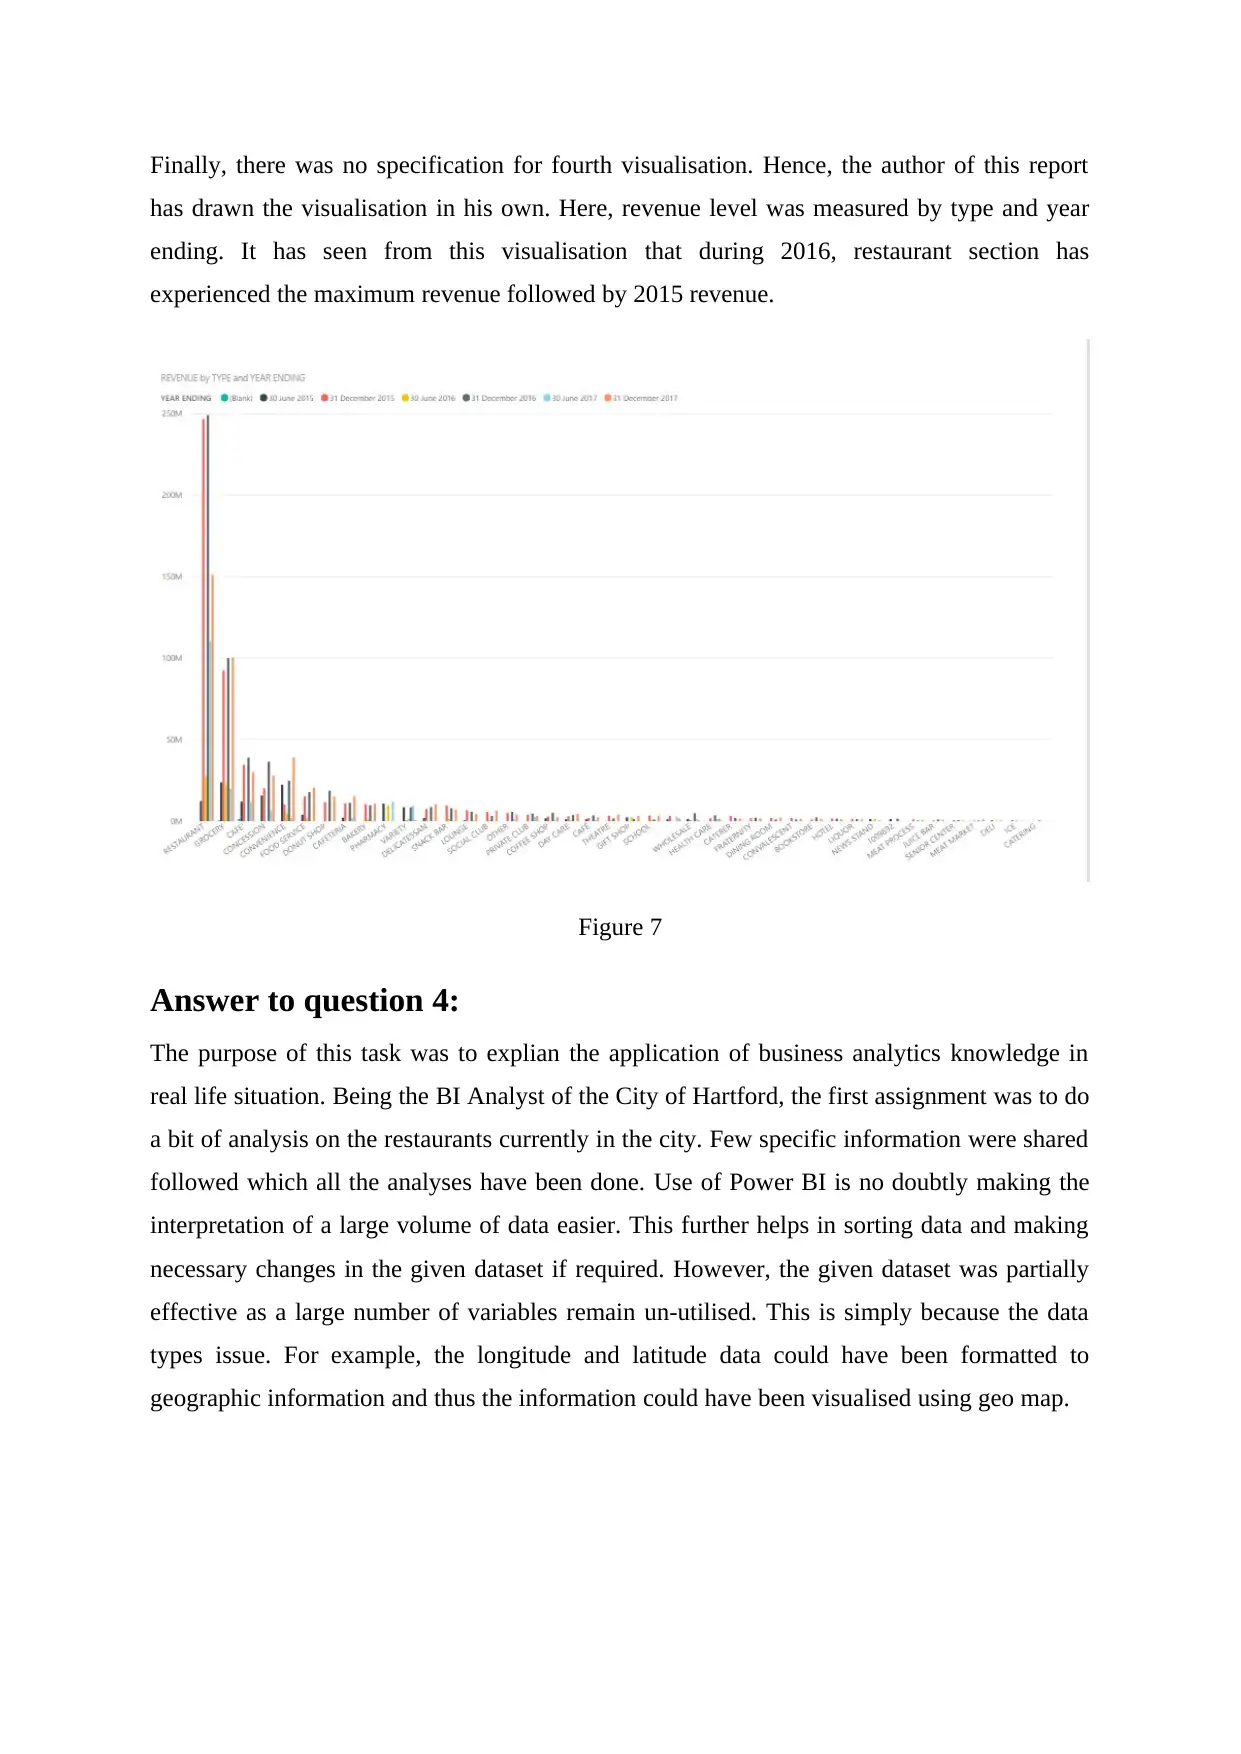
Finally, there was no specification for fourth visualisation. Hence, the author of this report
has drawn the visualisation in his own. Here, revenue level was measured by type and year
ending. It has seen from this visualisation that during 2016, restaurant section has
experienced the maximum revenue followed by 2015 revenue.
Figure 7
Answer to question 4:
The purpose of this task was to explian the application of business analytics knowledge in
real life situation. Being the BI Analyst of the City of Hartford, the first assignment was to do
a bit of analysis on the restaurants currently in the city. Few specific information were shared
followed which all the analyses have been done. Use of Power BI is no doubtly making the
interpretation of a large volume of data easier. This further helps in sorting data and making
necessary changes in the given dataset if required. However, the given dataset was partially
effective as a large number of variables remain un-utilised. This is simply because the data
types issue. For example, the longitude and latitude data could have been formatted to
geographic information and thus the information could have been visualised using geo map.
Paraphrase This Document
Need a fresh take? Get an instant paraphrase of this document with our AI Paraphraser

Bibliography
Chaudhuri, S., Dayal, U. and Narasayya, V., 2011. An overview of business intelligence
technology. Communications of the ACM, 54(8), pp.88-98.
Diamond, M. and Mattia, A., 2017. Data Visualization: An Exploratory Study into the
Software Tools Used by Businesses. Journal of Instructional Pedagogies, 18.
Hou, Z., Zhang, H., Zhang, H. and Zhang, D., 2016. Visual analytics for software engineering
data. In Perspectives on Data Science for Software Engineering (pp. 77-80).
1 out of 8
Your All-in-One AI-Powered Toolkit for Academic Success.
+13062052269
info@desklib.com
Available 24*7 on WhatsApp / Email
![[object Object]](/_next/static/media/star-bottom.7253800d.svg)
Unlock your academic potential
© 2024 | Zucol Services PVT LTD | All rights reserved.