Data Analysis Report: Analysis of Transport Spending Over Ten Months
VerifiedAdded on 2022/12/14
|9
|1448
|260
Report
AI Summary
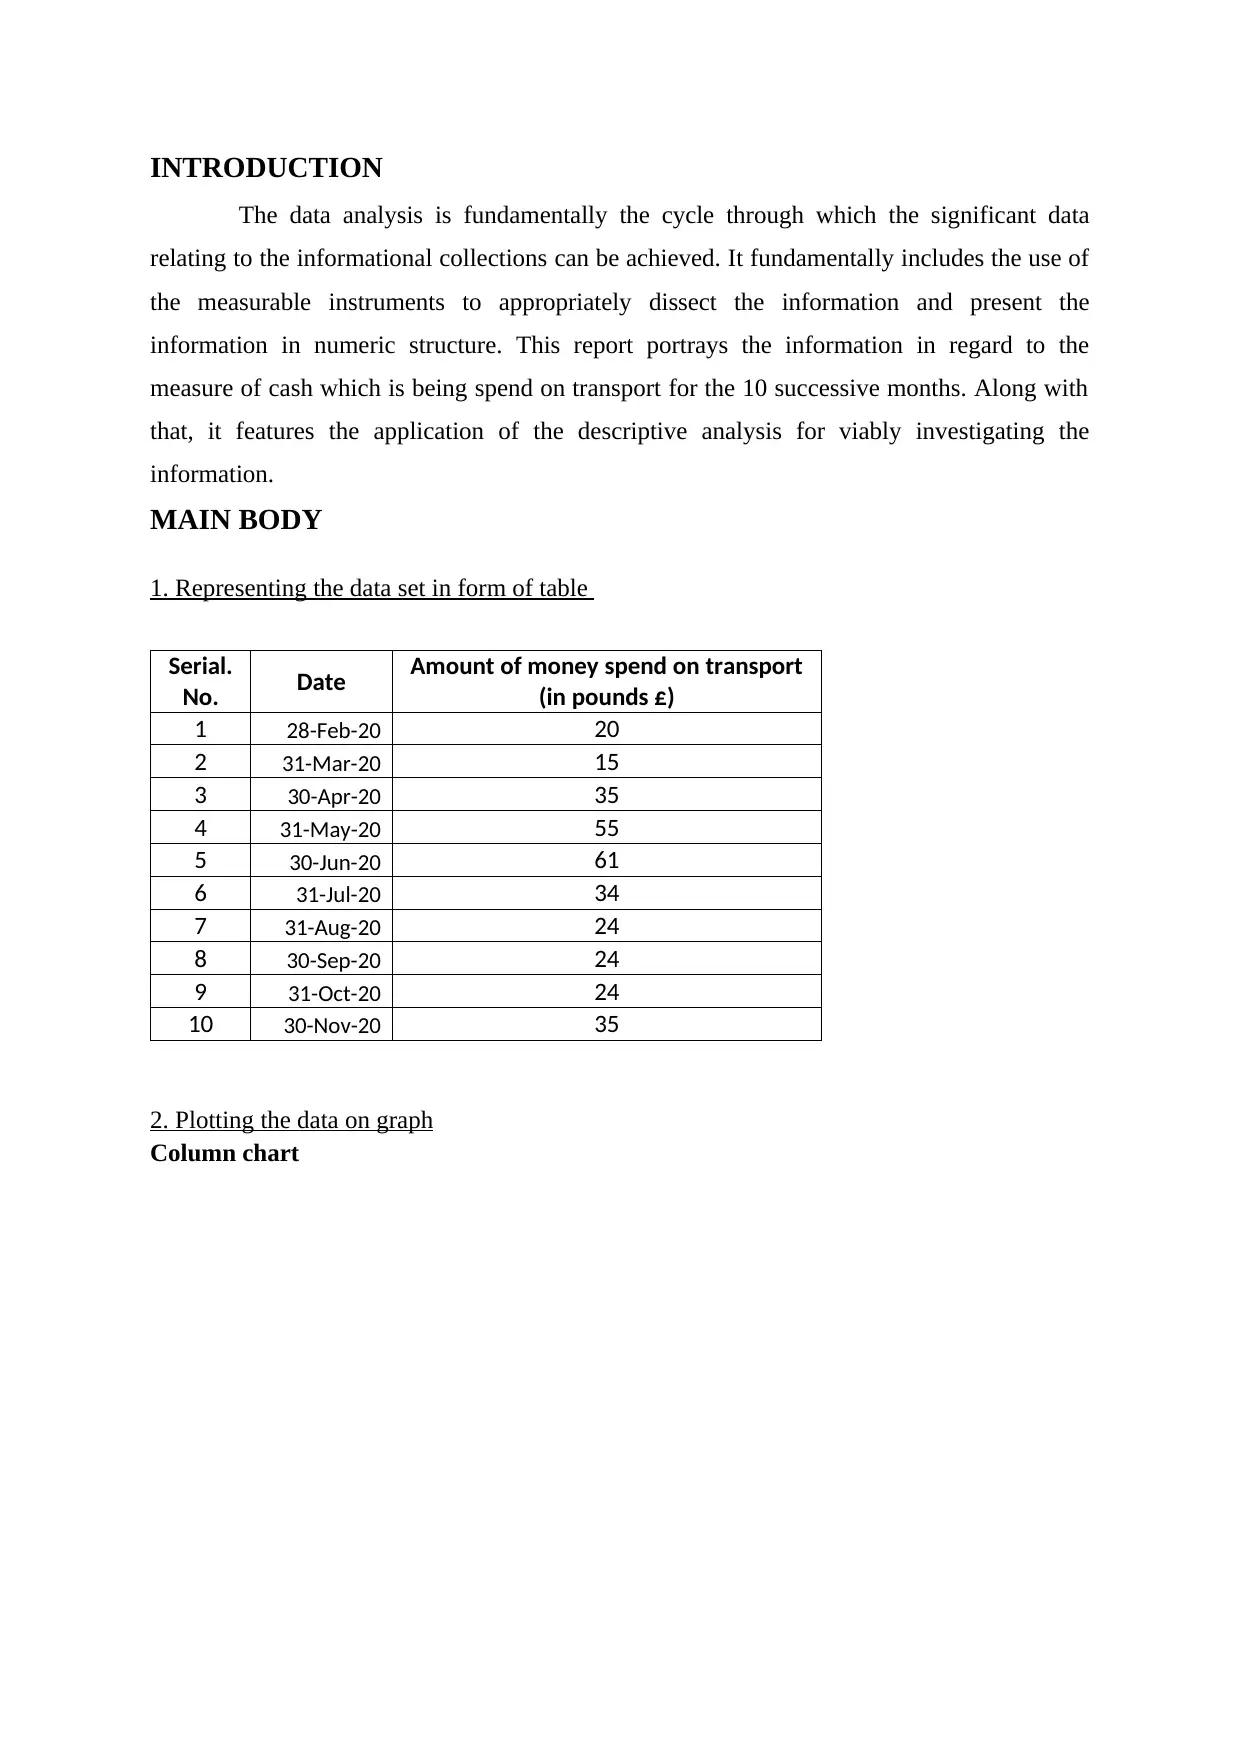
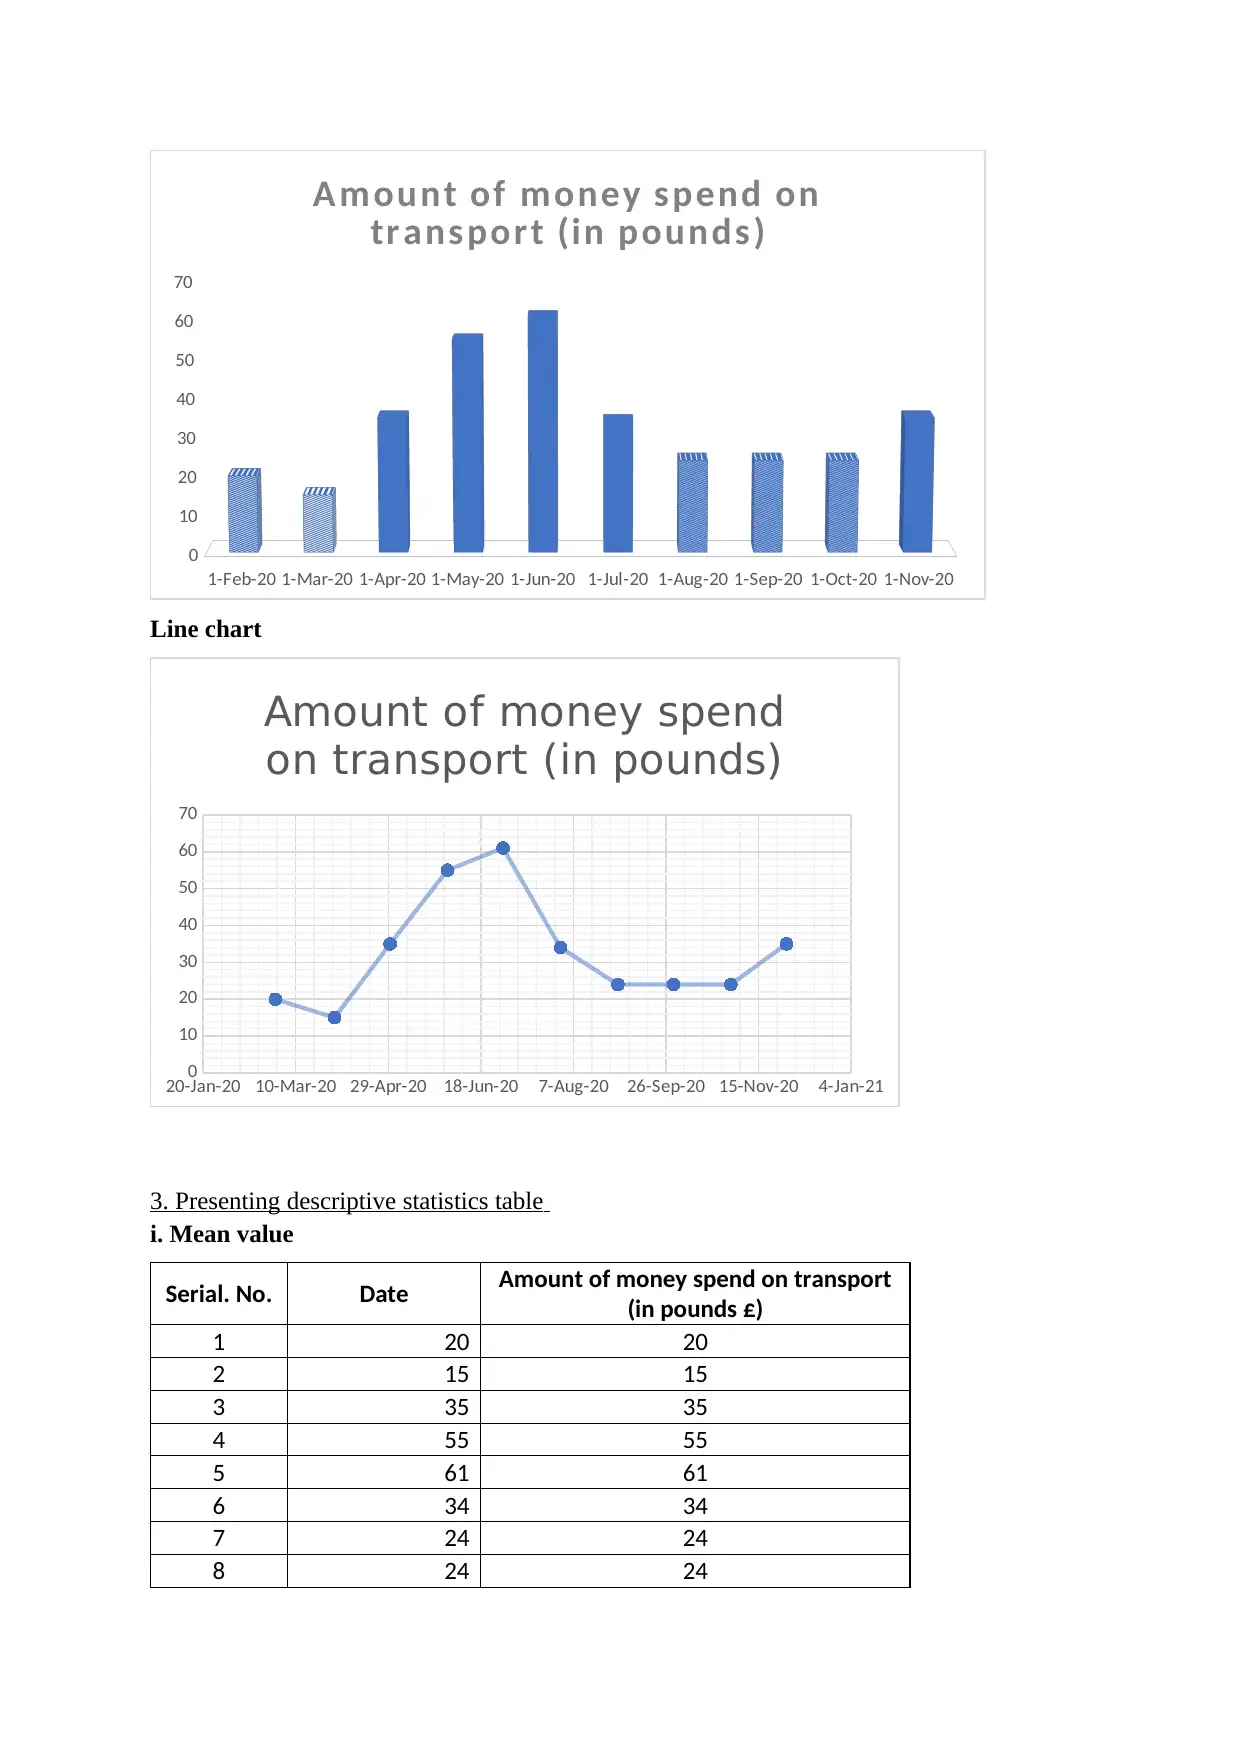
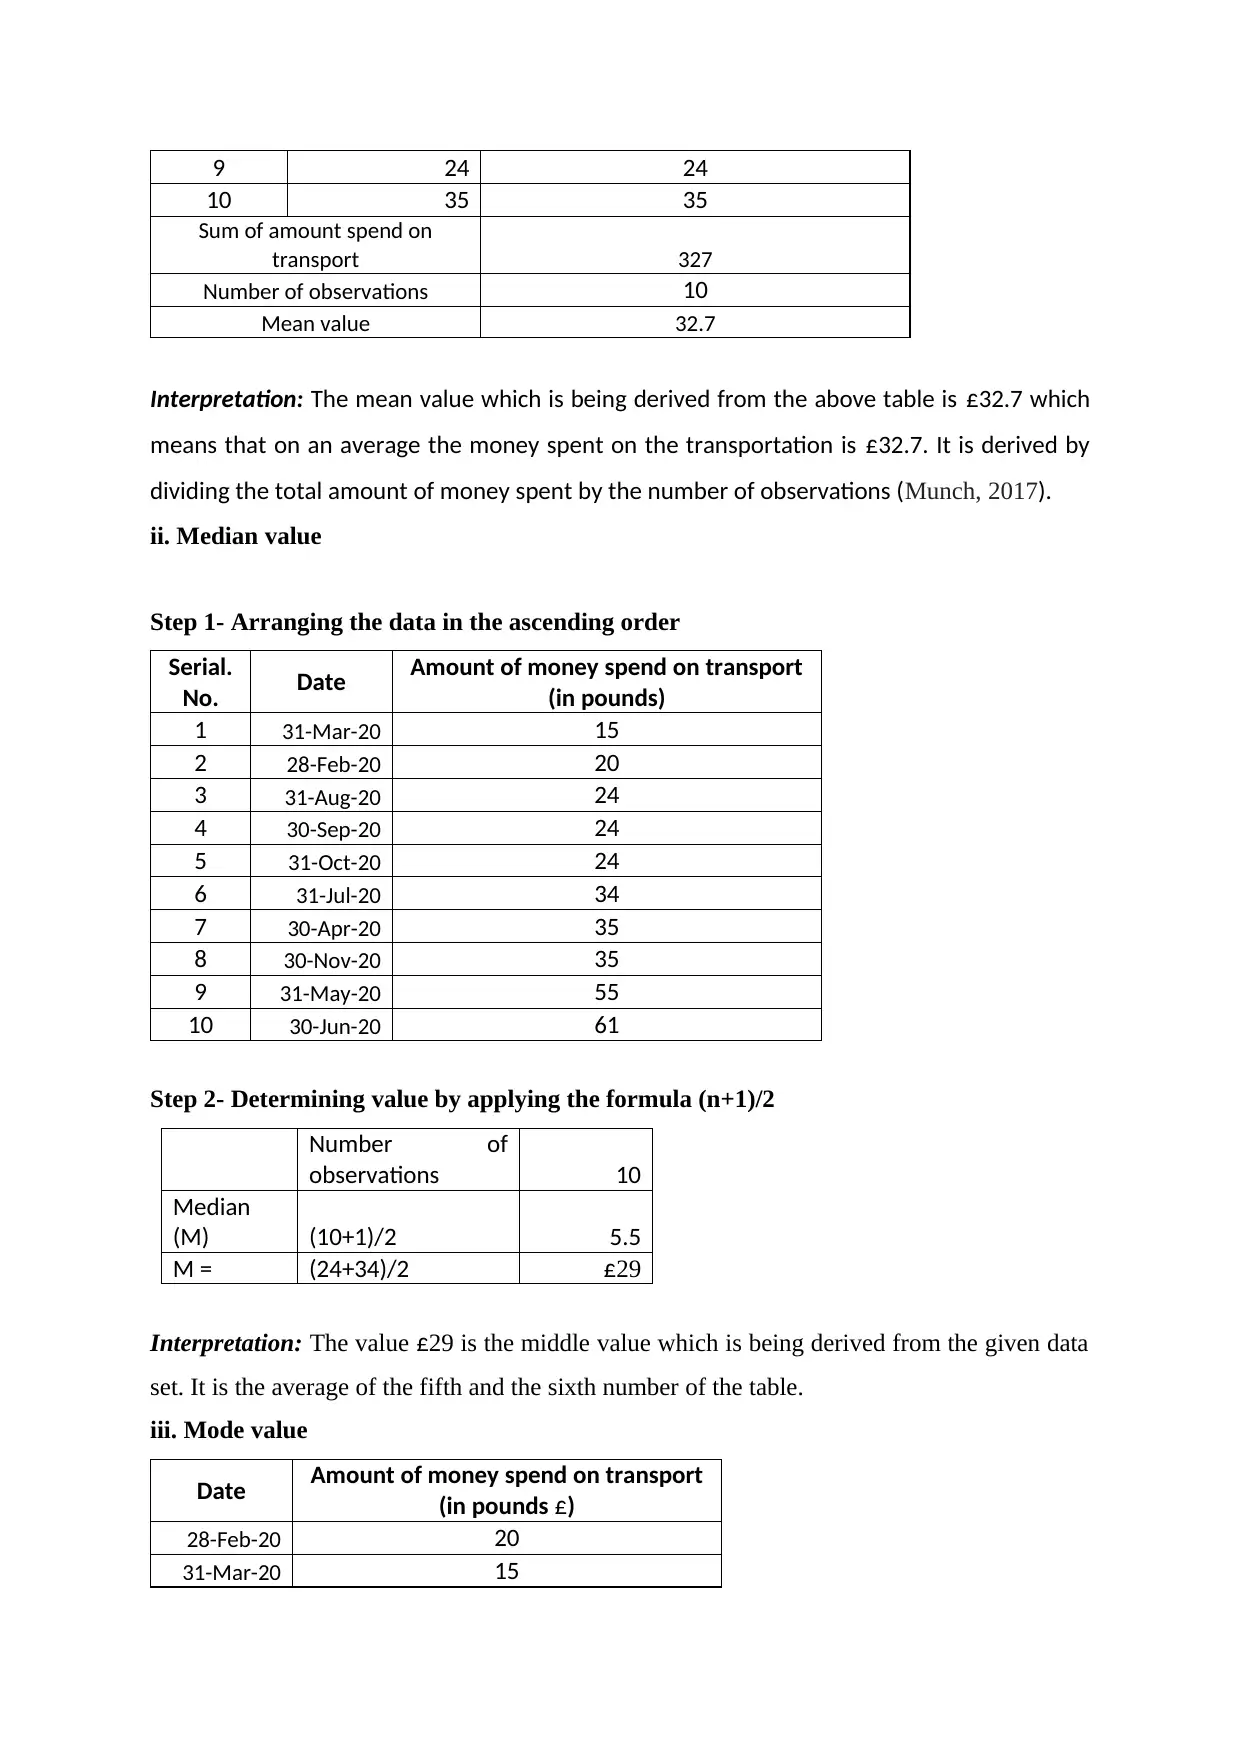
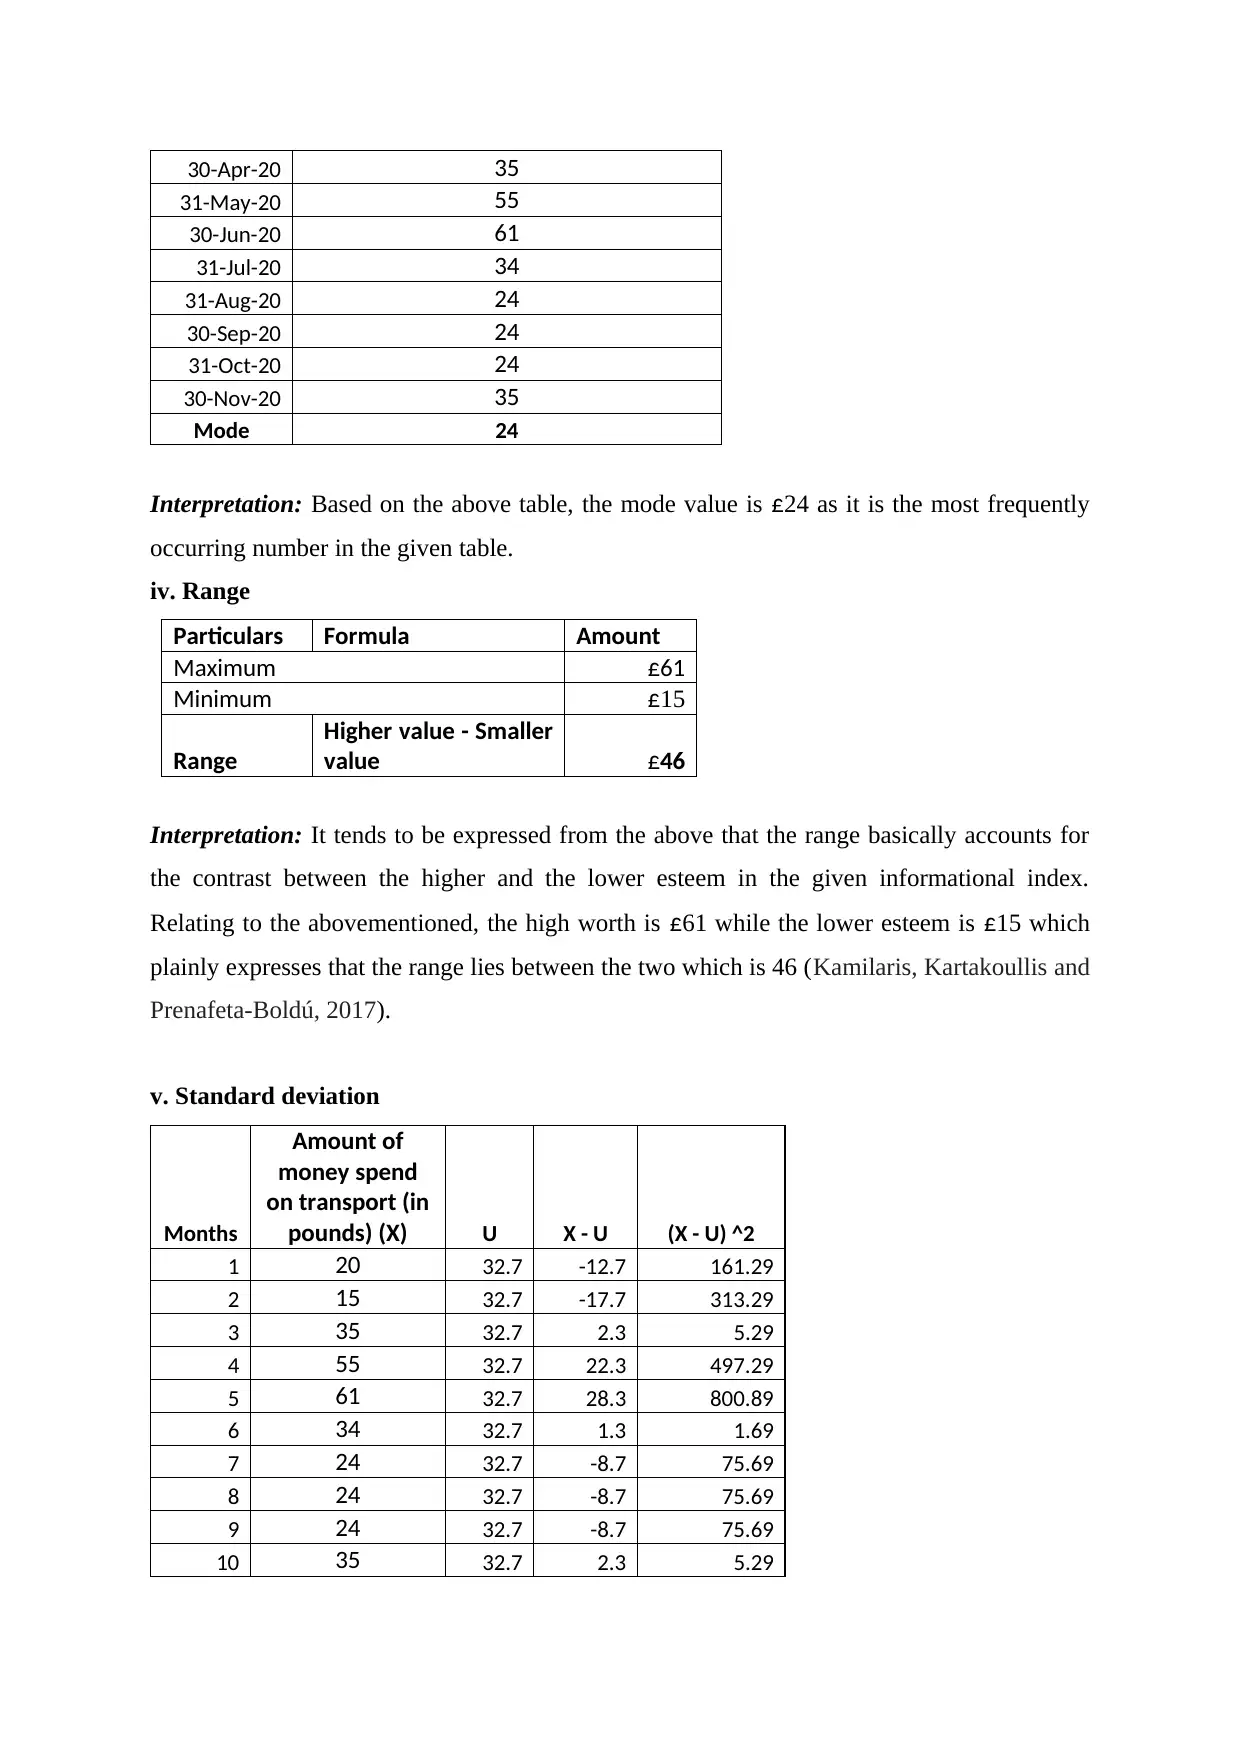
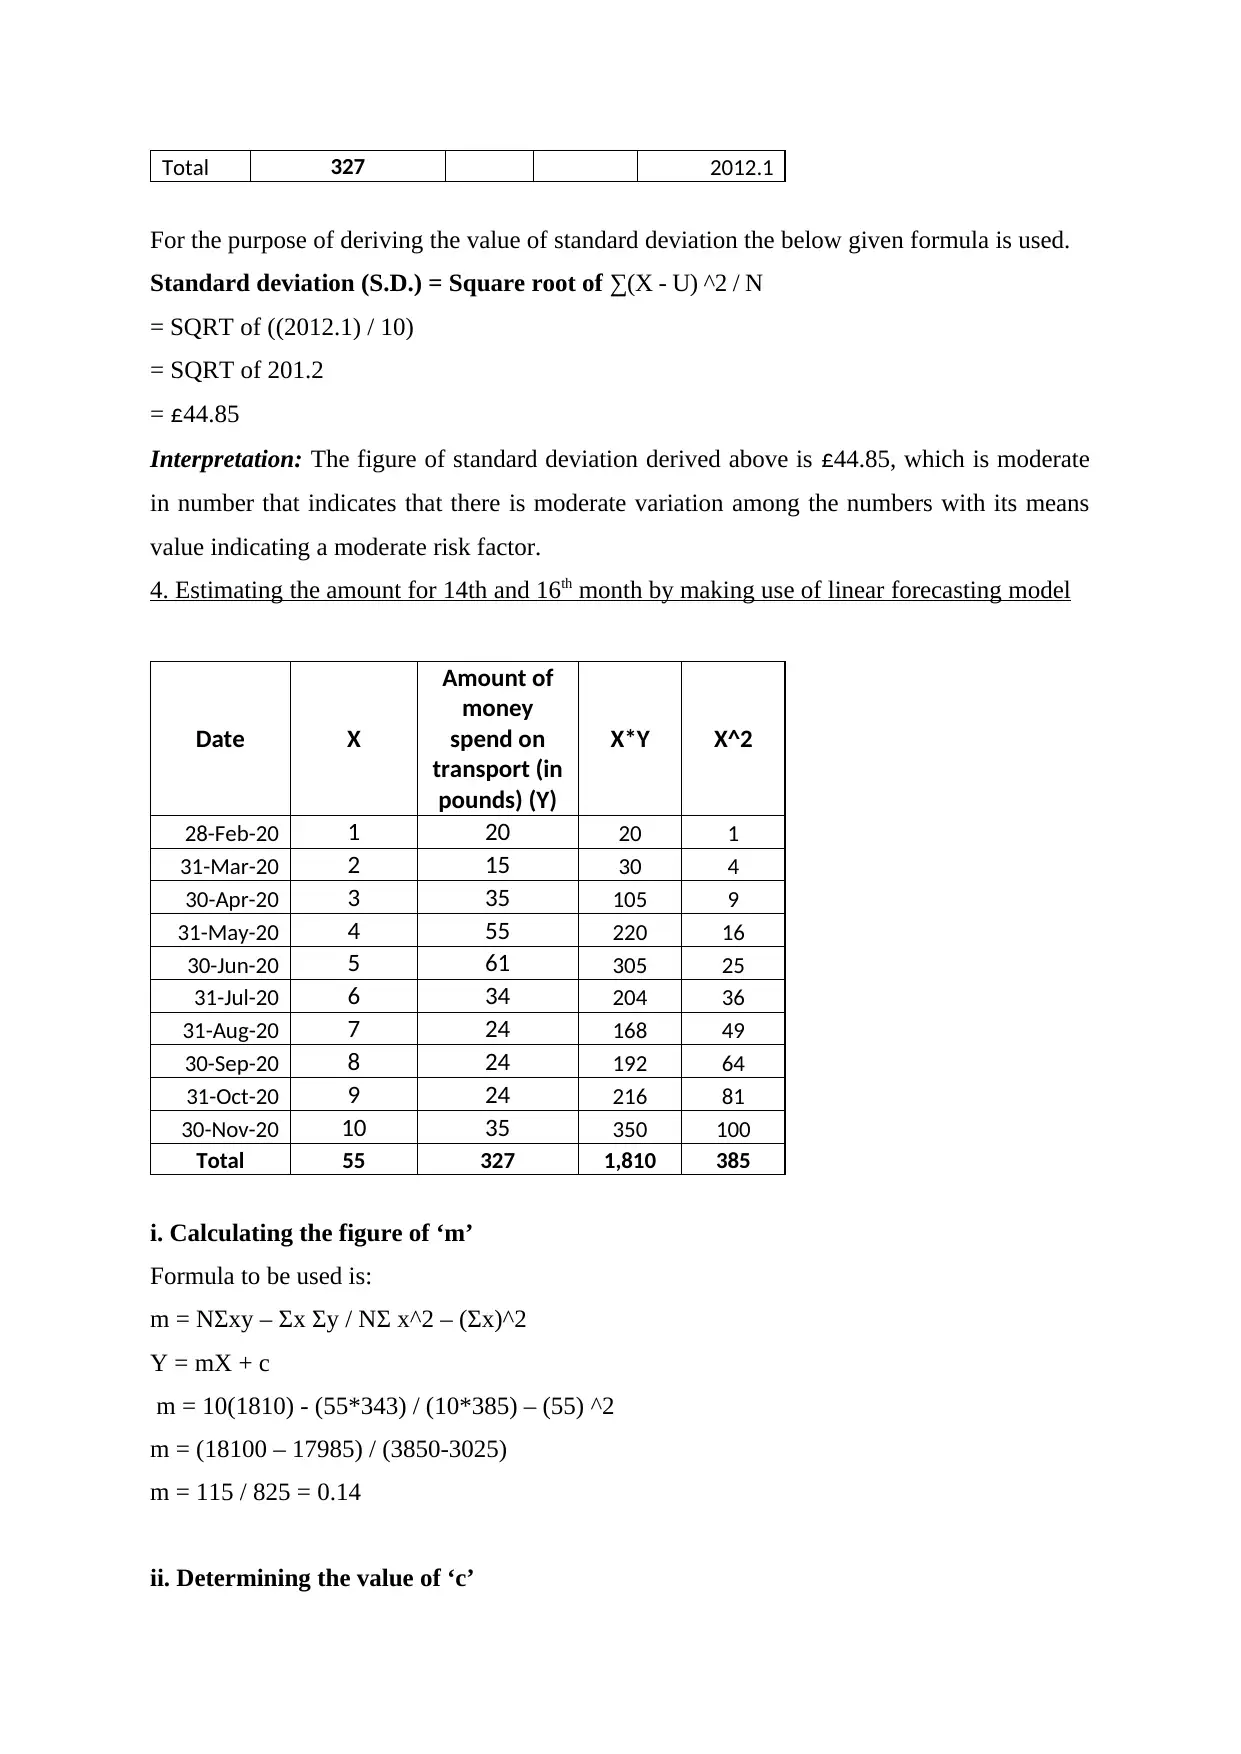
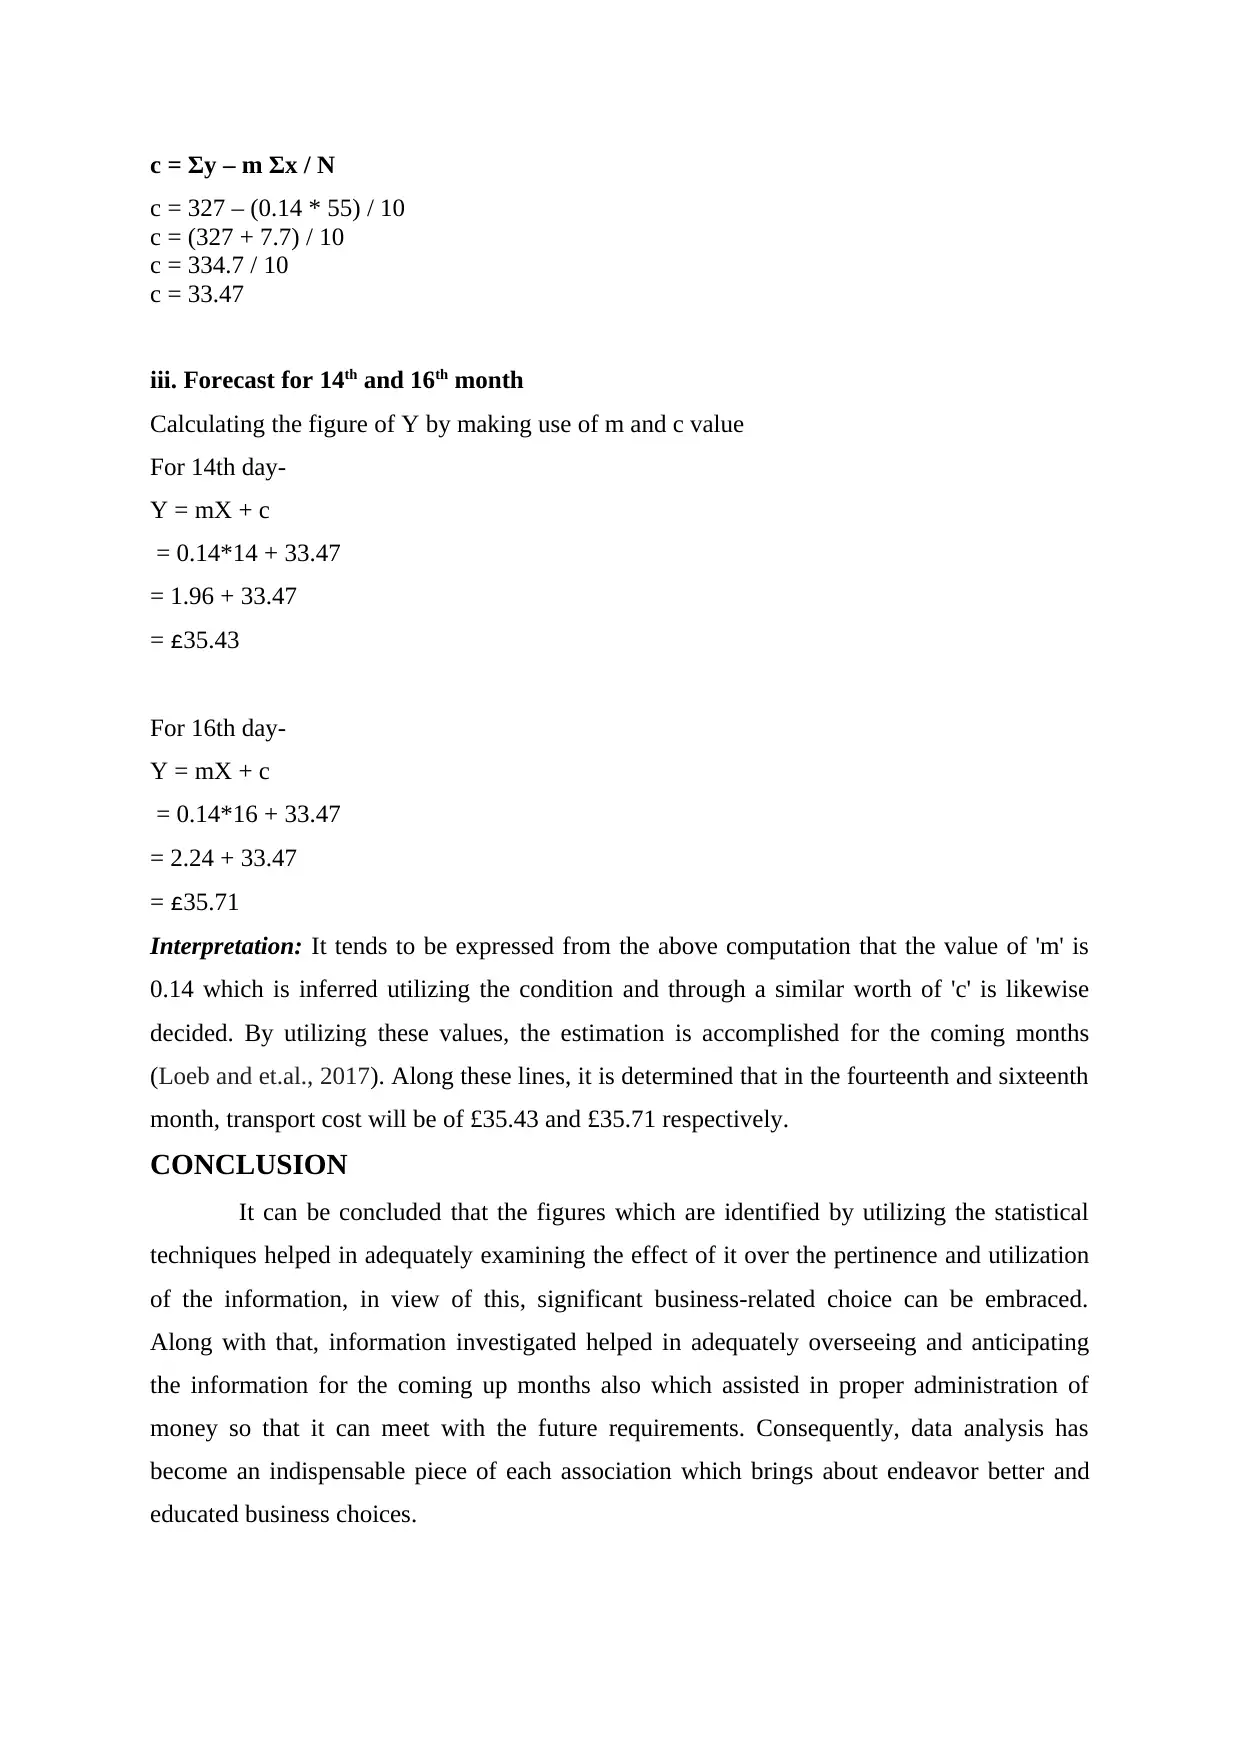
This report presents a comprehensive data analysis of transport expenditure over a period of ten months. The analysis begins with representing the data in tabular and graphical formats, including both column and line charts, providing a visual overview of the spending patterns. Descriptive statistics such as mean, median, mode, range, and standard deviation are calculated to summarize and interpret the central tendencies and variability within the dataset. Furthermore, the report employs a linear forecasting model to estimate the transport costs for the 14th and 16th months, demonstrating the application of predictive analysis. The methodology involves calculating the values of 'm' and 'c' to develop the forecasting equation. The conclusion emphasizes the significance of data analysis in making informed decisions and managing financial resources effectively. This report is a valuable resource for students seeking to understand data analysis techniques and their practical applications.
1 out of 9
Related Documents


Your All-in-One AI-Powered Toolkit for Academic Success.
+13062052269
info@desklib.com
Available 24*7 on WhatsApp / Email
![[object Object]](/_next/static/media/star-bottom.7253800d.svg)
Copyright © 2020–2026 A2Z Services. All Rights Reserved. Developed and managed by ZUCOL.