AFE135 SP3 Business Data Analysis: Study Hours and Exam Marks Analysis
VerifiedAdded on 2023/06/03
|11
|1506
|381
Homework Assignment
AI Summary
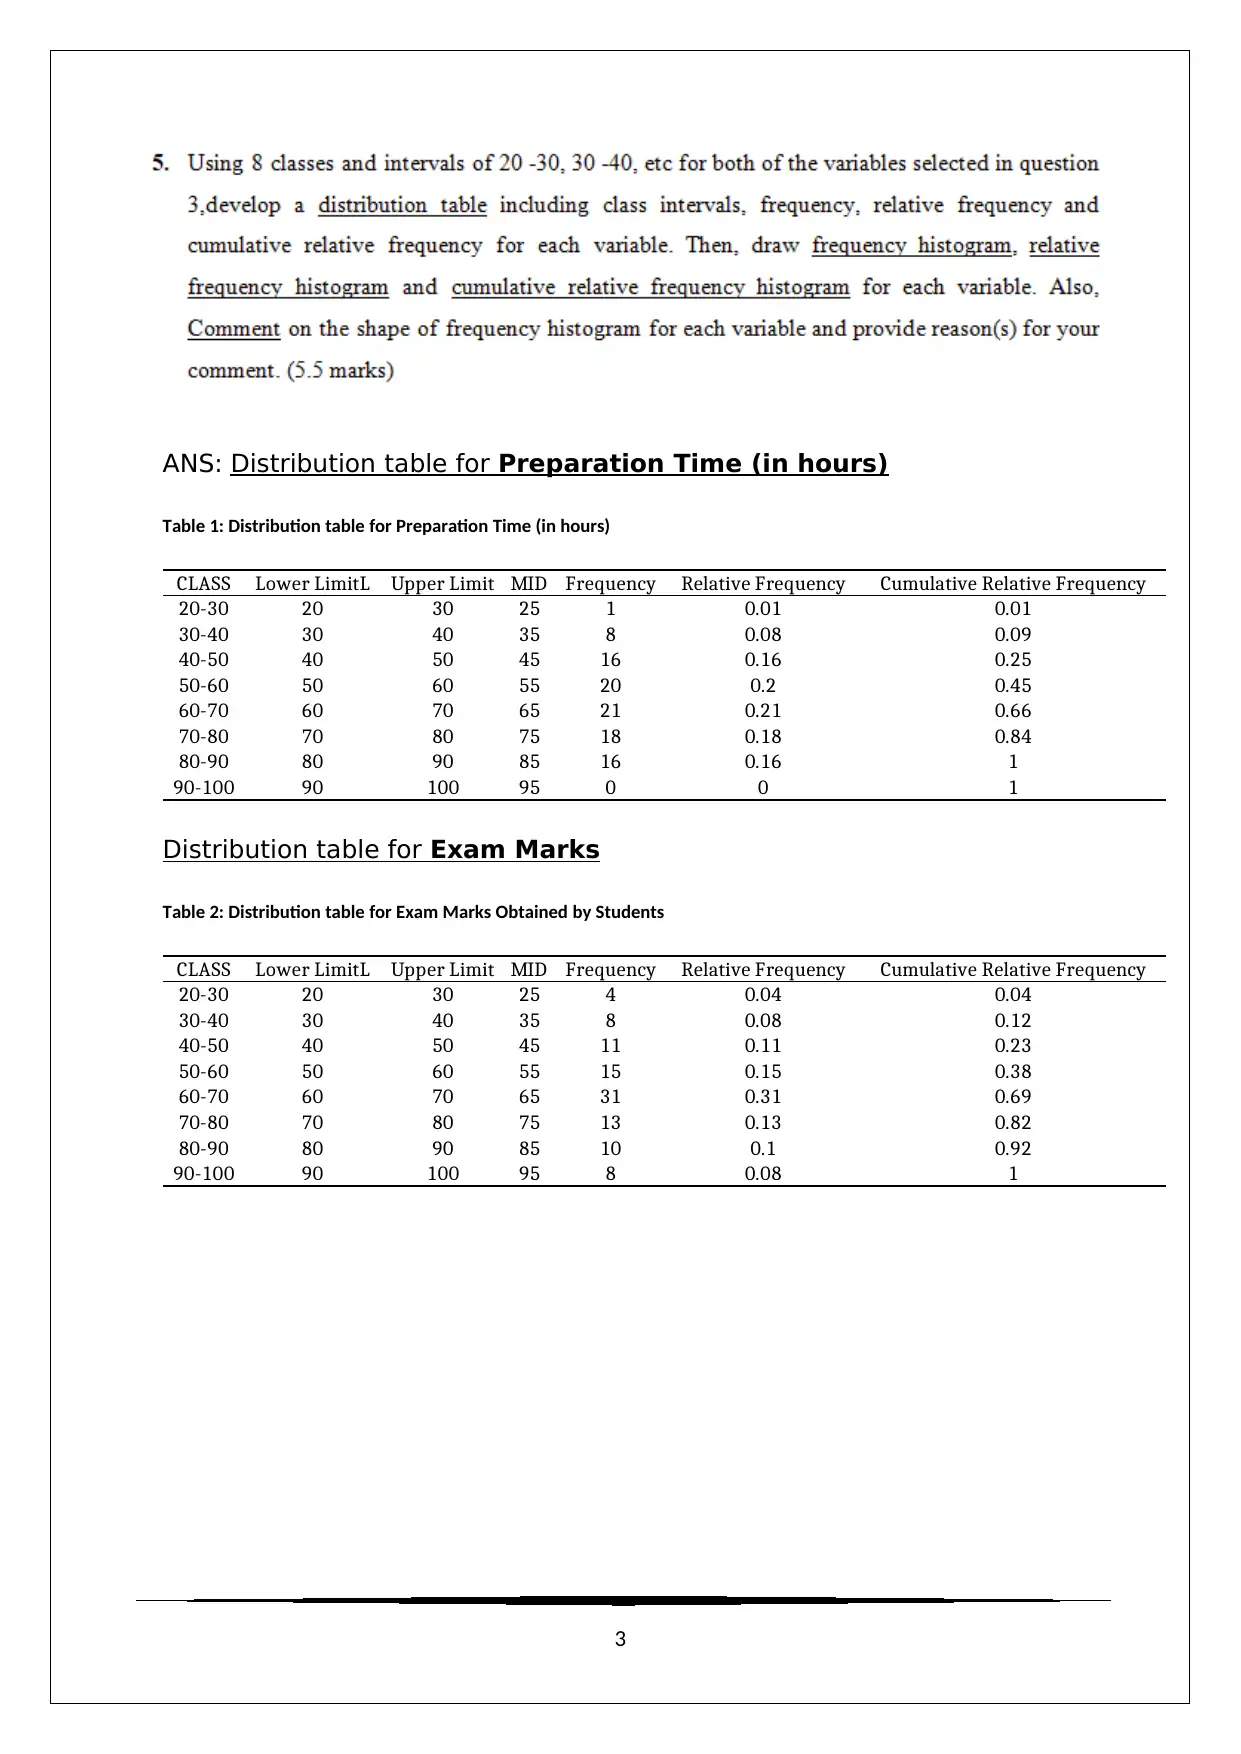
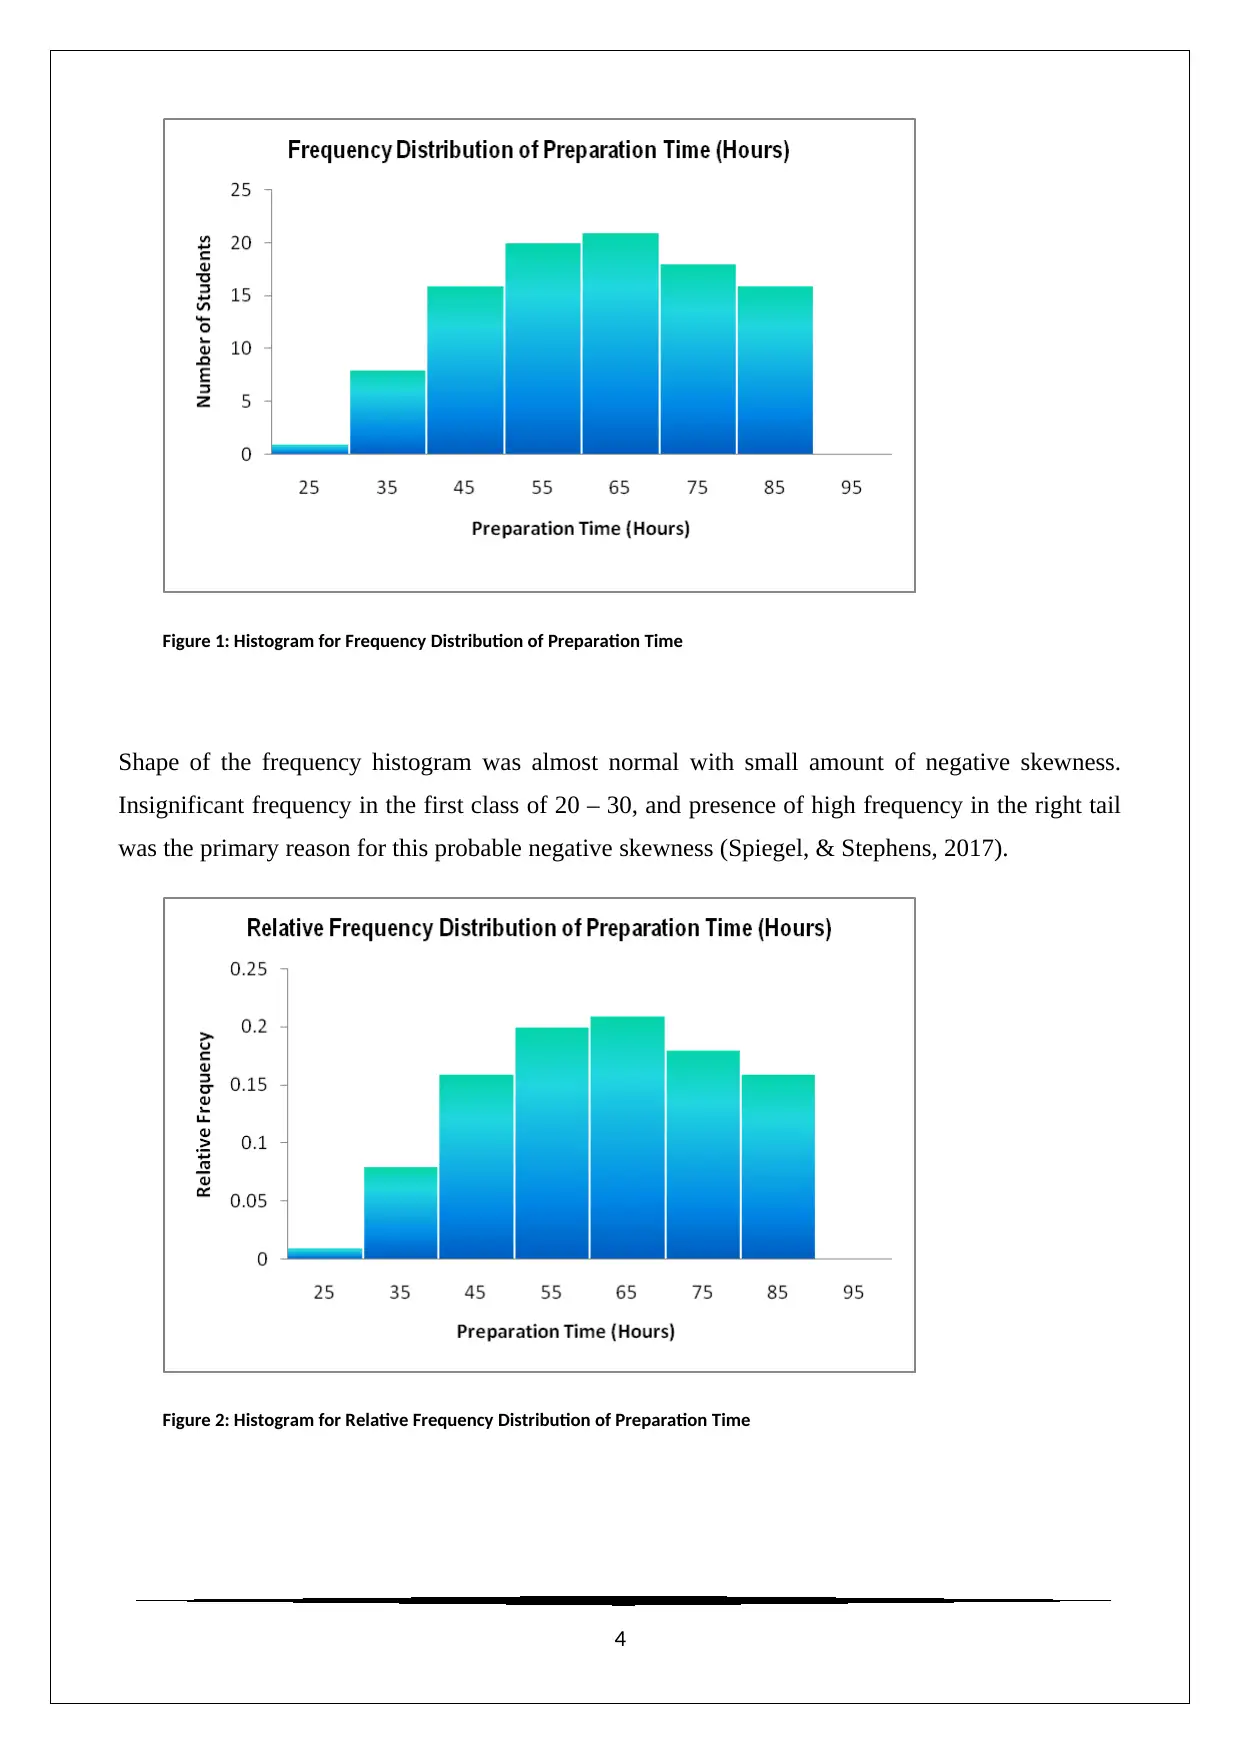
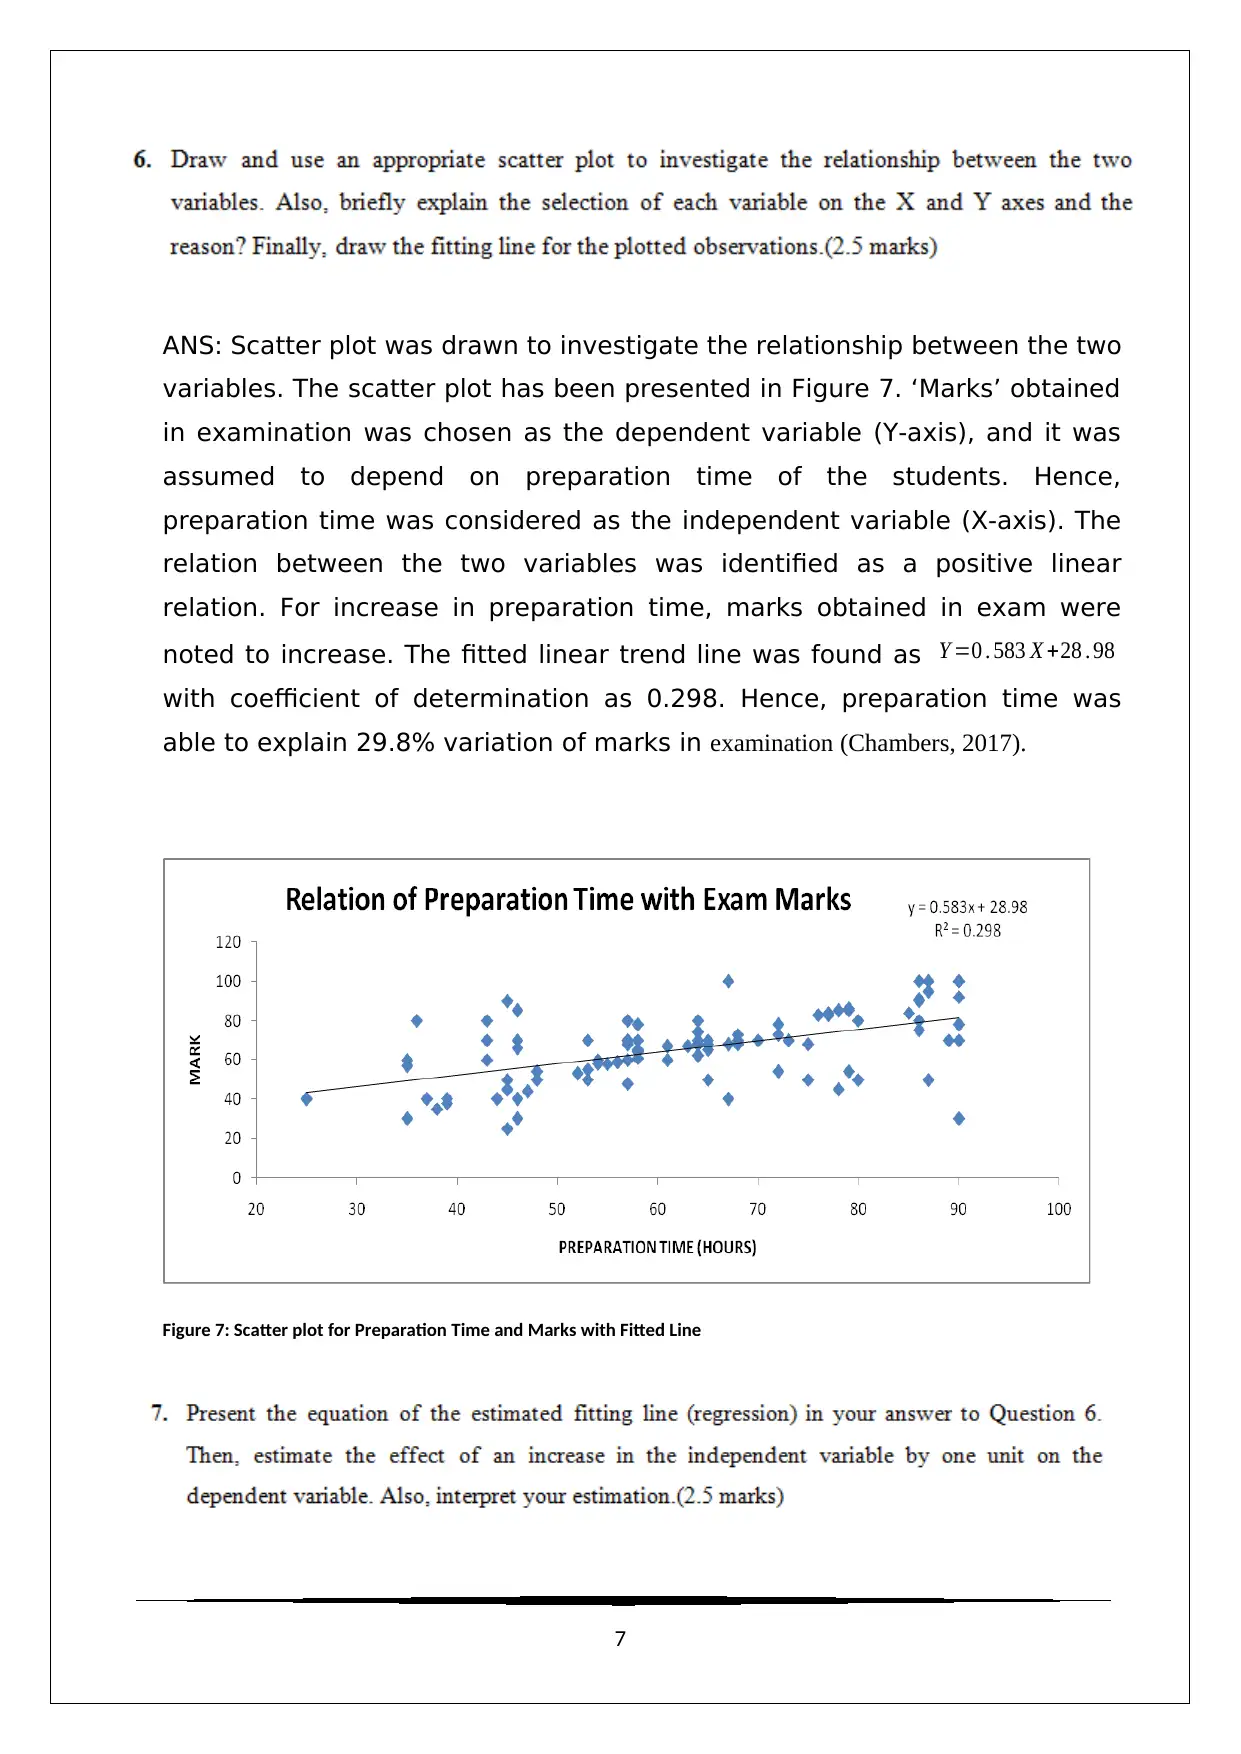
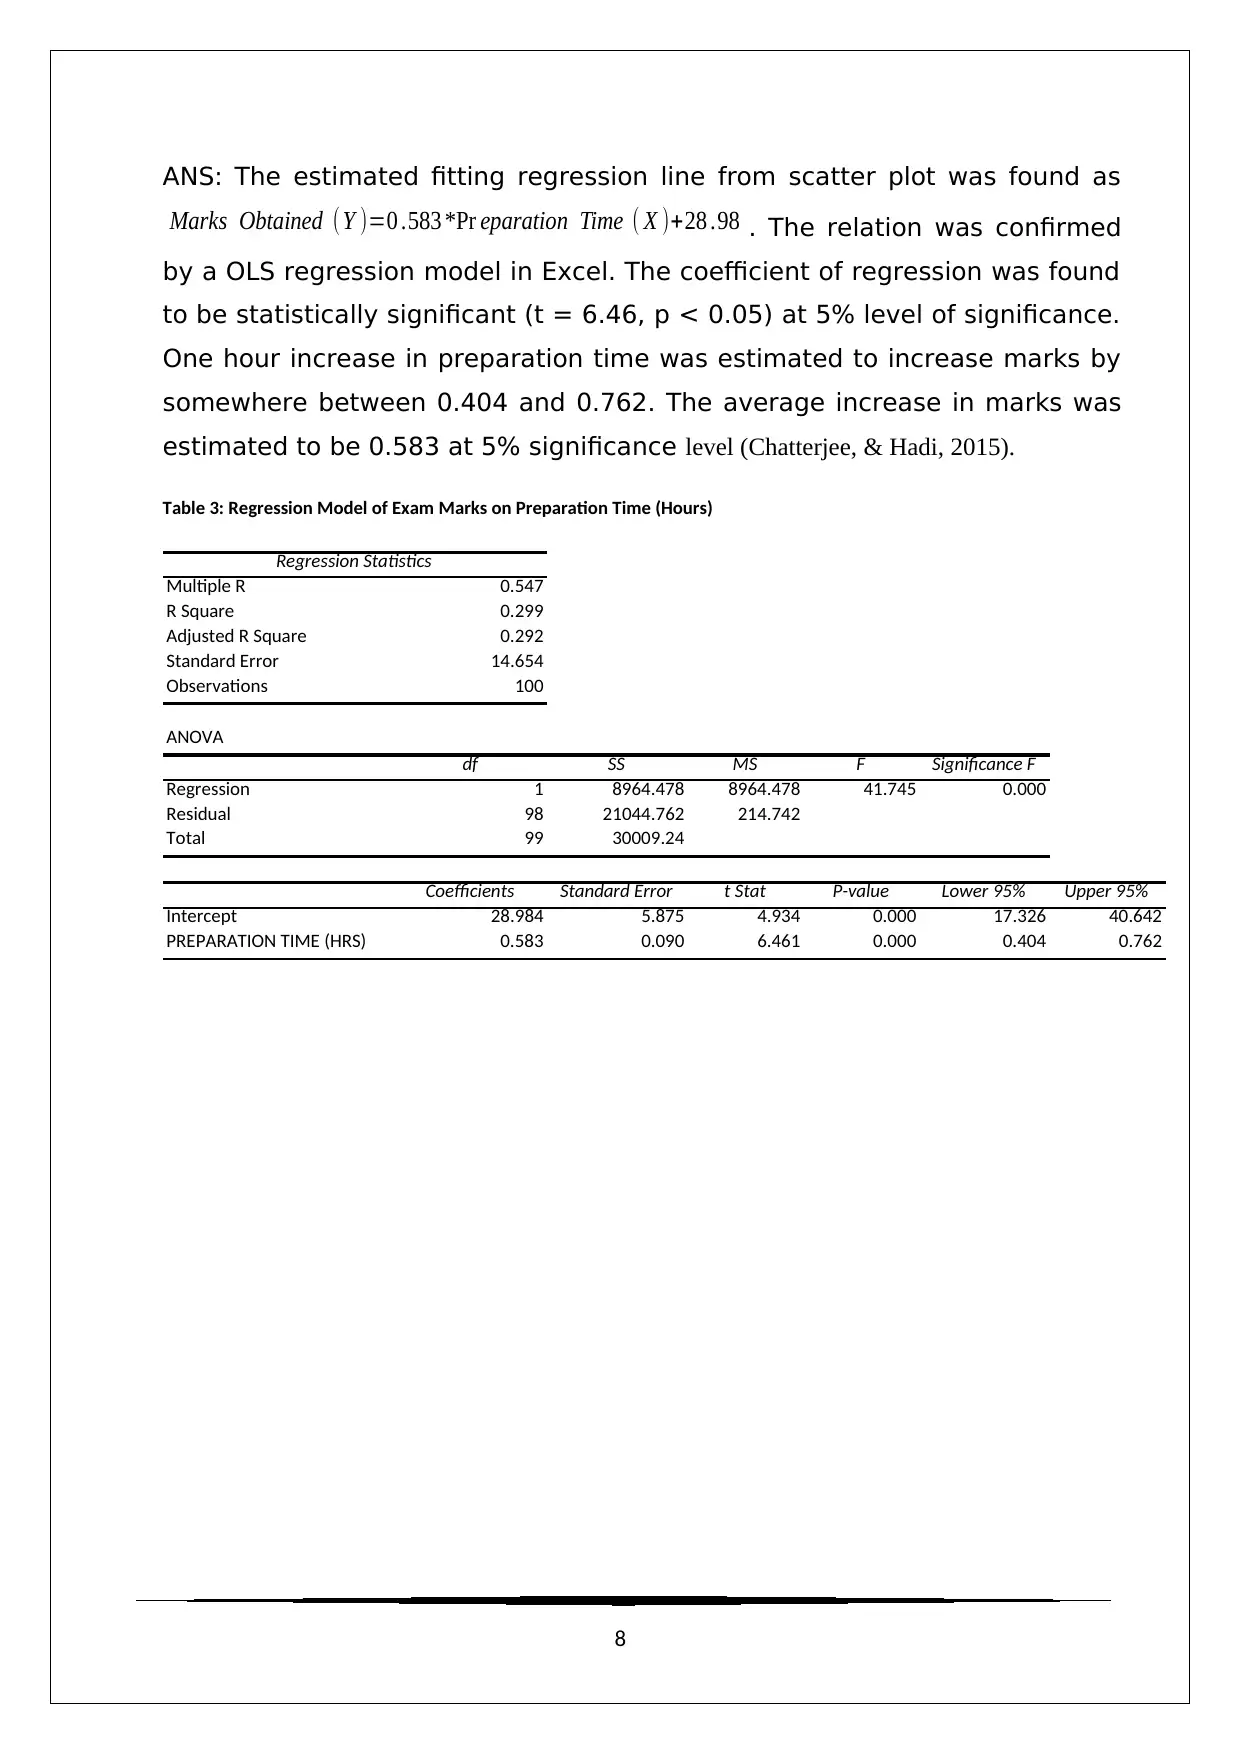
This assignment provides a comprehensive analysis of the relationship between preparation time (in hours) and exam marks for a sample of 100 students, employing statistical methods such as cross-sectional survey, simple random sampling, distribution tables, histograms, scatter plots, and regression analysis. The study identifies exam marks as the dependent variable and preparation time as the independent variable, determining a positive linear relationship between the two. A regression model estimates that a one-hour increase in preparation time leads to an average increase of 0.583 marks, with the model explaining approximately 29.8% of the variation in exam marks. Descriptive statistics reveal an average preparation time of 63.04 hours and an average exam mark of 65.74, with both distributions showing slight negative skewness. Pearson’s correlation confirms a statistically significant positive correlation (r = 0.547, p < 0.05) between preparation time and exam marks, supporting the assumption that increased preparation time leads to improved exam performance. Desklib offers more solved assignments and resources for students.
1 out of 11
Related Documents


Your All-in-One AI-Powered Toolkit for Academic Success.
+13062052269
info@desklib.com
Available 24*7 on WhatsApp / Email
![[object Object]](/_next/static/media/star-bottom.7253800d.svg)
Copyright © 2020–2025 A2Z Services. All Rights Reserved. Developed and managed by ZUCOL.