ETS2111: Business Data Modelling Assignment - Semester 2
VerifiedAdded on 2022/09/29
|11
|1543
|26
Homework Assignment
AI Summary
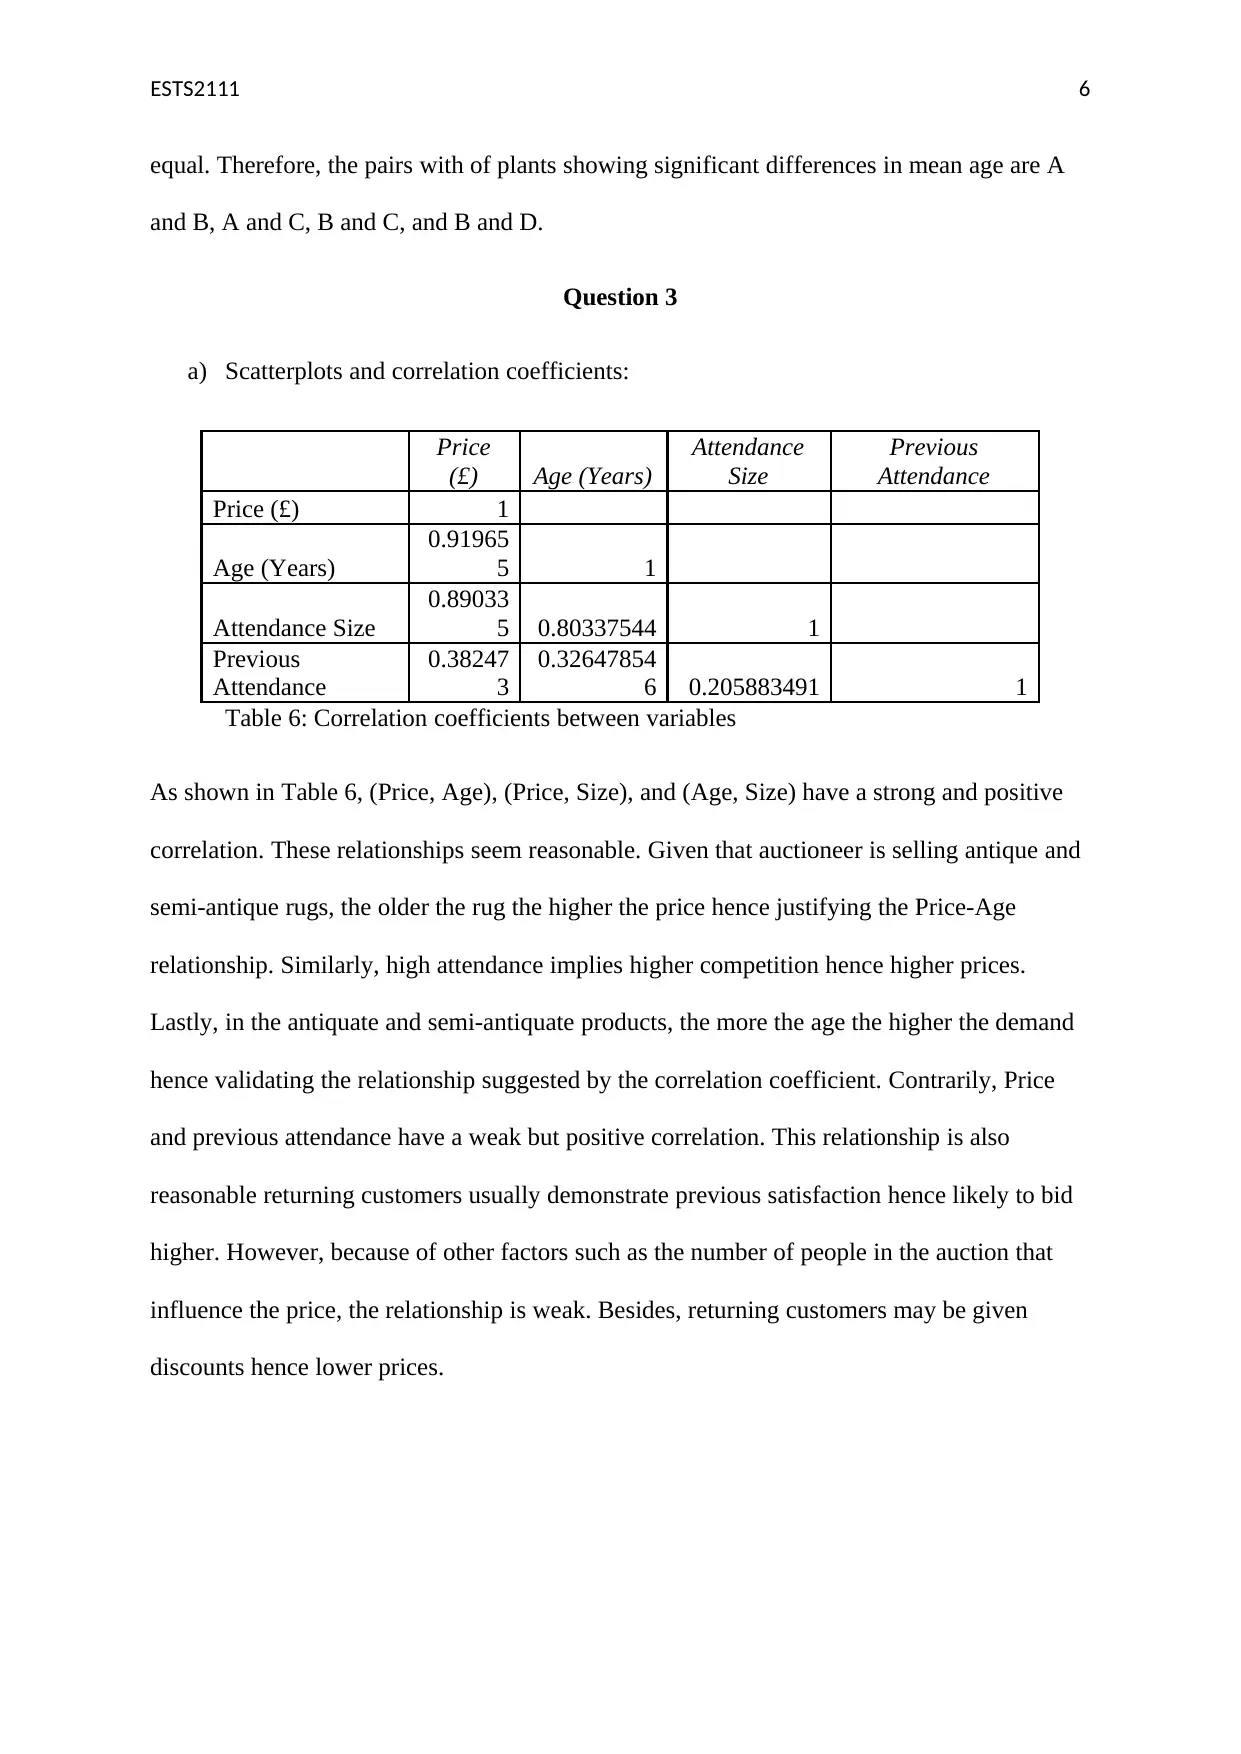
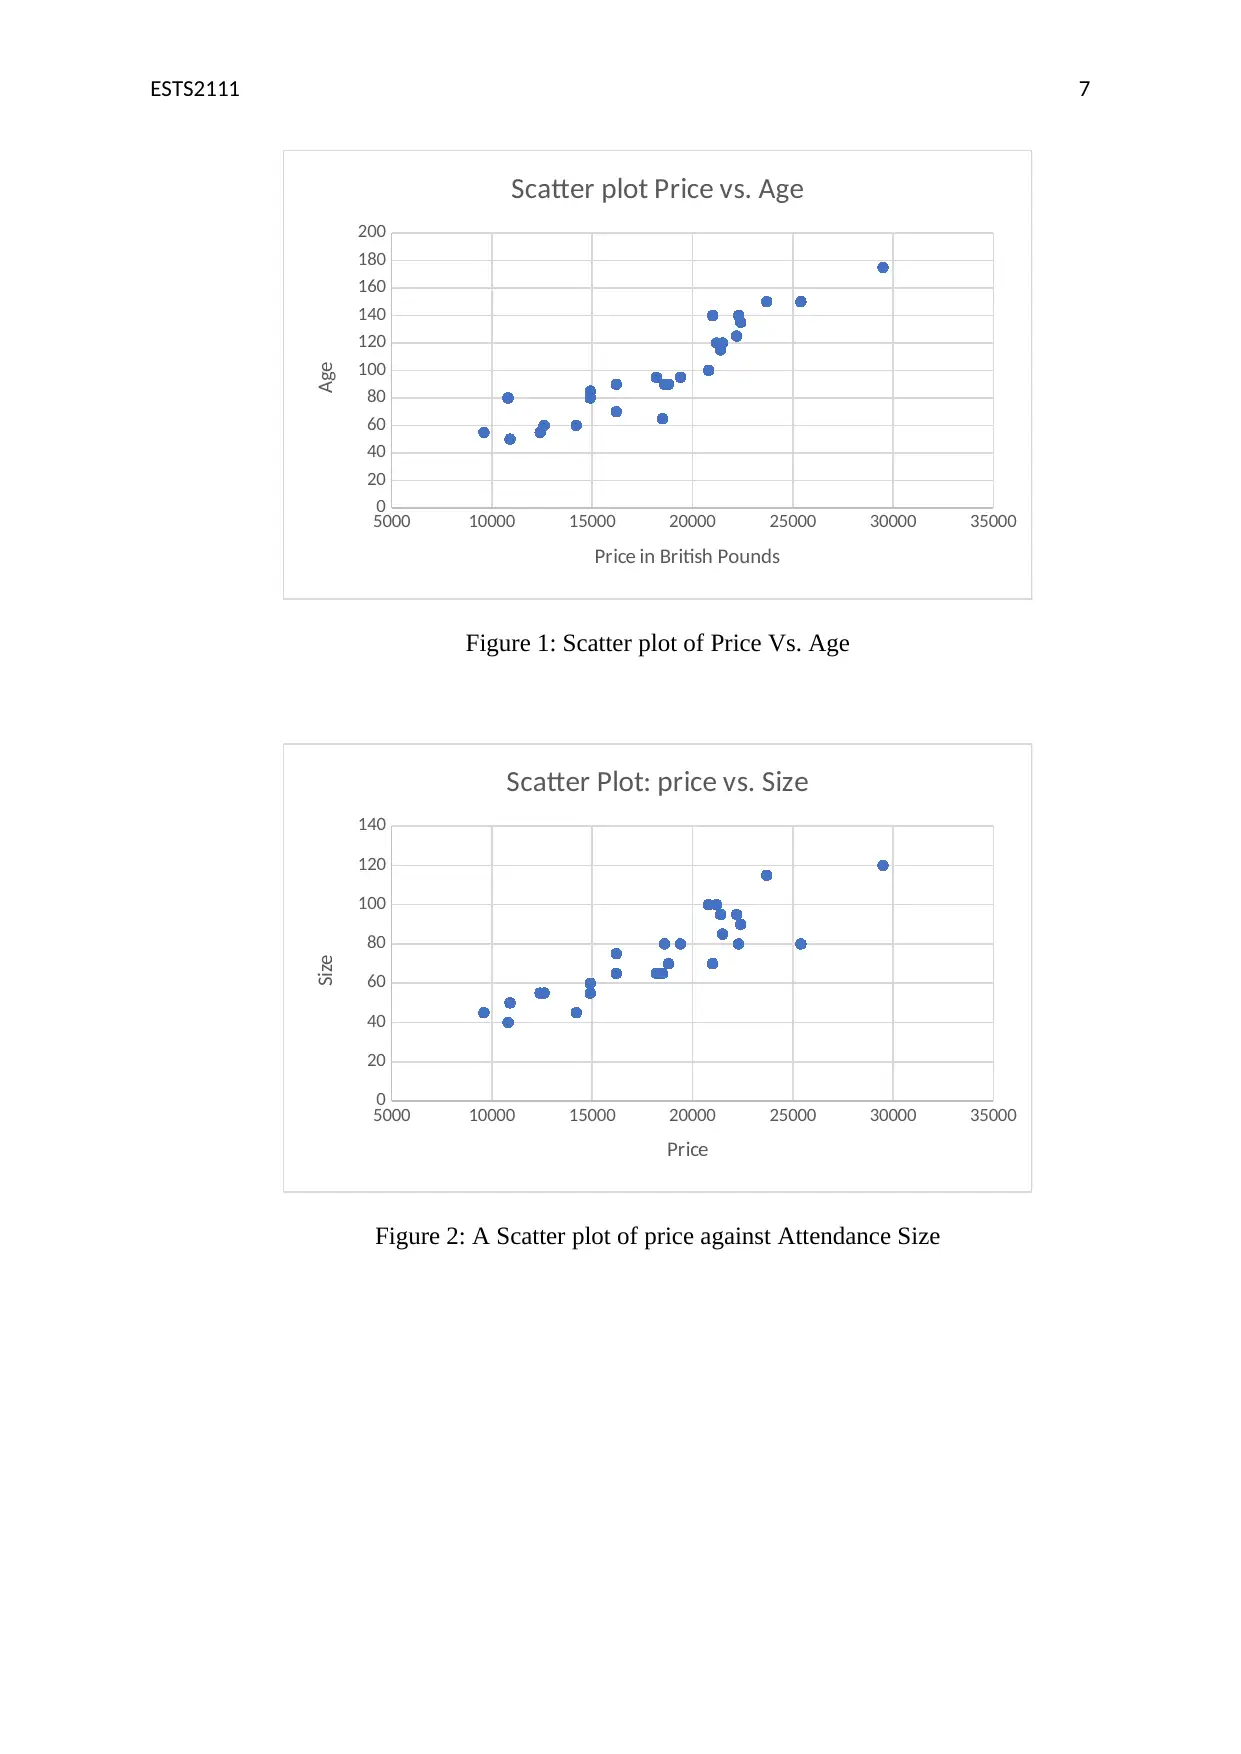
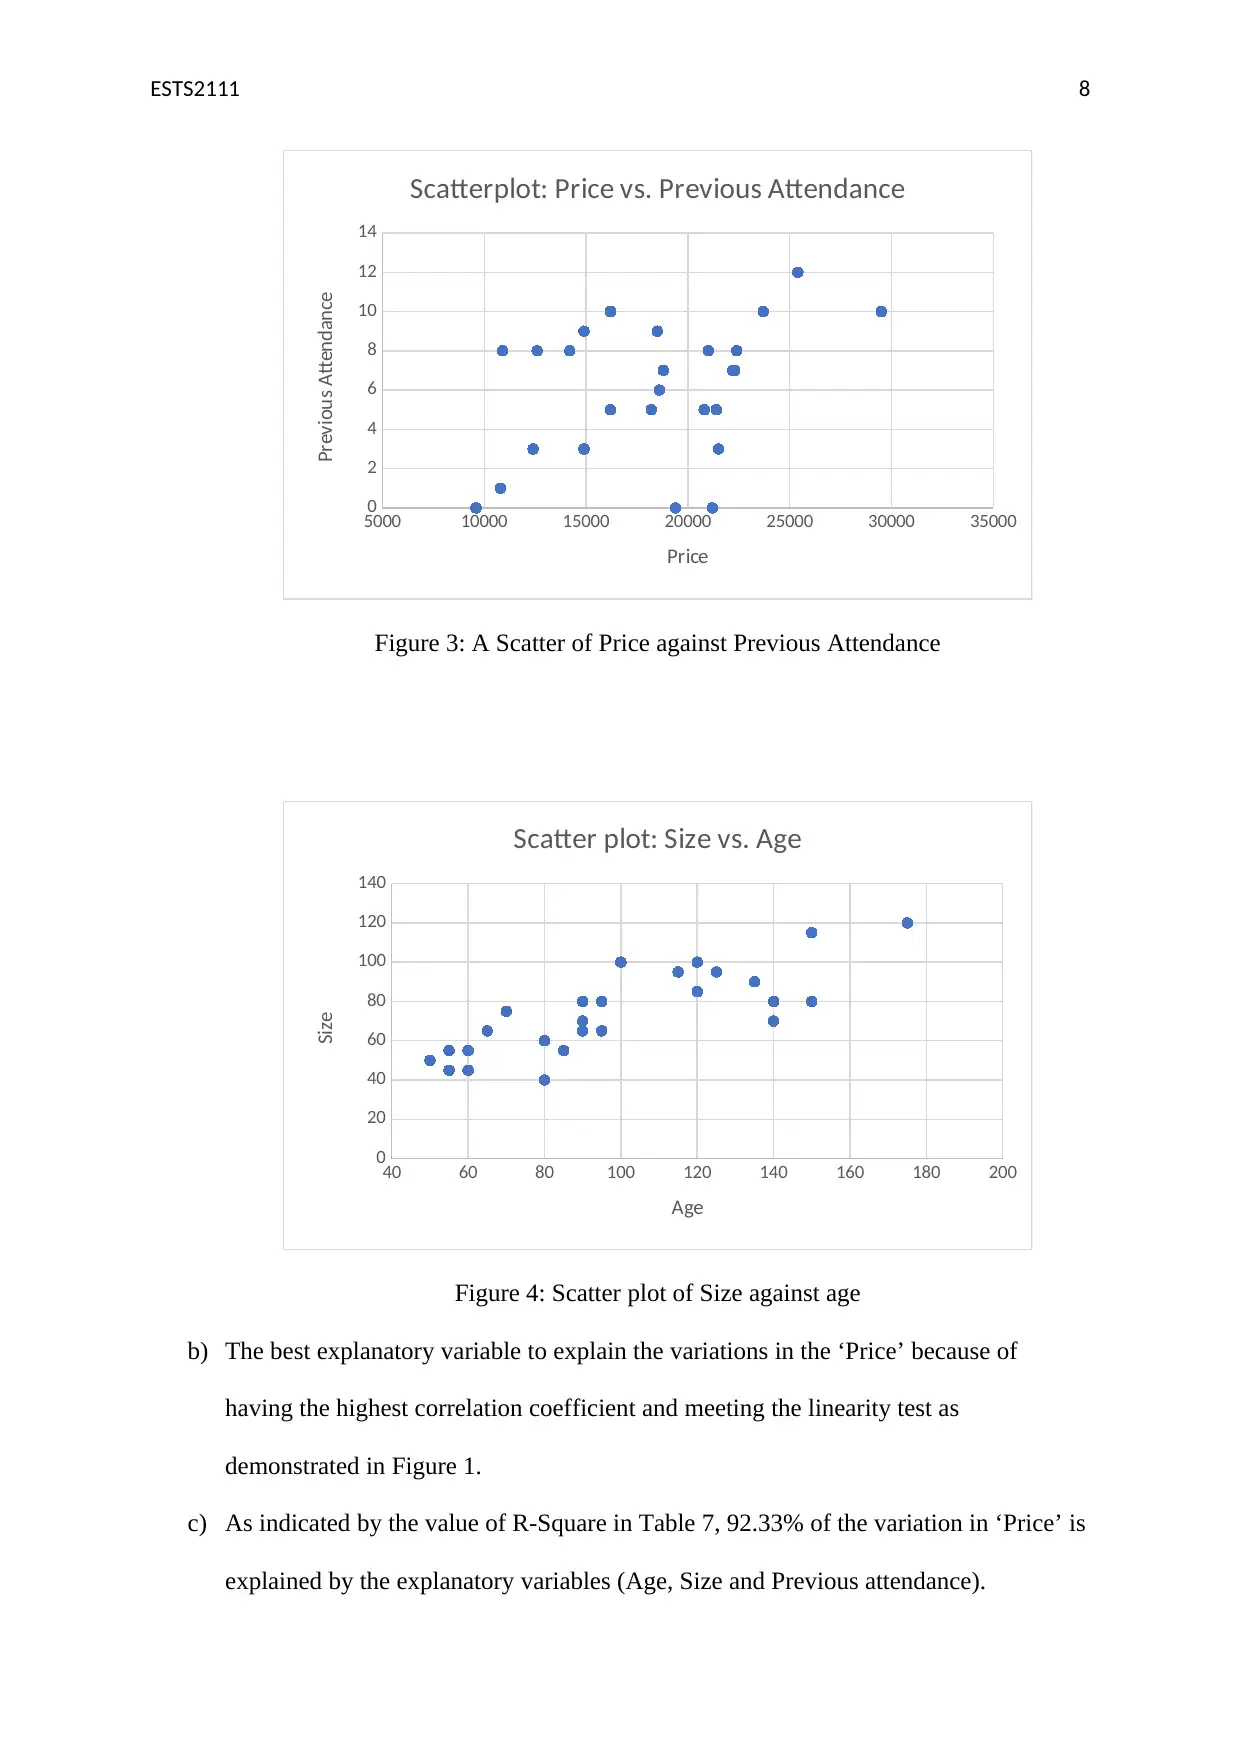
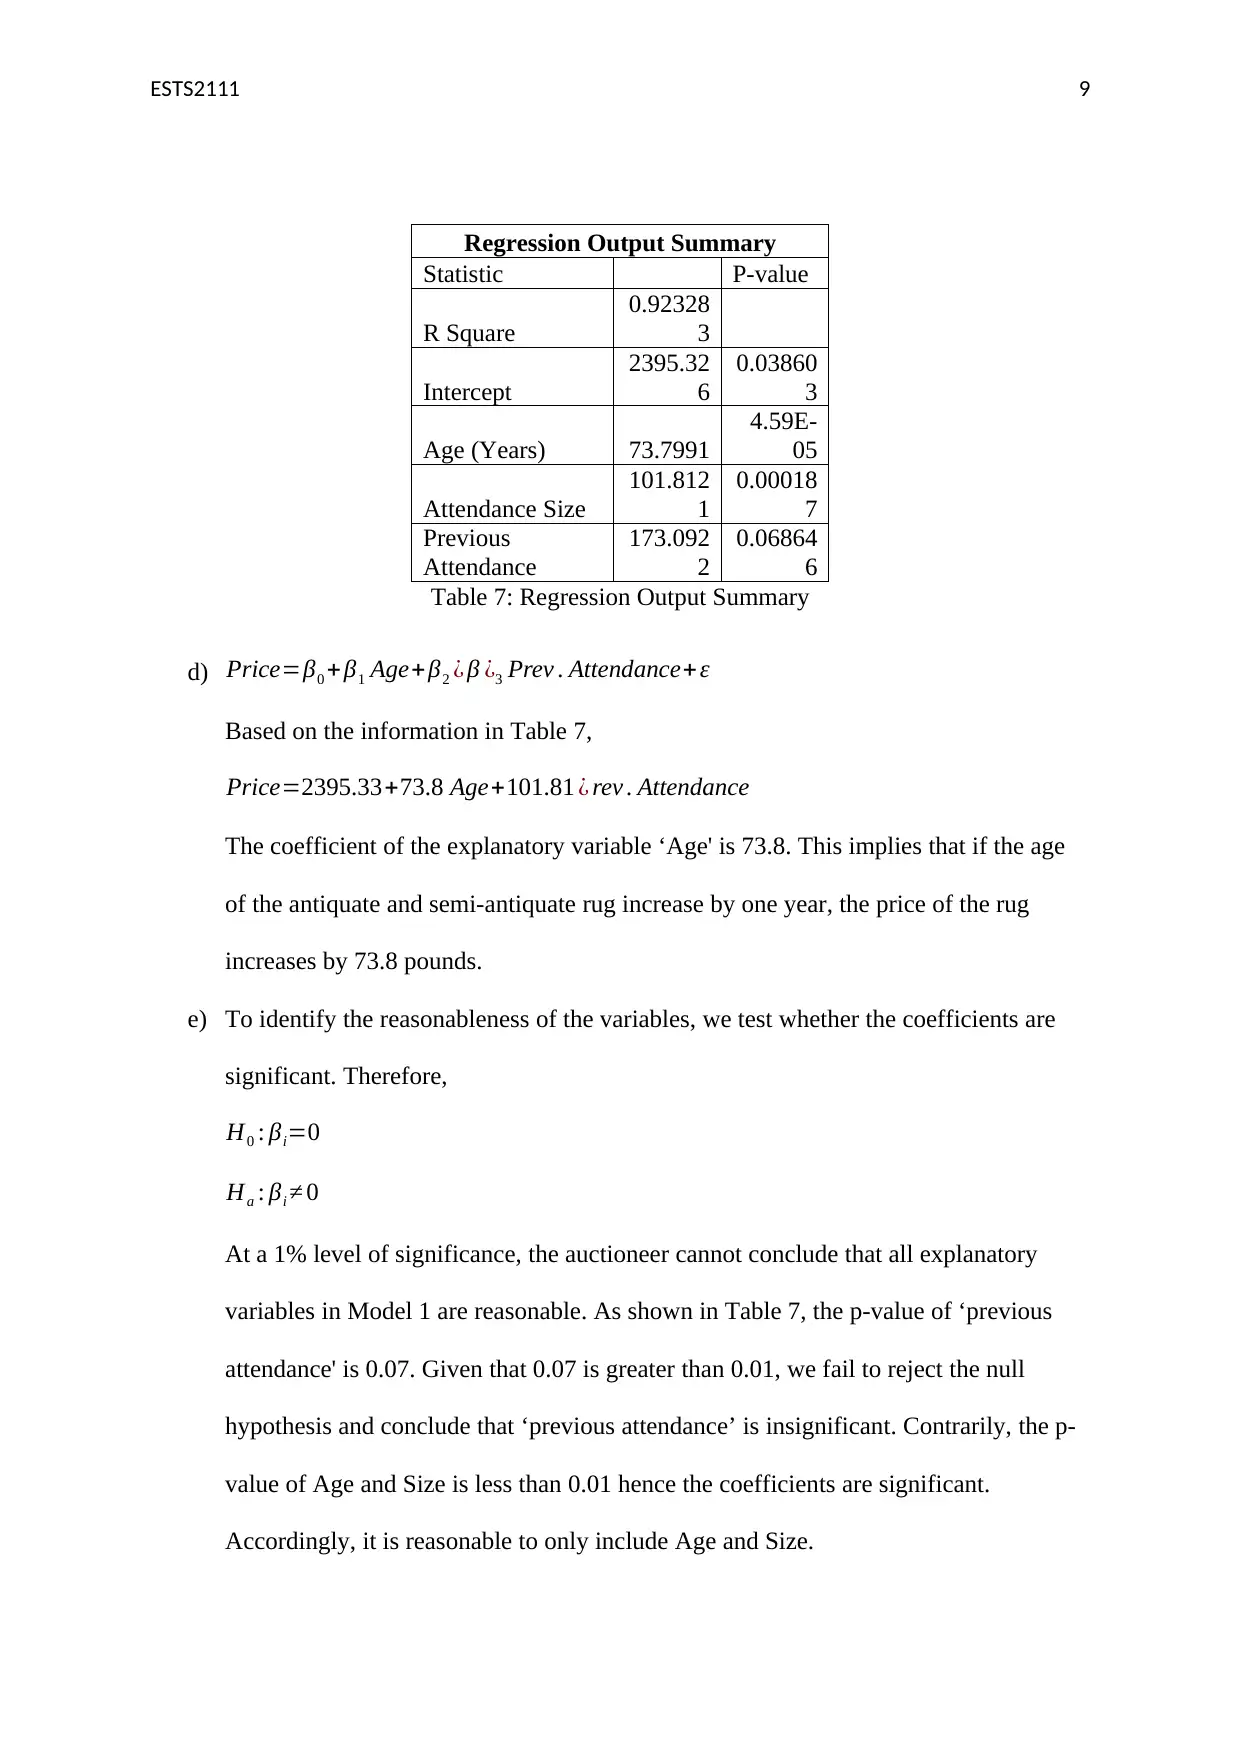
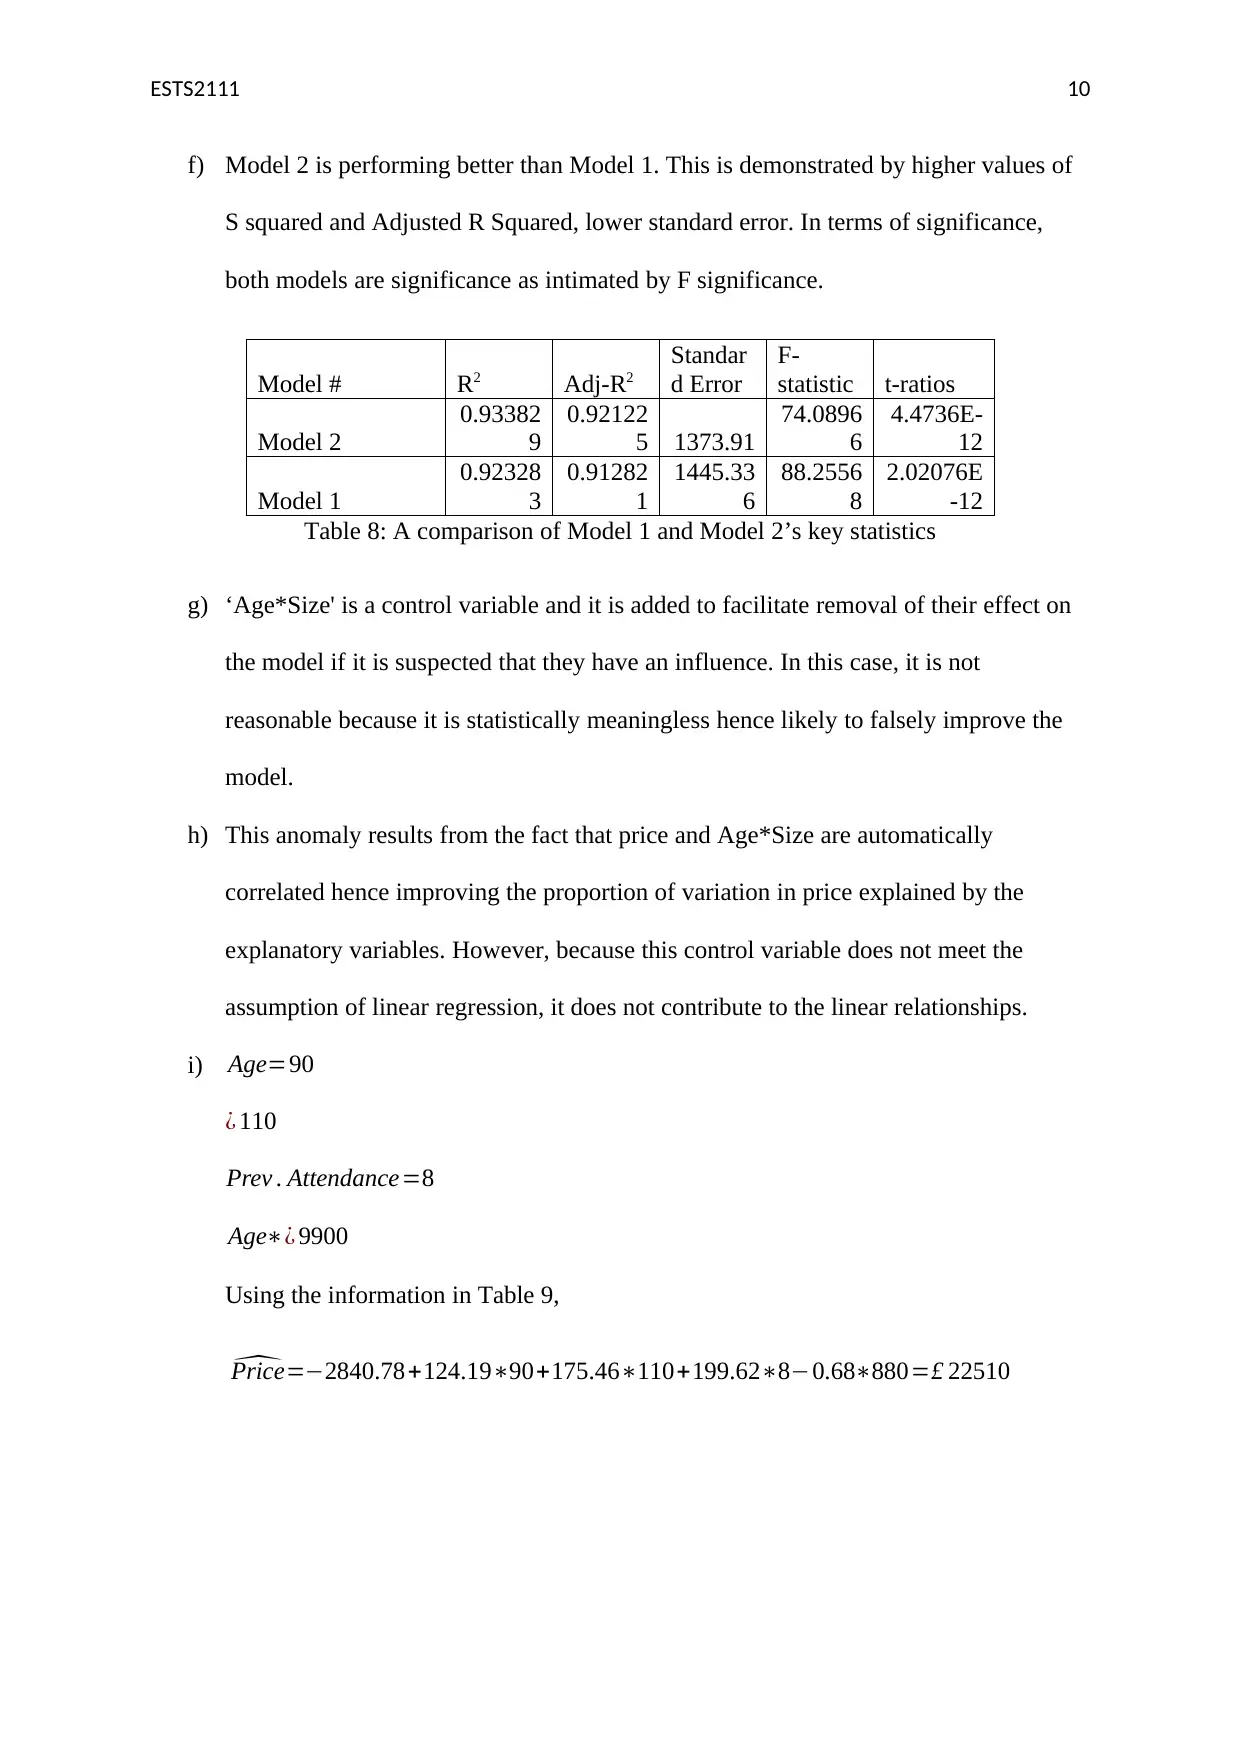
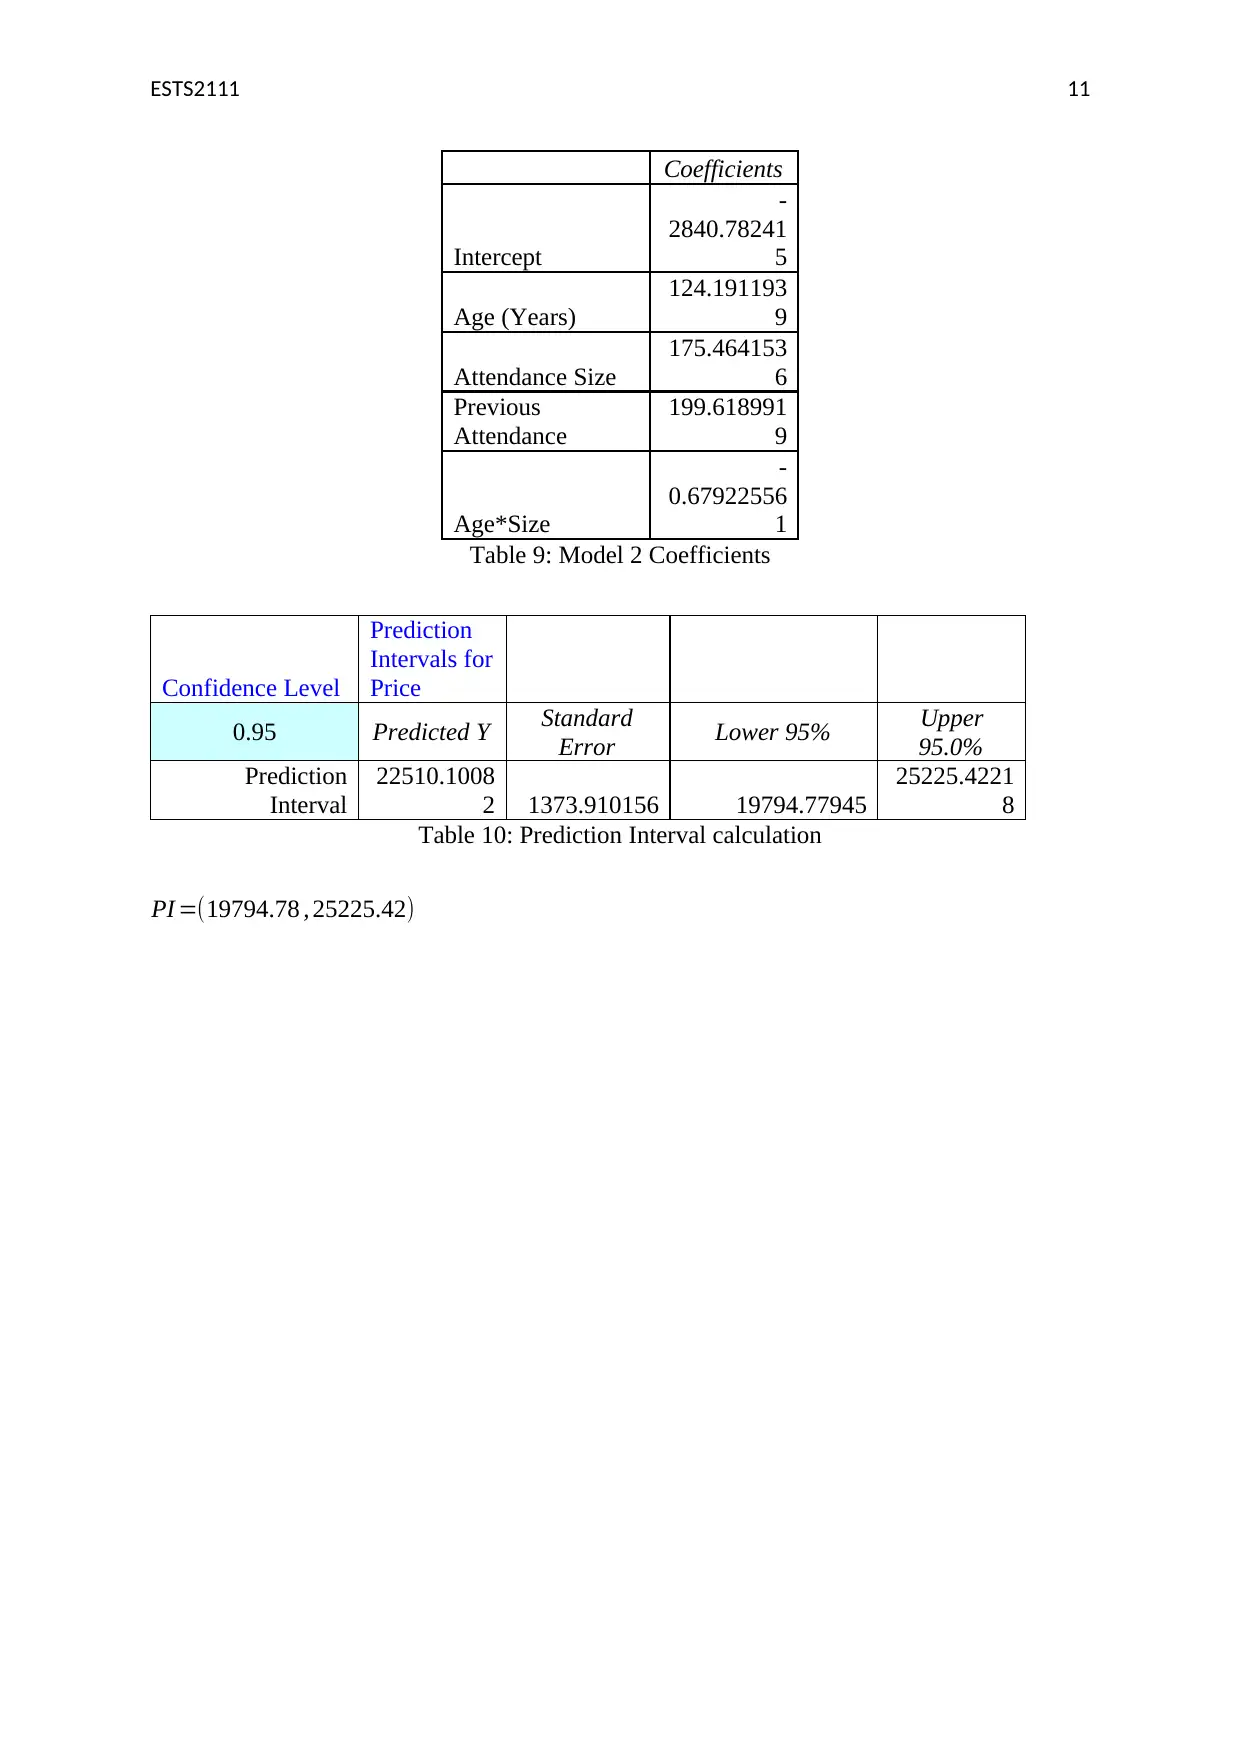
This assignment solution for ETS2111, a business data modelling course, addresses three key questions involving statistical analysis. Question 1 utilizes the Chi-square test to determine the independence of gender and purchasing behavior, presenting a contingency table, calculating expected frequencies, and interpreting the test statistic to fail to reject the null hypothesis. Question 2 employs ANOVA to compare the mean ages of workers across four locations, providing a one-way ANOVA summary table and conducting t-tests to identify significant differences between plant pairs. Question 3 explores regression analysis, examining correlations between variables like price, age, and attendance, constructing scatterplots, and comparing two regression models (Model 1 and Model 2) to determine the best explanatory variables for price variation, interpreting coefficients, and discussing the impact of control variables. The solution includes detailed explanations, Excel outputs, and statistical inferences to support the findings.

1 out of 11
Related Documents


Your All-in-One AI-Powered Toolkit for Academic Success.
+13062052269
info@desklib.com
Available 24*7 on WhatsApp / Email
![[object Object]](/_next/static/media/star-bottom.7253800d.svg)
Copyright © 2020–2026 A2Z Services. All Rights Reserved. Developed and managed by ZUCOL.