Financial Decision-Making Tools Analysis
VerifiedAdded on 2020/07/22
|22
|4231
|59
AI Summary
This report provides a comprehensive analysis of the financial decision-making process within an organization. It examines the use of internal rate of return (IRR) and net present value (NPV) as key financial tools for evaluating investments. The study presents a case where an organization invested $15,000 with a total present value of $22,708, resulting in an IRR of 22.52%. This report is essential for students seeking to understand the application of financial decision-making tools in real-world scenarios.
Contribute Materials
Your contribution can guide someone’s learning journey. Share your
documents today.
Business Decision-making
Secure Best Marks with AI Grader
Need help grading? Try our AI Grader for instant feedback on your assignments.
Table of Contents
INTRODUCTION...........................................................................................................................1
TASK 1............................................................................................................................................1
1.1 Data collection from various sources...............................................................................1
1.2 Survey methodologies......................................................................................................3
1.3 Questionnaire designing ..................................................................................................4
TASK 2............................................................................................................................................6
2.1 Interpretation of data that are collected from the research...............................................6
2.2 Analysis of the results......................................................................................................9
2.3 Calculation of various range...........................................................................................10
2.4 Advantages of correlation coefficient, quartile and percentiles.....................................11
TASK 3..........................................................................................................................................11
3.1 Data representation through using different charts and graphs......................................11
3.2 Trend line .......................................................................................................................16
3.3 Covered in PPT...............................................................................................................17
3.4 Formal report..................................................................................................................17
TASK 4..........................................................................................................................................17
4.1 Different tools use in framing of project........................................................................17
4.2 Representation of Network diagram...............................................................................18
4.3 Tools those are used before investment..........................................................................18
CONCLUSION..............................................................................................................................19
REFERENCES..............................................................................................................................20
INTRODUCTION
Business decision-making is an effective techniques that are use by business organisation
in order to make manage and control there operation. On the other hand it is an important part of
research work because on that basis valuable decisions can be made. It is based on various
strategies and objectives like under this project it relies on student and staff satisfaction and there
experiences regarding there college.
The project consist of various tasks that starts with a data collection plan and research
methods that are needed during the research work (Bernroider and Schmöllerl, 2013). It includes
a set of questionnaires and interviews that are being filled from various number respondents that
are selected for this research. On the basis of data collection a proper analysis and interpretation
is done through presentation of charts and graphs. Various decision making tools is being used in
order to make investment in the projects. A network diagram is being drawn to know the most
shortest time to complete a project.
TASK 1
1.1 Data collection from various sources
For any project it is necessary to have complete data plan because most of the research
project are depend on the plan so that most appropriate results can be drawn. In order to make
the research in right directions and accurate a plan should be collected from various sources as
whether primary or secondary. It mostly influence the students review and there reaction about
their satisfaction with UKCBC college. It consist of various set of questionnaires those are being
asked from selected group of students to know there reaction and feedback regarding their
college performance. It all done because in order to get best possible results and advantages form
the research work. Most of the data is being collected from interviews, checklist, contact
methods and with other past information. The location of the search would be the major
campuses of UKCBC college. Such as:
Park Royal campus
Wentworth House campus
Lords House campus
Cricklewood campus
Holborn campus
1
It will take around 5 week time to conduct overall research work. It is sufficient time to
cover all those location that are selected for research. One of the major aspect of research is
finance which is require to conduct a proper research (Craft, 2013). It will take almost of 5000
pounds in hiring skill people those are going at various campuses of UKCBC to conduct that
reserve. There are basically two ways of data collection:
Quantitative research: The major part of this research methods is use to measure the statistical
and mathematical data through questionnaires and other ways. It is of two types:
Discrete data: It is based on numeration in which a finite number of values are possible
and it can't be subdivided significance.
Continuous data: It can be easily measured. It consist of infinite number of values from
the chosen range of group.
Qualitative data: It is said be that method which deal with description of the data. Under this
data can be observed but can't be measured. Such as texture, appearances etc.
Two sources of data collection are:
Primary source: It is said to be that sources which is collected fro the first time. It is fresh data
without any kind of biases. It of various types:
Survey: It is an overview of about research that are going to be conduct from students
regarding their college.
Checklist: It consist of various lists of item that are required to be included in research
work.
Interviews: It is done face to face as it summarised in order to get complete information
about there ideas at personally.
Some of the other primary sources are photo evidence, tape or video recording. Contract
methods are also be used that includes mail, internet and telephone (Groebner and et. al.,
2011).
Secondary data: This type of data are collected in order to compare current data with past. It
summaries of charts and graphs, office for national statistics and student works etc.
1.2 Survey methodologies
Research is a journey to know some facts about the recent or past data. It is will arises
because of the curiosity in people in order to know some new information regarding any aspect
of that are present in front of them. In order to complete there research they require a proper
2
Secure Best Marks with AI Grader
Need help grading? Try our AI Grader for instant feedback on your assignments.
research methods to identified certain features and quality of that physical object or thing on
which they are going to conduct research. It can be done through proper analysis of questions
and numerical data those are huge assets for an individual as well as country as a whole. Every
research require a practical or theoretical knowledge. Sampling framework is a material or
device from which a particular sample or unit is drawn (Ford and Richardson, 2013). There are
various sampling framework is being required under his research work. Some of them are
follows:
Sampling method: It is a process of selecting a group from a number of population in
order to get right outcome that can be result back to the selected group.
Sample size: It is said to be that act of selecting a certain number of observation that are
to be included under the statistical sample. Under this research a sample of 60 students
are being selected from different campuses of UKCBC college.
Non- probability sampling: It is said to be that techniques in which samples are collected in a
sequences under which not equal chance can be provide in order to be selected. It also consist of:
Convenience: Under this sampling it involve those sample which are drawn from that
part of selected group those are closely available.
Snowball: Under this sample the present study of objects recruit future subjects from
their acquisition.
Quota sample: In this types of method a sample is taken out of stratified population so
that a each subset has a common feature and characteristics can be presented.
Purposive sample: It is said to be that sample that is chosen on the basis of there
characteristics of that particular group (Laudon and et al., 2012). It also known as
judgemental and selective sampling.
1.3 Questionnaire designing
A set of various questions that are having multiple choose option. It is required to achieve
the objective of research. It is organise in such a manner so that student perception can be find
out regarding UKCBC college. It is divided into various types:
Dichotomous: under this a respondents has two of the option to answer a question.
Nominal – polytomus: There are more than two options are available with the students.
Ordinal – polytomus: Under this set of questions a respondents have to answer in order or
sequence form.
3
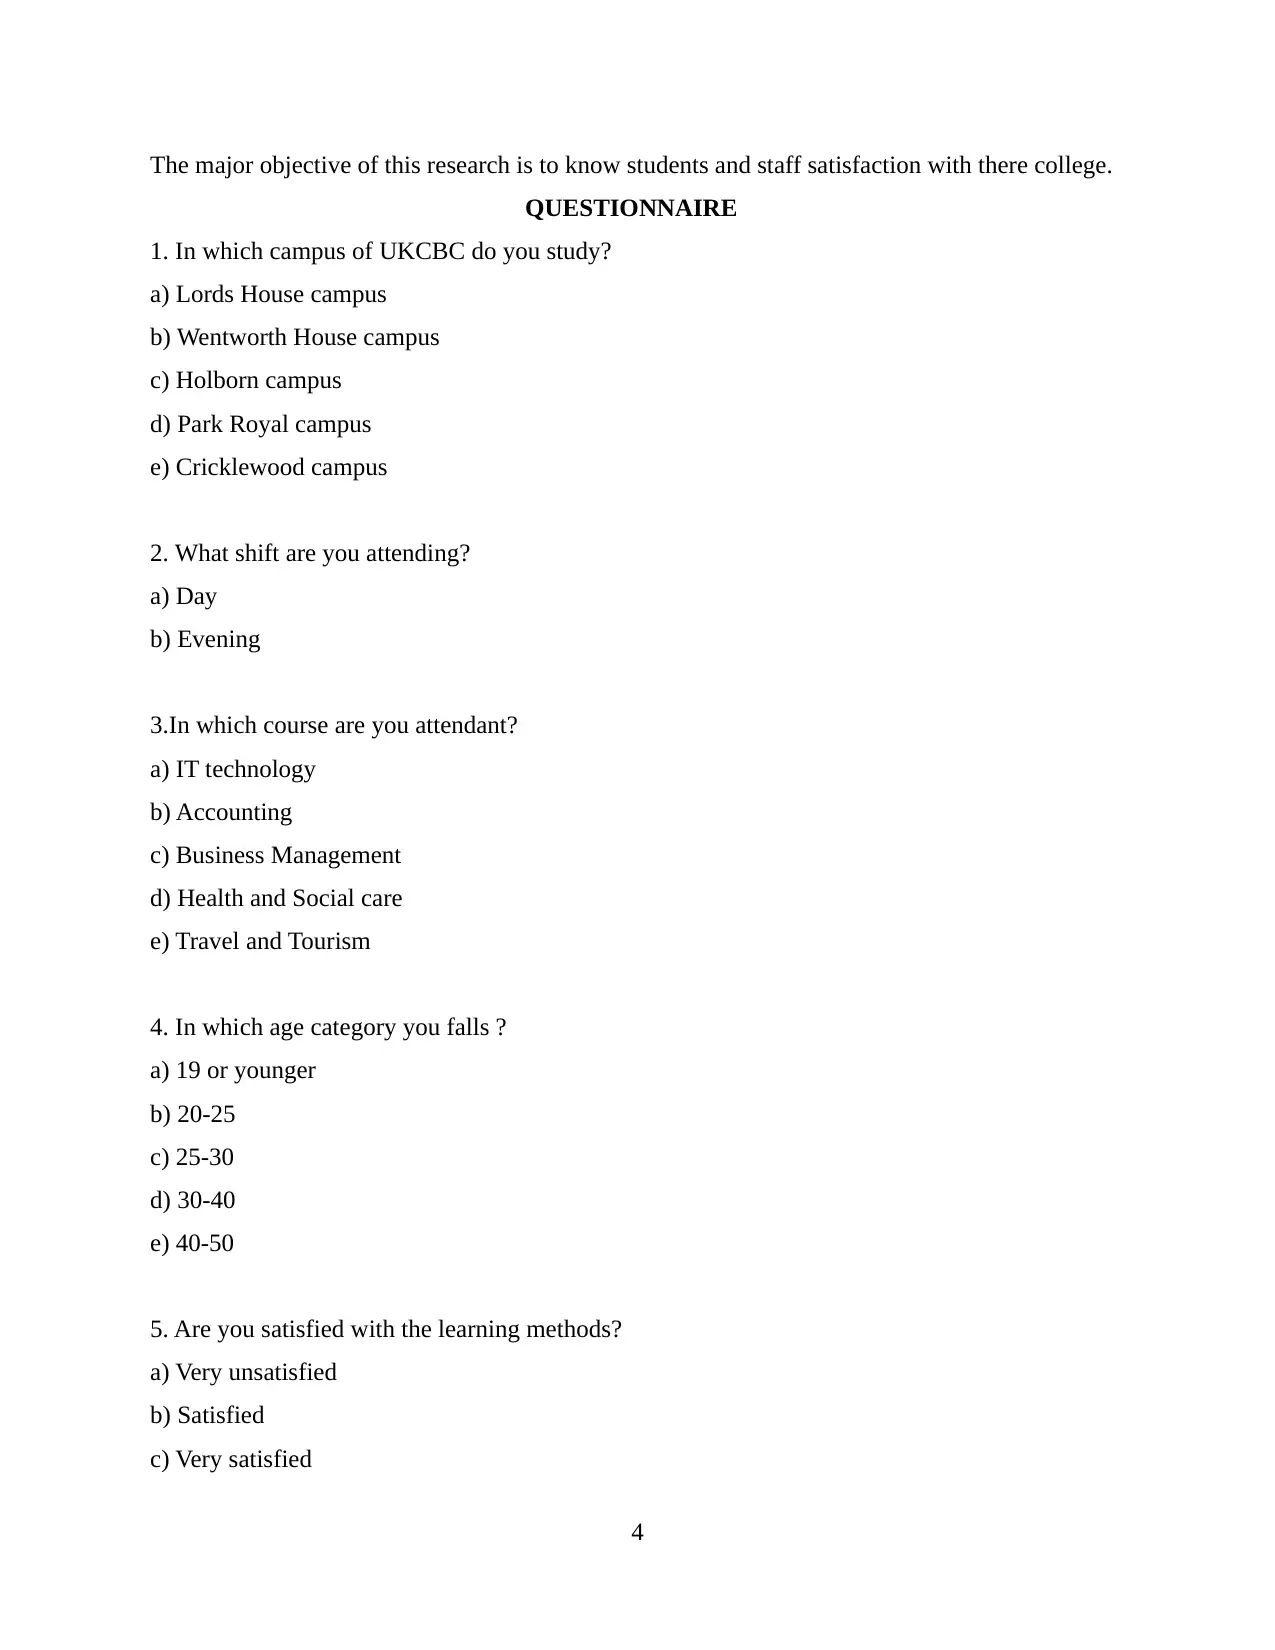
The major objective of this research is to know students and staff satisfaction with there college.
QUESTIONNAIRE
1. In which campus of UKCBC do you study?
a) Lords House campus
b) Wentworth House campus
c) Holborn campus
d) Park Royal campus
e) Cricklewood campus
2. What shift are you attending?
a) Day
b) Evening
3.In which course are you attendant?
a) IT technology
b) Accounting
c) Business Management
d) Health and Social care
e) Travel and Tourism
4. In which age category you falls ?
a) 19 or younger
b) 20-25
c) 25-30
d) 30-40
e) 40-50
5. Are you satisfied with the learning methods?
a) Very unsatisfied
b) Satisfied
c) Very satisfied
4
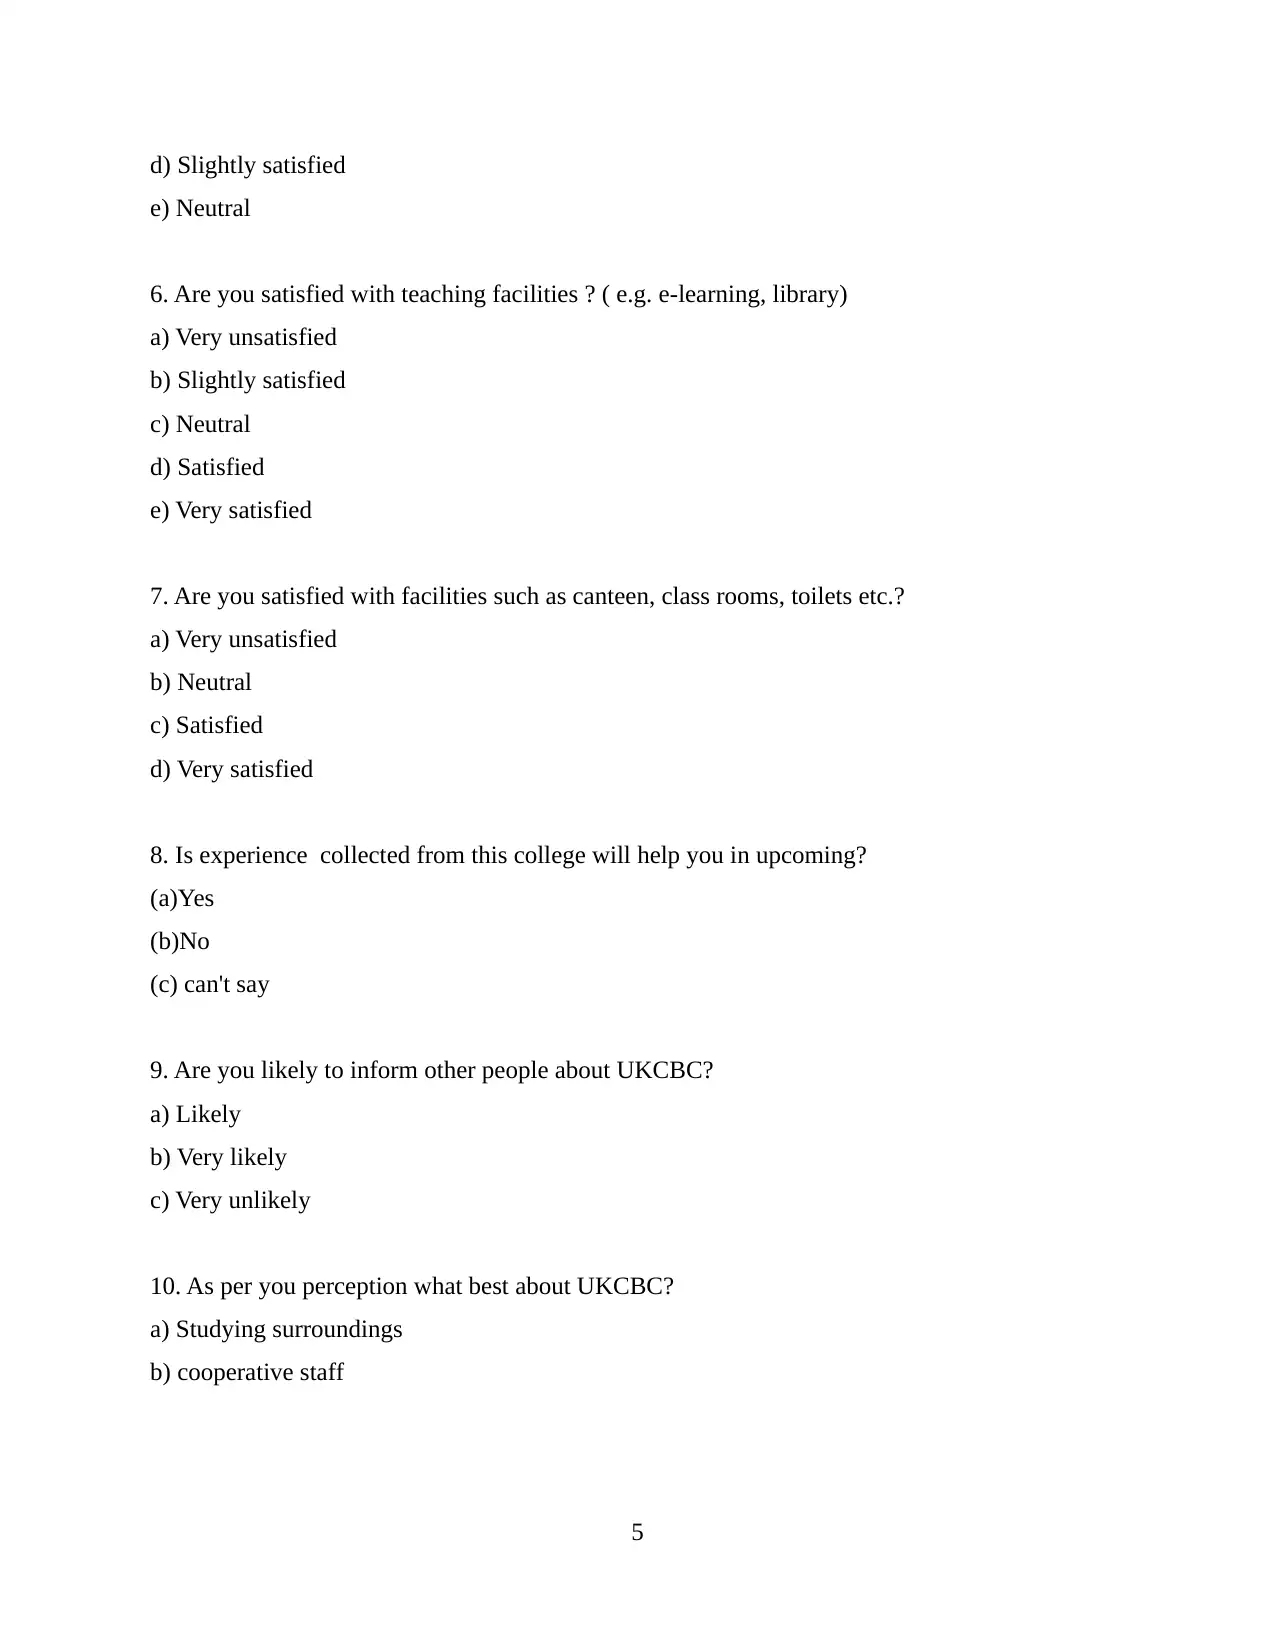
d) Slightly satisfied
e) Neutral
6. Are you satisfied with teaching facilities ? ( e.g. e-learning, library)
a) Very unsatisfied
b) Slightly satisfied
c) Neutral
d) Satisfied
e) Very satisfied
7. Are you satisfied with facilities such as canteen, class rooms, toilets etc.?
a) Very unsatisfied
b) Neutral
c) Satisfied
d) Very satisfied
8. Is experience collected from this college will help you in upcoming?
(a)Yes
(b)No
(c) can't say
9. Are you likely to inform other people about UKCBC?
a) Likely
b) Very likely
c) Very unlikely
10. As per you perception what best about UKCBC?
a) Studying surroundings
b) cooperative staff
5
Paraphrase This Document
Need a fresh take? Get an instant paraphrase of this document with our AI Paraphraser
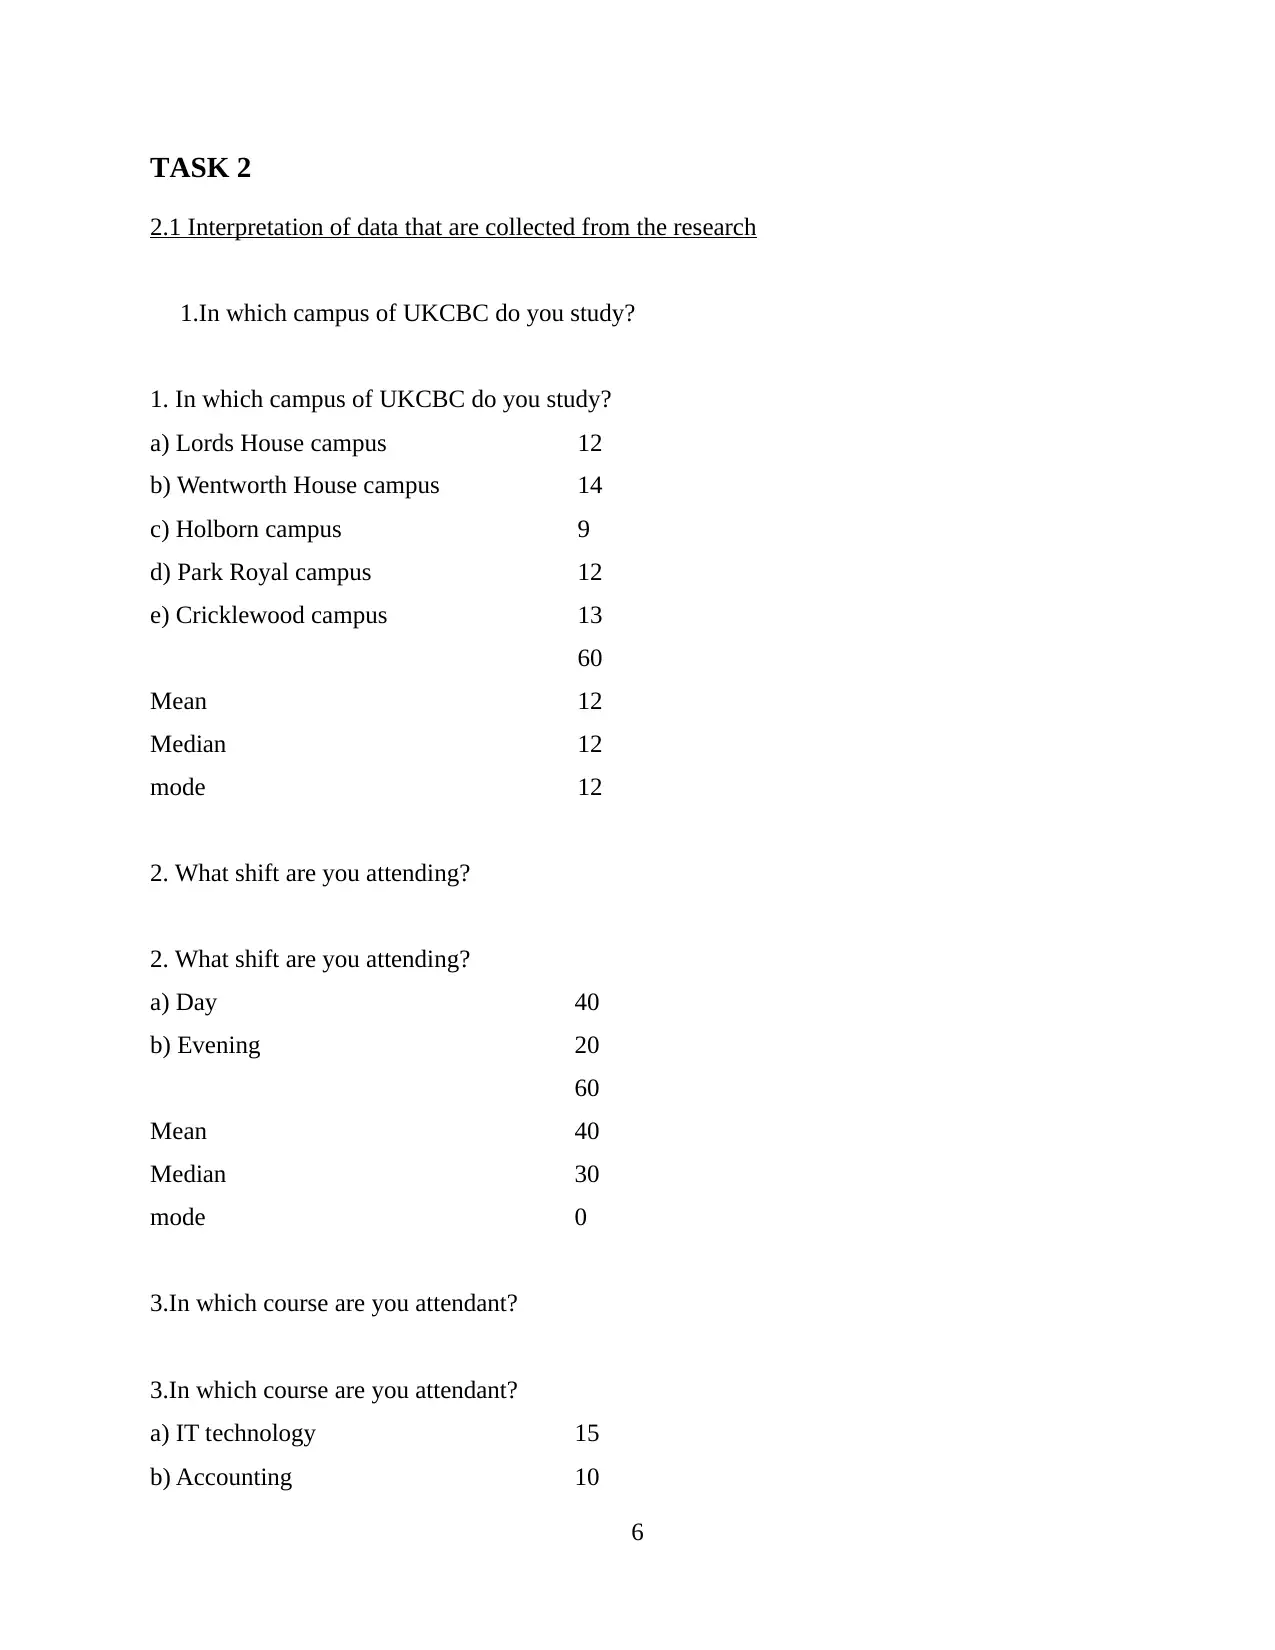
TASK 2
2.1 Interpretation of data that are collected from the research
1.In which campus of UKCBC do you study?
1. In which campus of UKCBC do you study?
a) Lords House campus 12
b) Wentworth House campus 14
c) Holborn campus 9
d) Park Royal campus 12
e) Cricklewood campus 13
60
Mean 12
Median 12
mode 12
2. What shift are you attending?
2. What shift are you attending?
a) Day 40
b) Evening 20
60
Mean 40
Median 30
mode 0
3.In which course are you attendant?
3.In which course are you attendant?
a) IT technology 15
b) Accounting 10
6
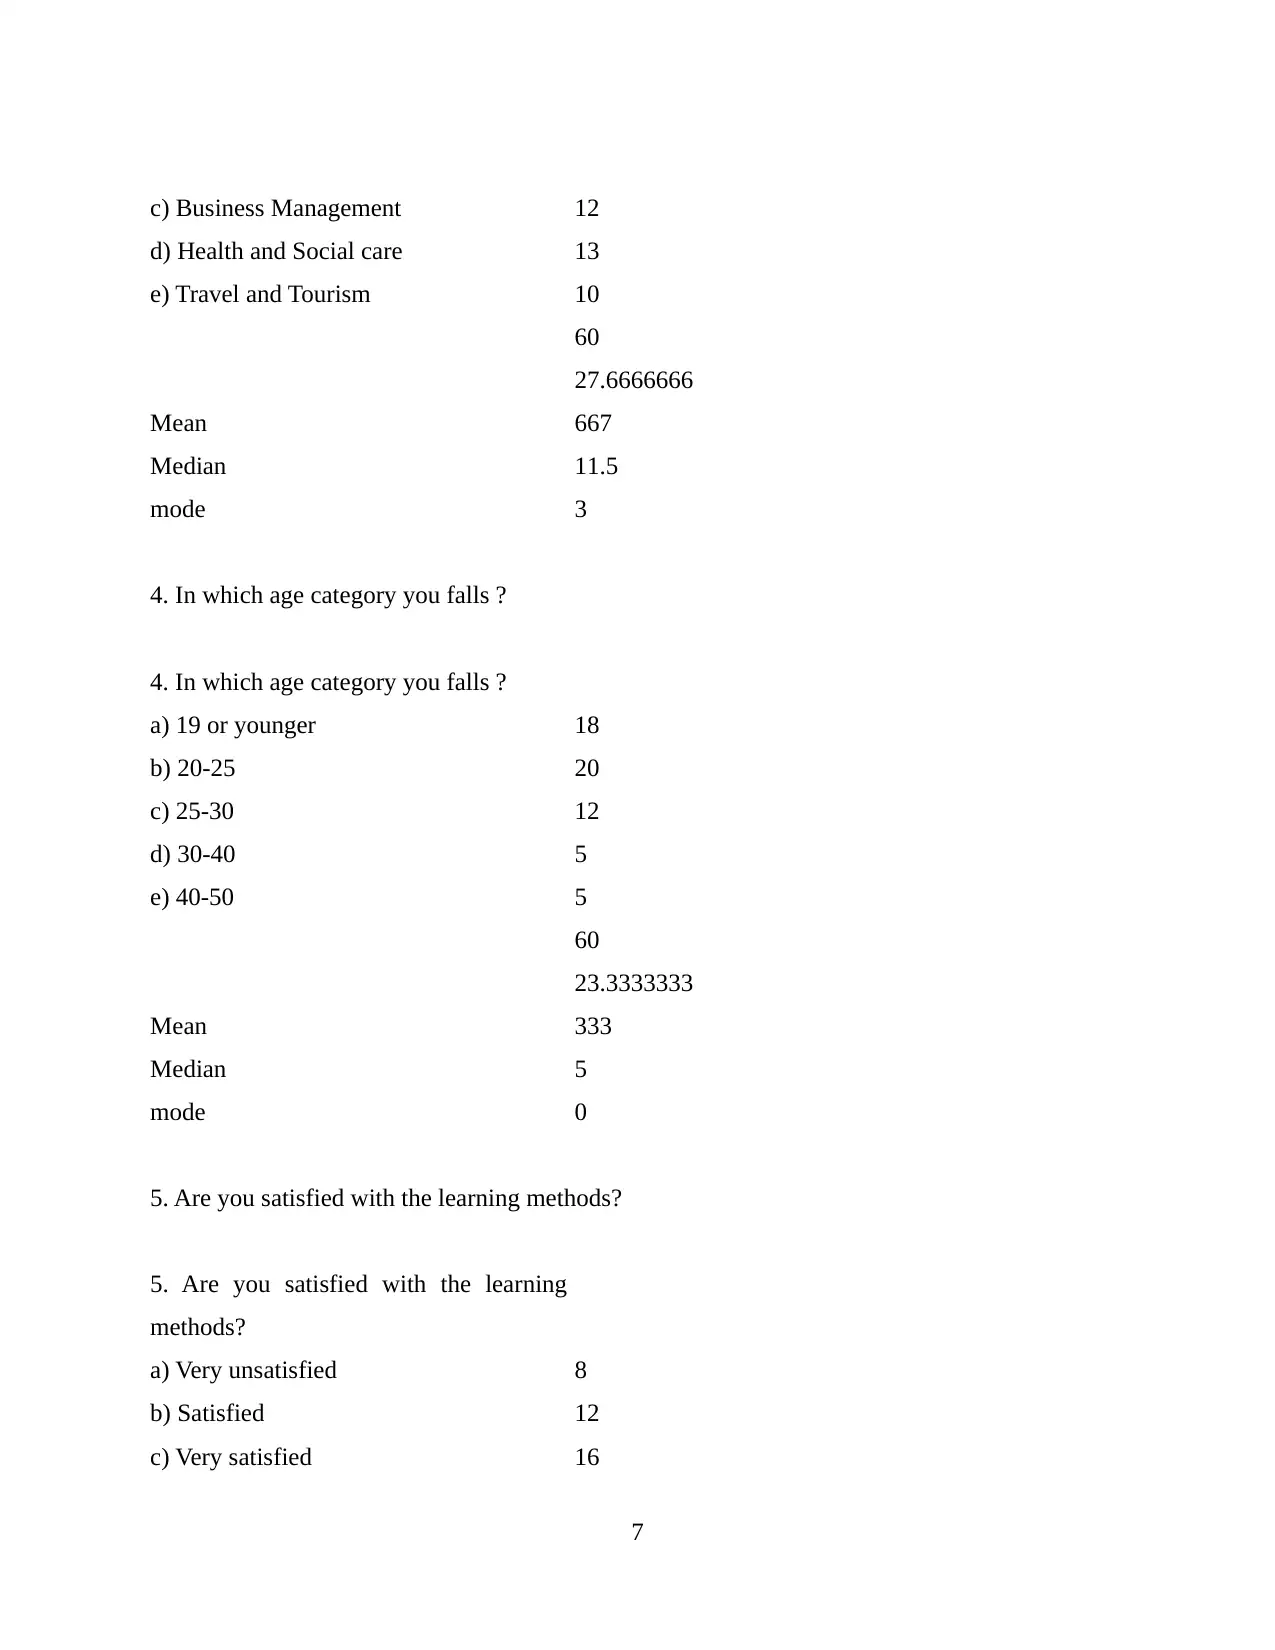
c) Business Management 12
d) Health and Social care 13
e) Travel and Tourism 10
60
Mean
27.6666666
667
Median 11.5
mode 3
4. In which age category you falls ?
4. In which age category you falls ?
a) 19 or younger 18
b) 20-25 20
c) 25-30 12
d) 30-40 5
e) 40-50 5
60
Mean
23.3333333
333
Median 5
mode 0
5. Are you satisfied with the learning methods?
5. Are you satisfied with the learning
methods?
a) Very unsatisfied 8
b) Satisfied 12
c) Very satisfied 16
7
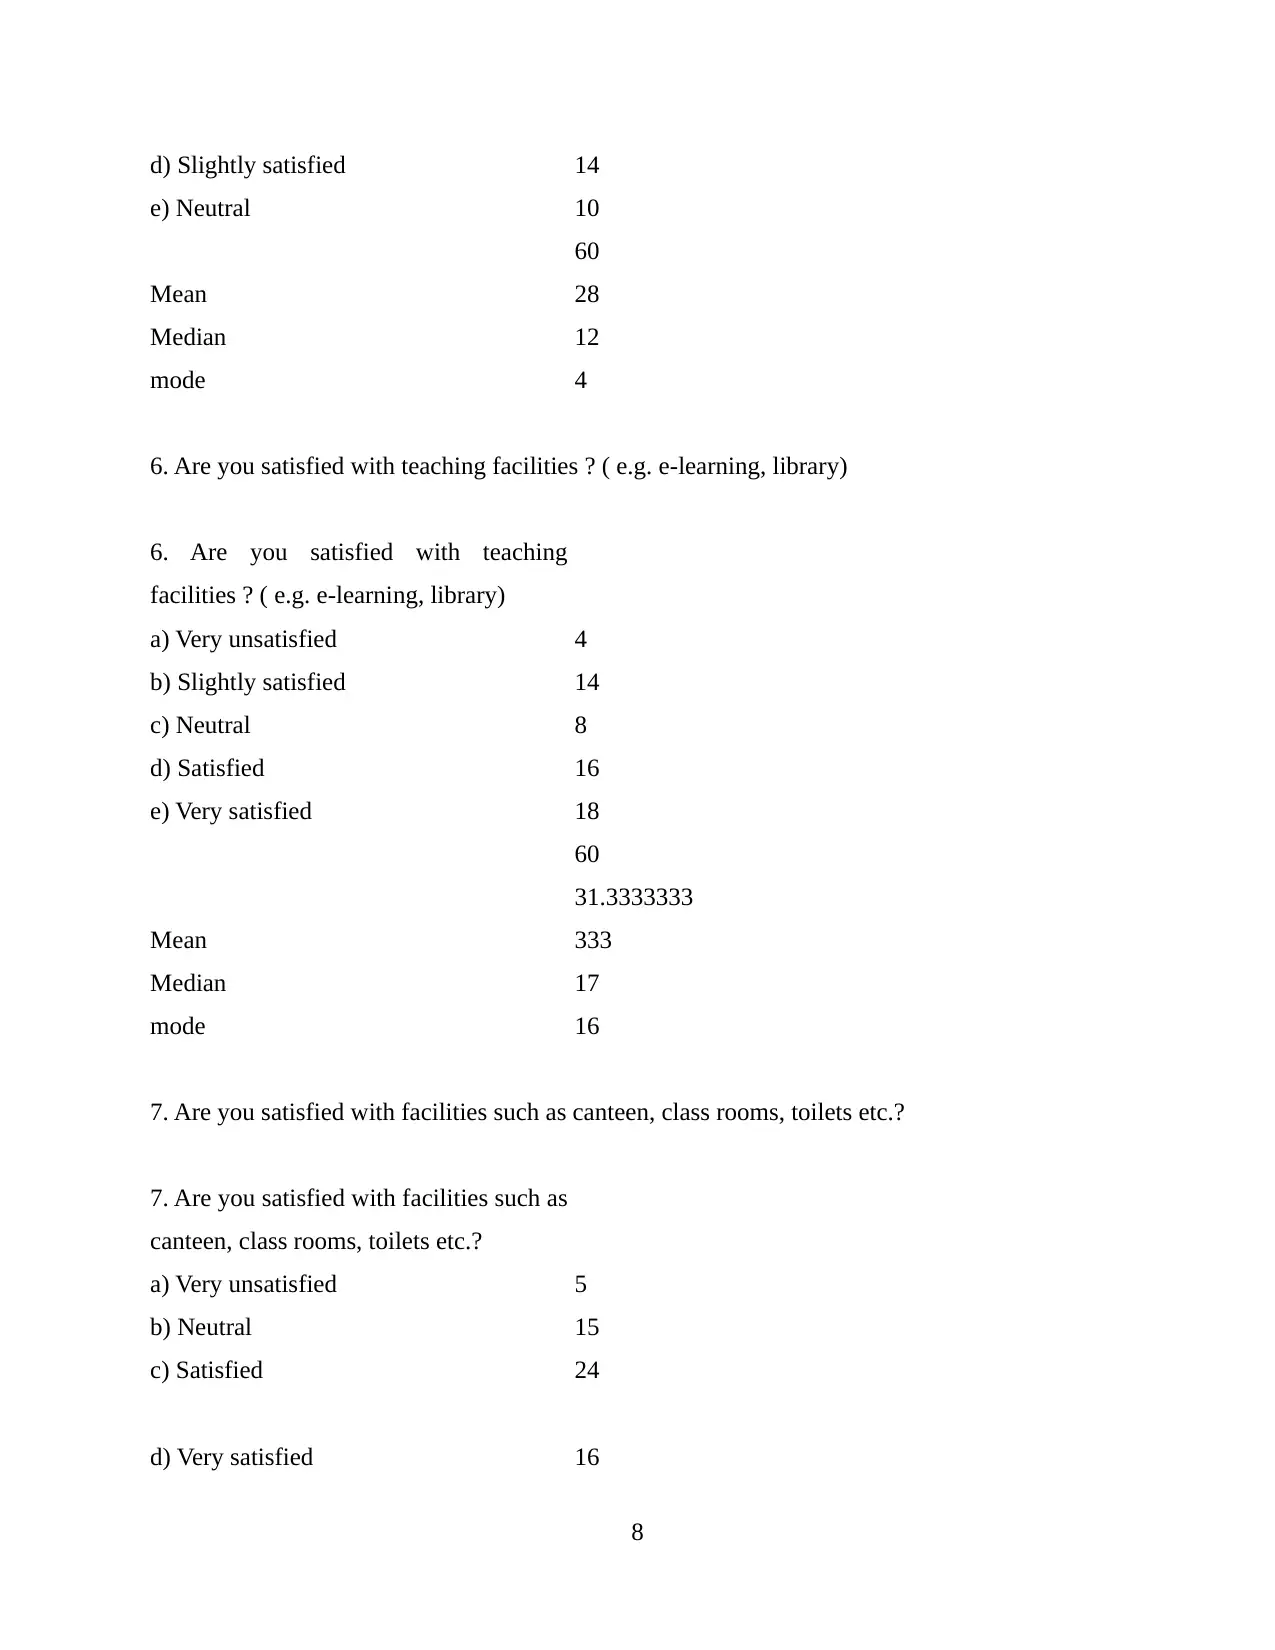
d) Slightly satisfied 14
e) Neutral 10
60
Mean 28
Median 12
mode 4
6. Are you satisfied with teaching facilities ? ( e.g. e-learning, library)
6. Are you satisfied with teaching
facilities ? ( e.g. e-learning, library)
a) Very unsatisfied 4
b) Slightly satisfied 14
c) Neutral 8
d) Satisfied 16
e) Very satisfied 18
60
Mean
31.3333333
333
Median 17
mode 16
7. Are you satisfied with facilities such as canteen, class rooms, toilets etc.?
7. Are you satisfied with facilities such as
canteen, class rooms, toilets etc.?
a) Very unsatisfied 5
b) Neutral 15
c) Satisfied 24
d) Very satisfied 16
8
Secure Best Marks with AI Grader
Need help grading? Try our AI Grader for instant feedback on your assignments.
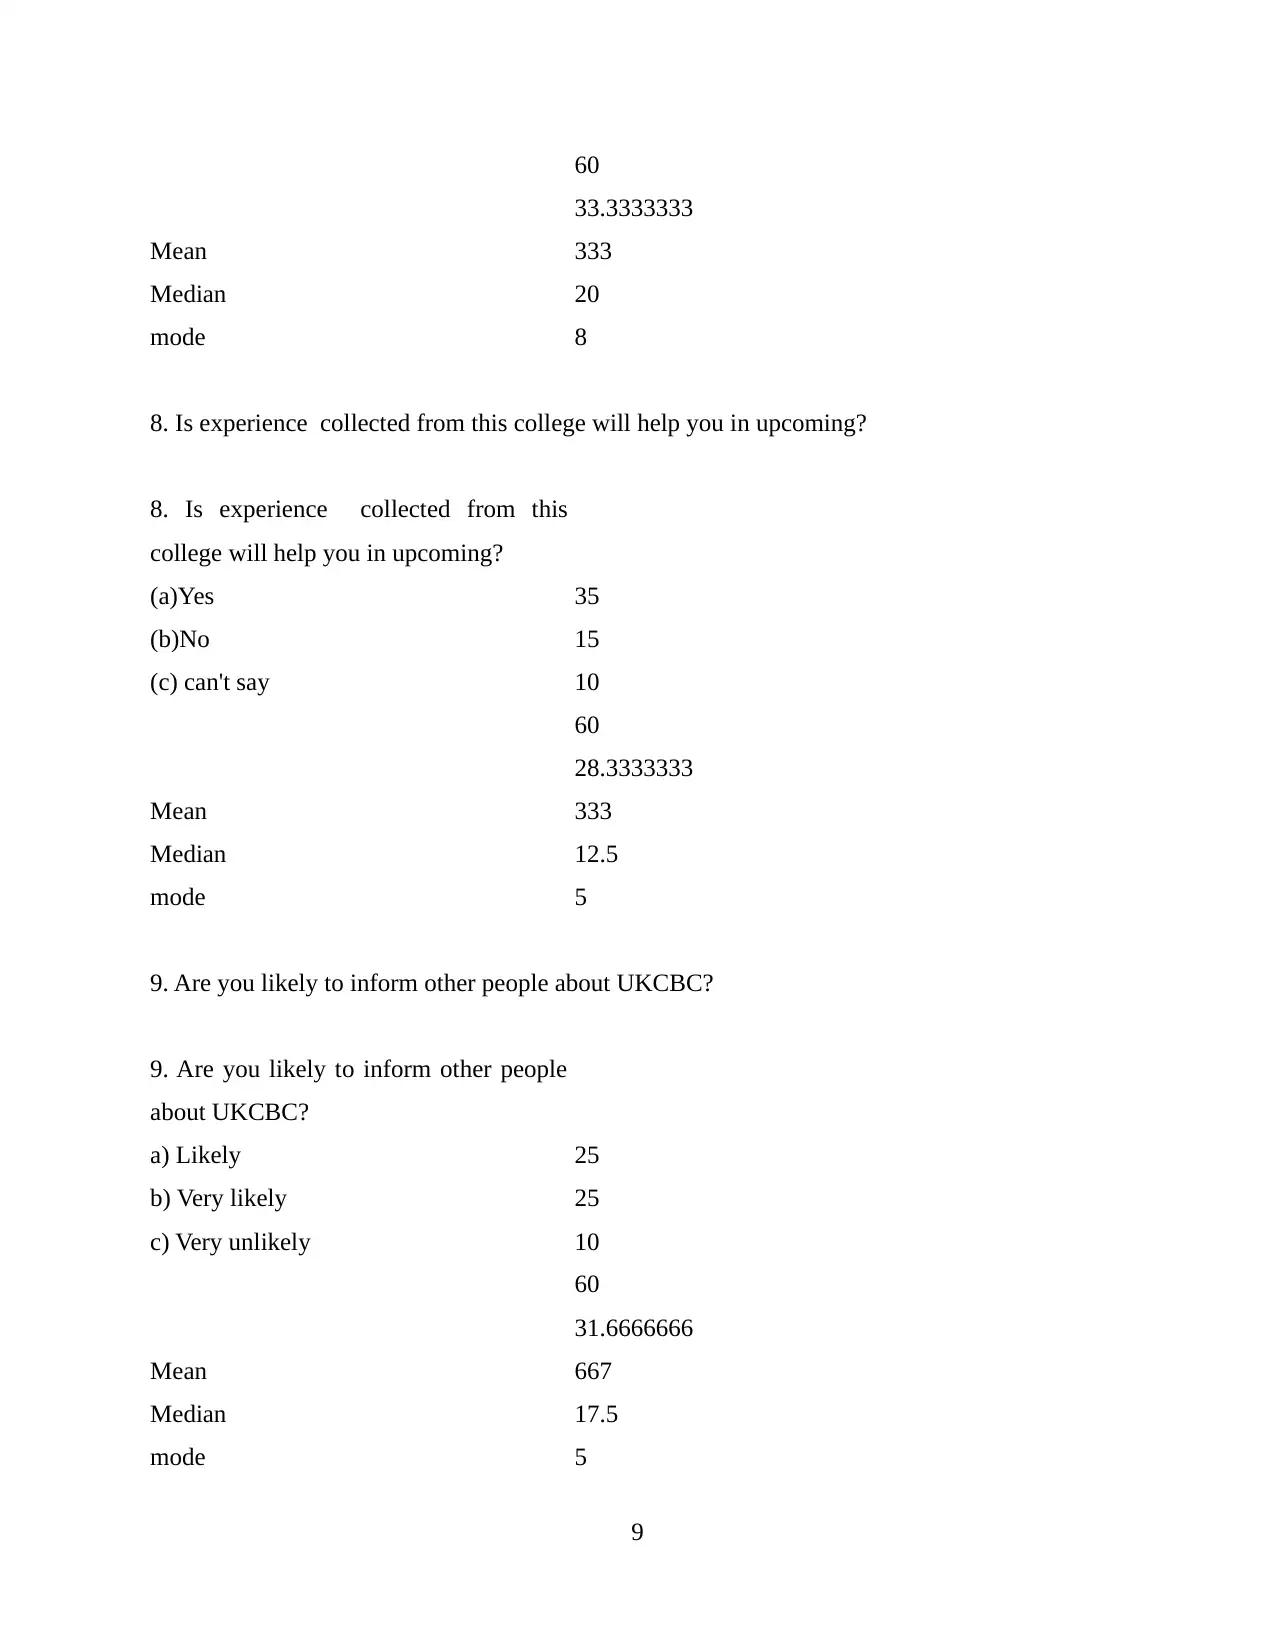
60
Mean
33.3333333
333
Median 20
mode 8
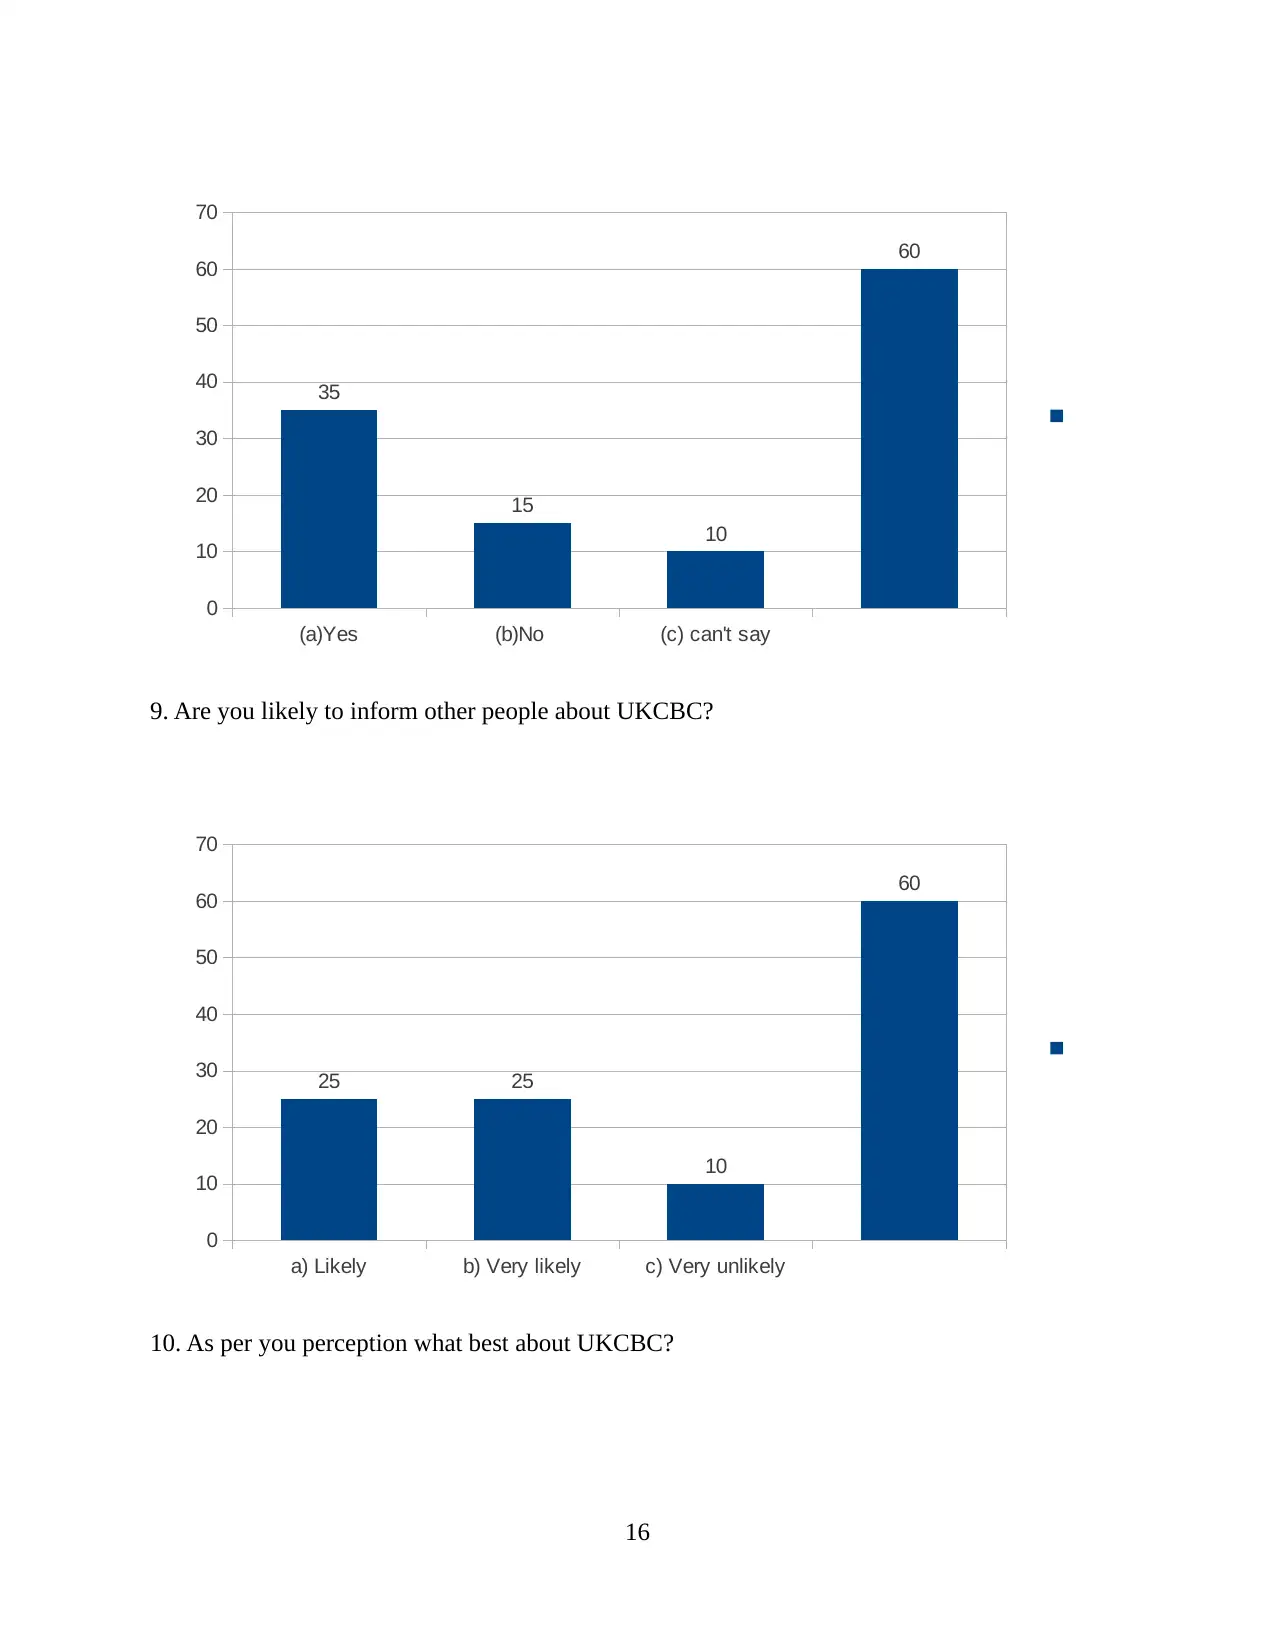
8. Is experience collected from this college will help you in upcoming?
8. Is experience collected from this
college will help you in upcoming?
(a)Yes 35
(b)No 15
(c) can't say 10
60
Mean
28.3333333
333
Median 12.5
mode 5
9. Are you likely to inform other people about UKCBC?
9. Are you likely to inform other people
about UKCBC?
a) Likely 25
b) Very likely 25
c) Very unlikely 10
60
Mean
31.6666666
667
Median 17.5
mode 5
9
Mean
33.3333333
333
Median 20
mode 8
8. Is experience collected from this college will help you in upcoming?
8. Is experience collected from this
college will help you in upcoming?
(a)Yes 35
(b)No 15
(c) can't say 10
60
Mean
28.3333333
333
Median 12.5
mode 5
9. Are you likely to inform other people about UKCBC?
9. Are you likely to inform other people
about UKCBC?
a) Likely 25
b) Very likely 25
c) Very unlikely 10
60
Mean
31.6666666
667
Median 17.5
mode 5
9
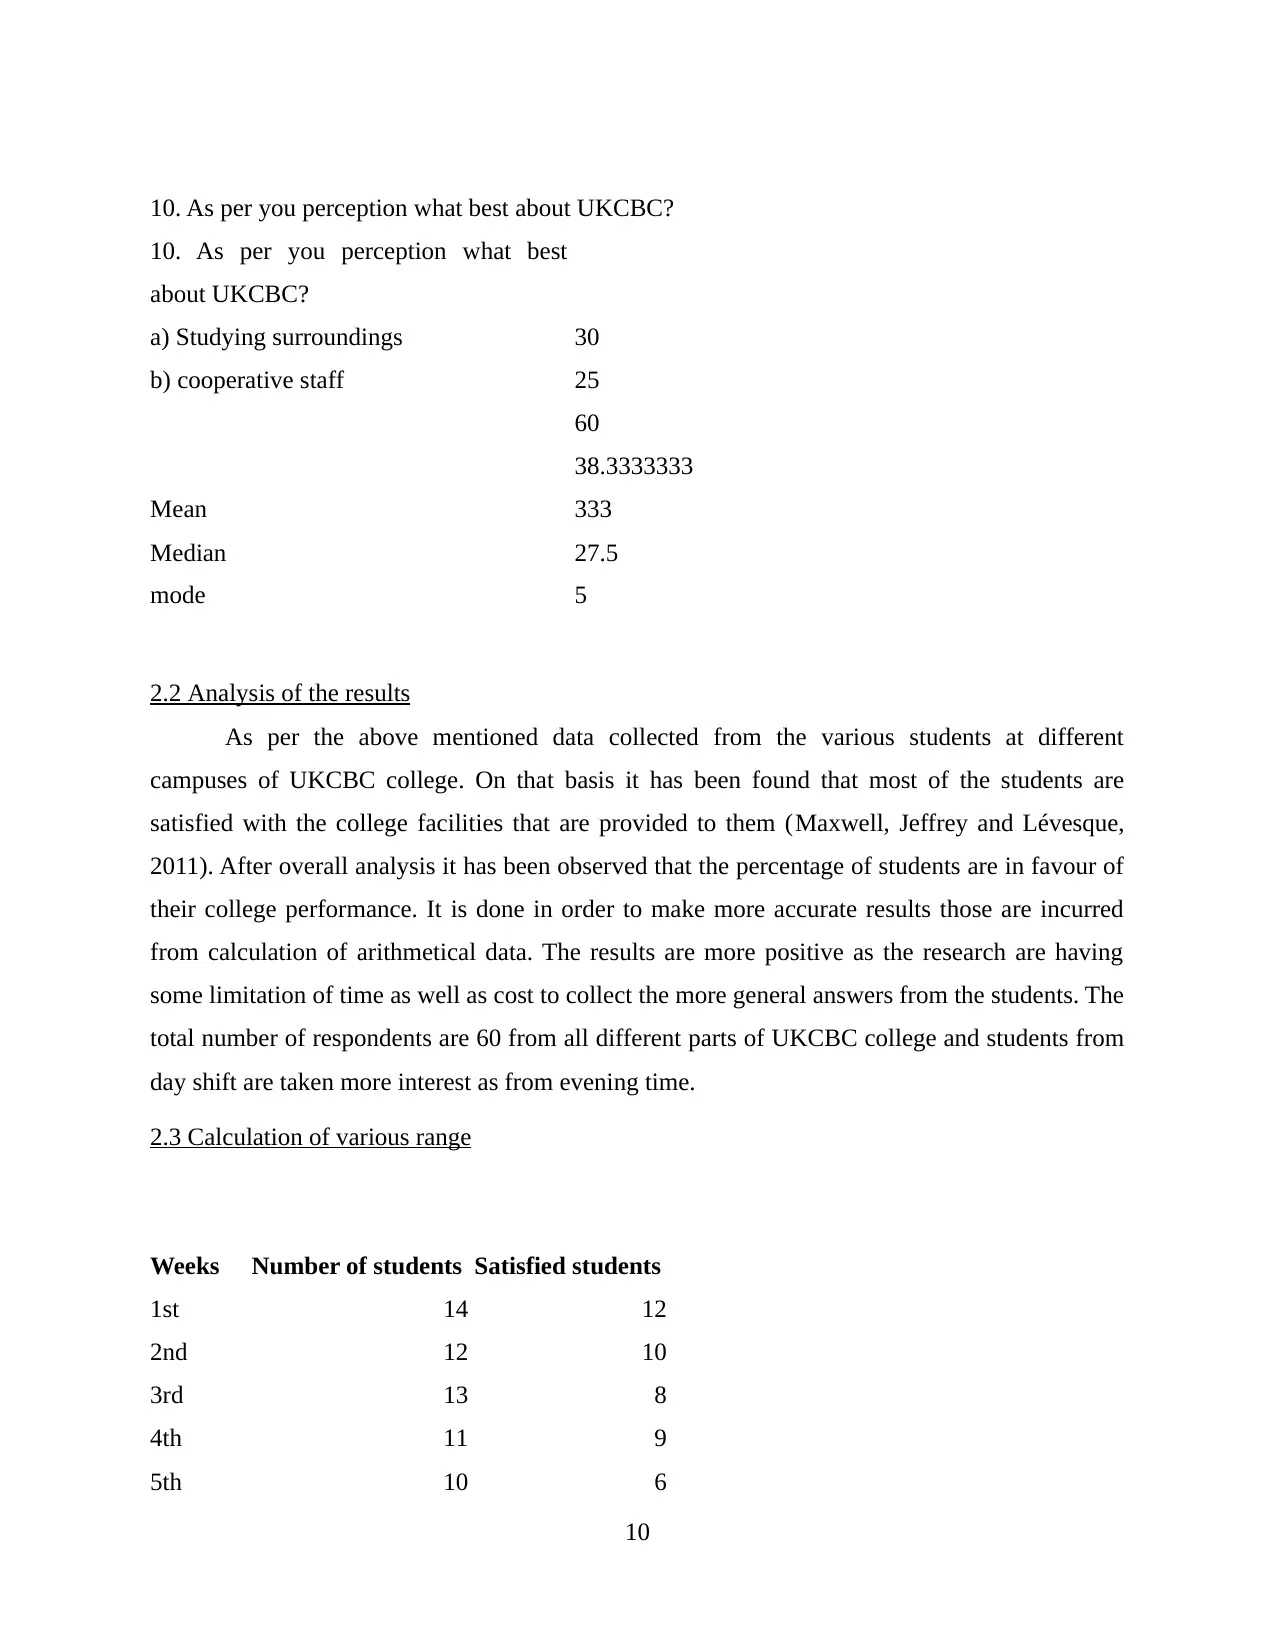
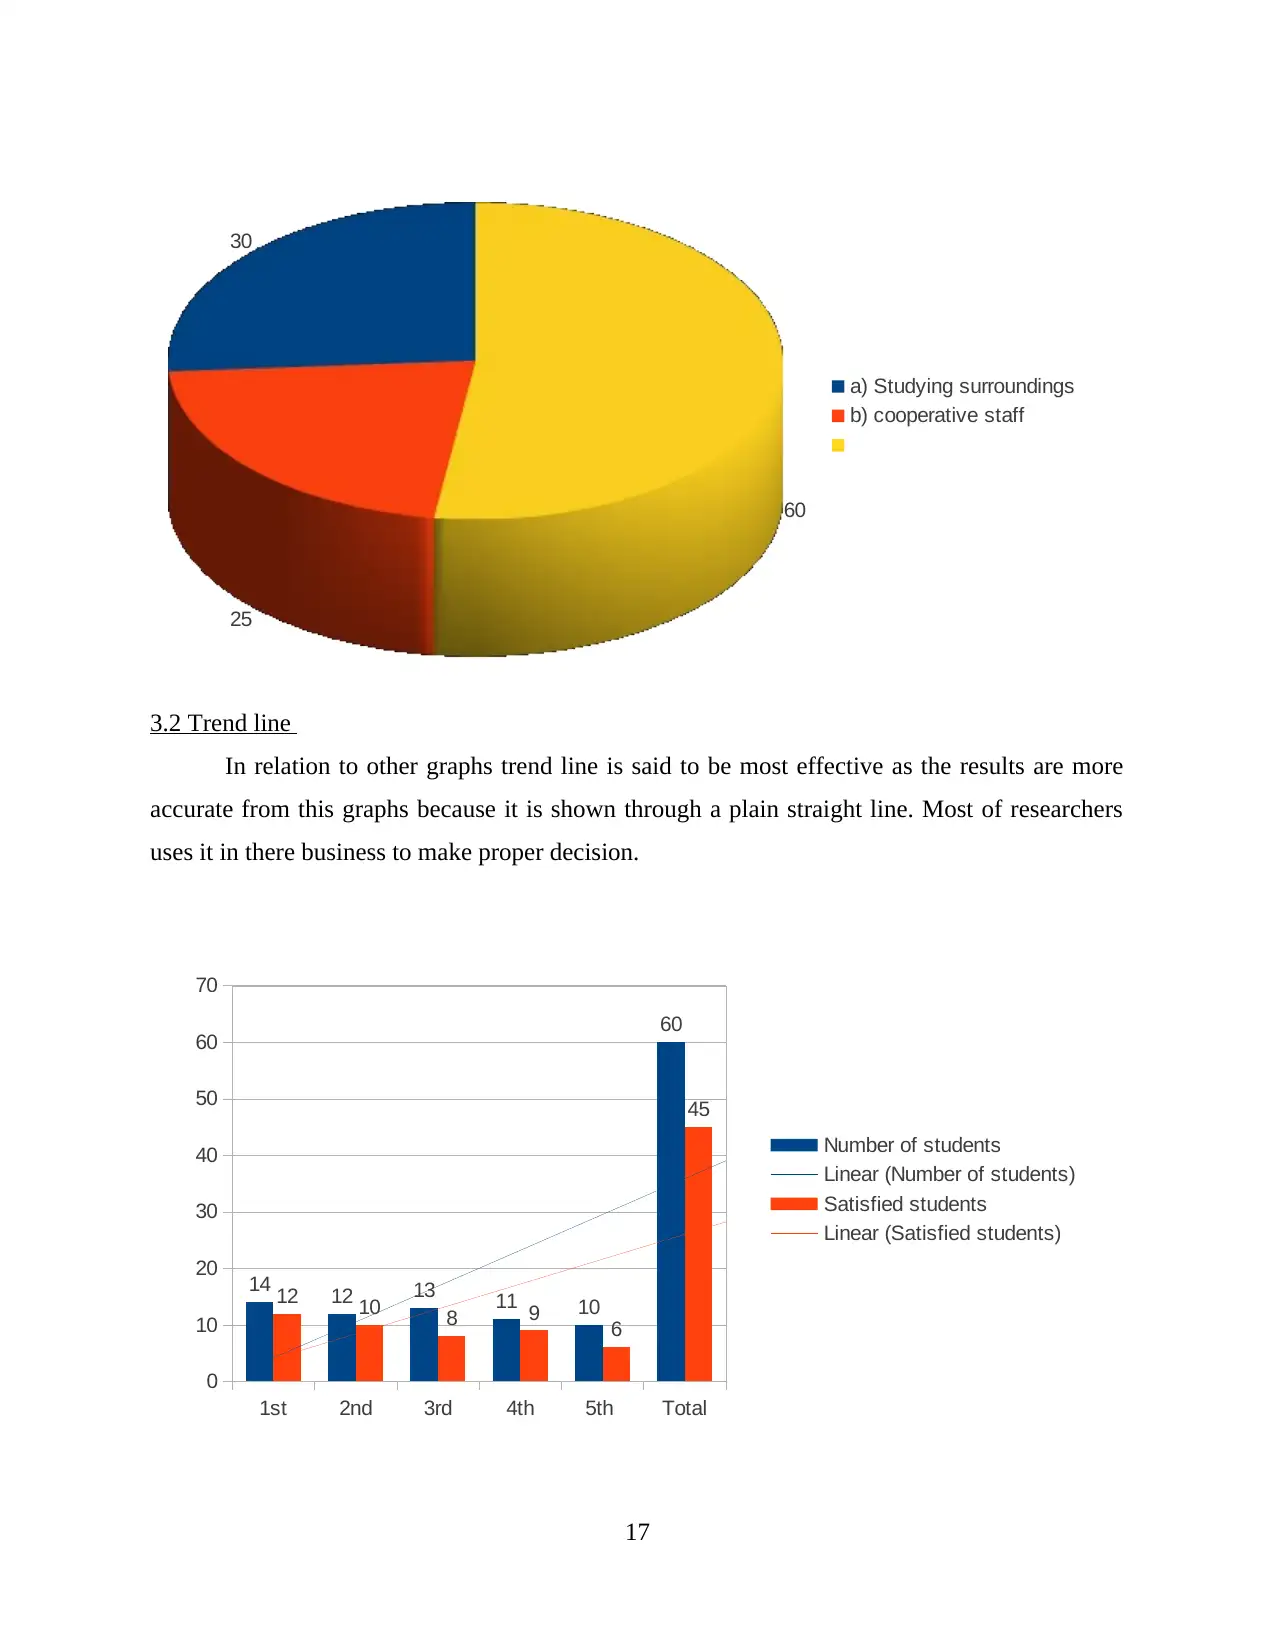
10. As per you perception what best about UKCBC?
10. As per you perception what best
about UKCBC?
a) Studying surroundings 30
b) cooperative staff 25
60
Mean
38.3333333
333
Median 27.5
mode 5
2.2 Analysis of the results
As per the above mentioned data collected from the various students at different
campuses of UKCBC college. On that basis it has been found that most of the students are
satisfied with the college facilities that are provided to them (Maxwell, Jeffrey and Lévesque,
2011). After overall analysis it has been observed that the percentage of students are in favour of
their college performance. It is done in order to make more accurate results those are incurred
from calculation of arithmetical data. The results are more positive as the research are having
some limitation of time as well as cost to collect the more general answers from the students. The
total number of respondents are 60 from all different parts of UKCBC college and students from
day shift are taken more interest as from evening time.
2.3 Calculation of various range
Weeks Number of students Satisfied students
1st 14 12
2nd 12 10
3rd 13 8
4th 11 9
5th 10 6
10
Total 60 45
RANGE
MINIM
UM
RANGE 6
MAXIM
UM
RANGE 12
COREL
ATION
COEFFI
CENT 0.7778174593
STAND
ARD
DEVIAT
ION 2.2360679775
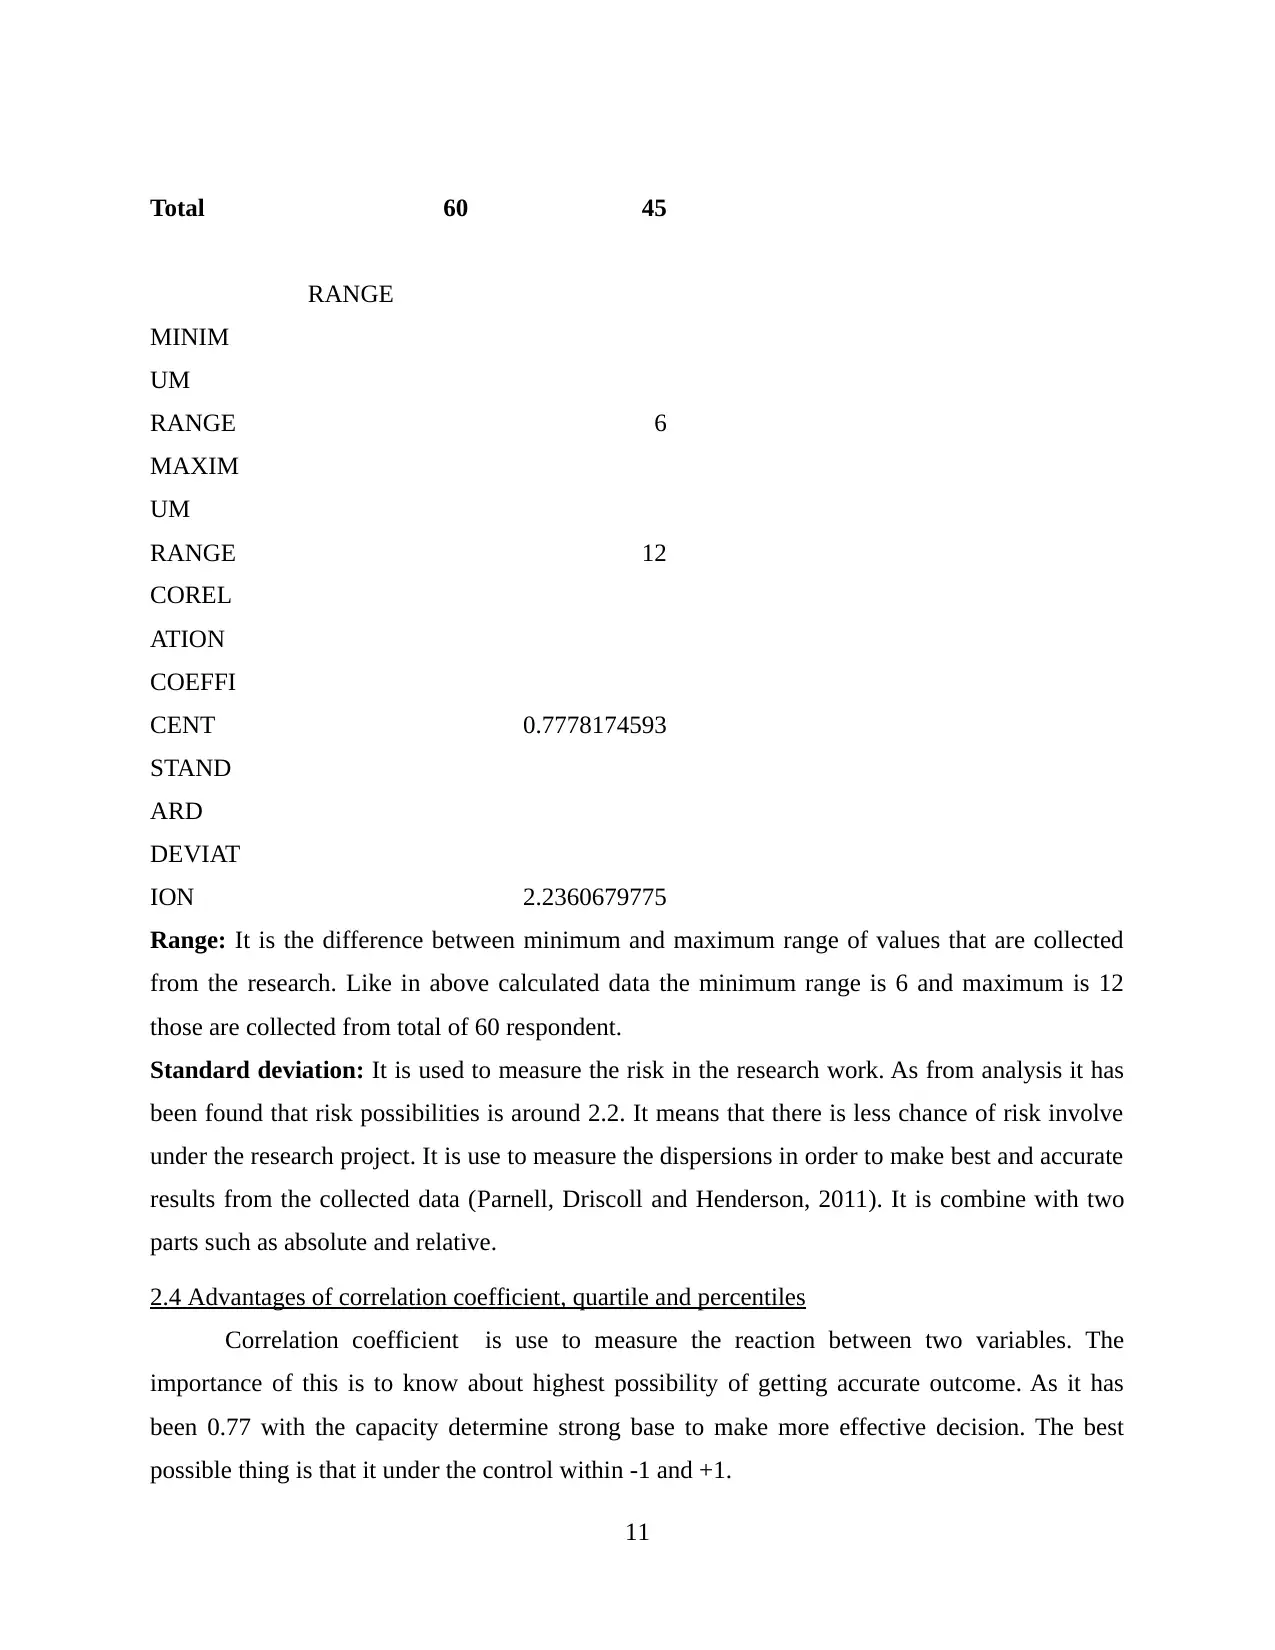
Range: It is the difference between minimum and maximum range of values that are collected
from the research. Like in above calculated data the minimum range is 6 and maximum is 12
those are collected from total of 60 respondent.
Standard deviation: It is used to measure the risk in the research work. As from analysis it has
been found that risk possibilities is around 2.2. It means that there is less chance of risk involve
under the research project. It is use to measure the dispersions in order to make best and accurate
results from the collected data (Parnell, Driscoll and Henderson, 2011). It is combine with two
parts such as absolute and relative.
2.4 Advantages of correlation coefficient, quartile and percentiles
Correlation coefficient is use to measure the reaction between two variables. The
importance of this is to know about highest possibility of getting accurate outcome. As it has
been 0.77 with the capacity determine strong base to make more effective decision. The best
possible thing is that it under the control within -1 and +1.
11
RANGE
MINIM
UM
RANGE 6
MAXIM
UM
RANGE 12
COREL
ATION
COEFFI
CENT 0.7778174593
STAND
ARD
DEVIAT
ION 2.2360679775
Range: It is the difference between minimum and maximum range of values that are collected
from the research. Like in above calculated data the minimum range is 6 and maximum is 12
those are collected from total of 60 respondent.
Standard deviation: It is used to measure the risk in the research work. As from analysis it has
been found that risk possibilities is around 2.2. It means that there is less chance of risk involve
under the research project. It is use to measure the dispersions in order to make best and accurate
results from the collected data (Parnell, Driscoll and Henderson, 2011). It is combine with two
parts such as absolute and relative.
2.4 Advantages of correlation coefficient, quartile and percentiles
Correlation coefficient is use to measure the reaction between two variables. The
importance of this is to know about highest possibility of getting accurate outcome. As it has
been 0.77 with the capacity determine strong base to make more effective decision. The best
possible thing is that it under the control within -1 and +1.
11
Paraphrase This Document
Need a fresh take? Get an instant paraphrase of this document with our AI Paraphraser
Quartile: In this situation the possibilities are divided into four sets. Degree of small
possibility is categorise under first quartile and in medium it comes as second and with highest it
comes to be last or final quartile (Pettigrew, 2014). From different range it has been the
possibility to get more correct results.
Percentile: It is that source of data collected which are indicated in percentage form. It
means if any results that are having 63 percentile the possible results is 63%. it is more
appropriate to make decision in order to take more accurate results because the data is arrange in
ascending order.
TASK 3
3.1 Data representation through using different charts and graphs
1.In which campus of UKCBC do you study?
a) Lords House campus
b) Wentworth House campus
c) Holborn campus
d) Park Royal campus
e) Cricklewood campus
0
2
4
6
8
10
12
14
16
12
14
9
12
13
2.What shift are you attending?
12
possibility is categorise under first quartile and in medium it comes as second and with highest it
comes to be last or final quartile (Pettigrew, 2014). From different range it has been the
possibility to get more correct results.
Percentile: It is that source of data collected which are indicated in percentage form. It
means if any results that are having 63 percentile the possible results is 63%. it is more
appropriate to make decision in order to take more accurate results because the data is arrange in
ascending order.
TASK 3
3.1 Data representation through using different charts and graphs
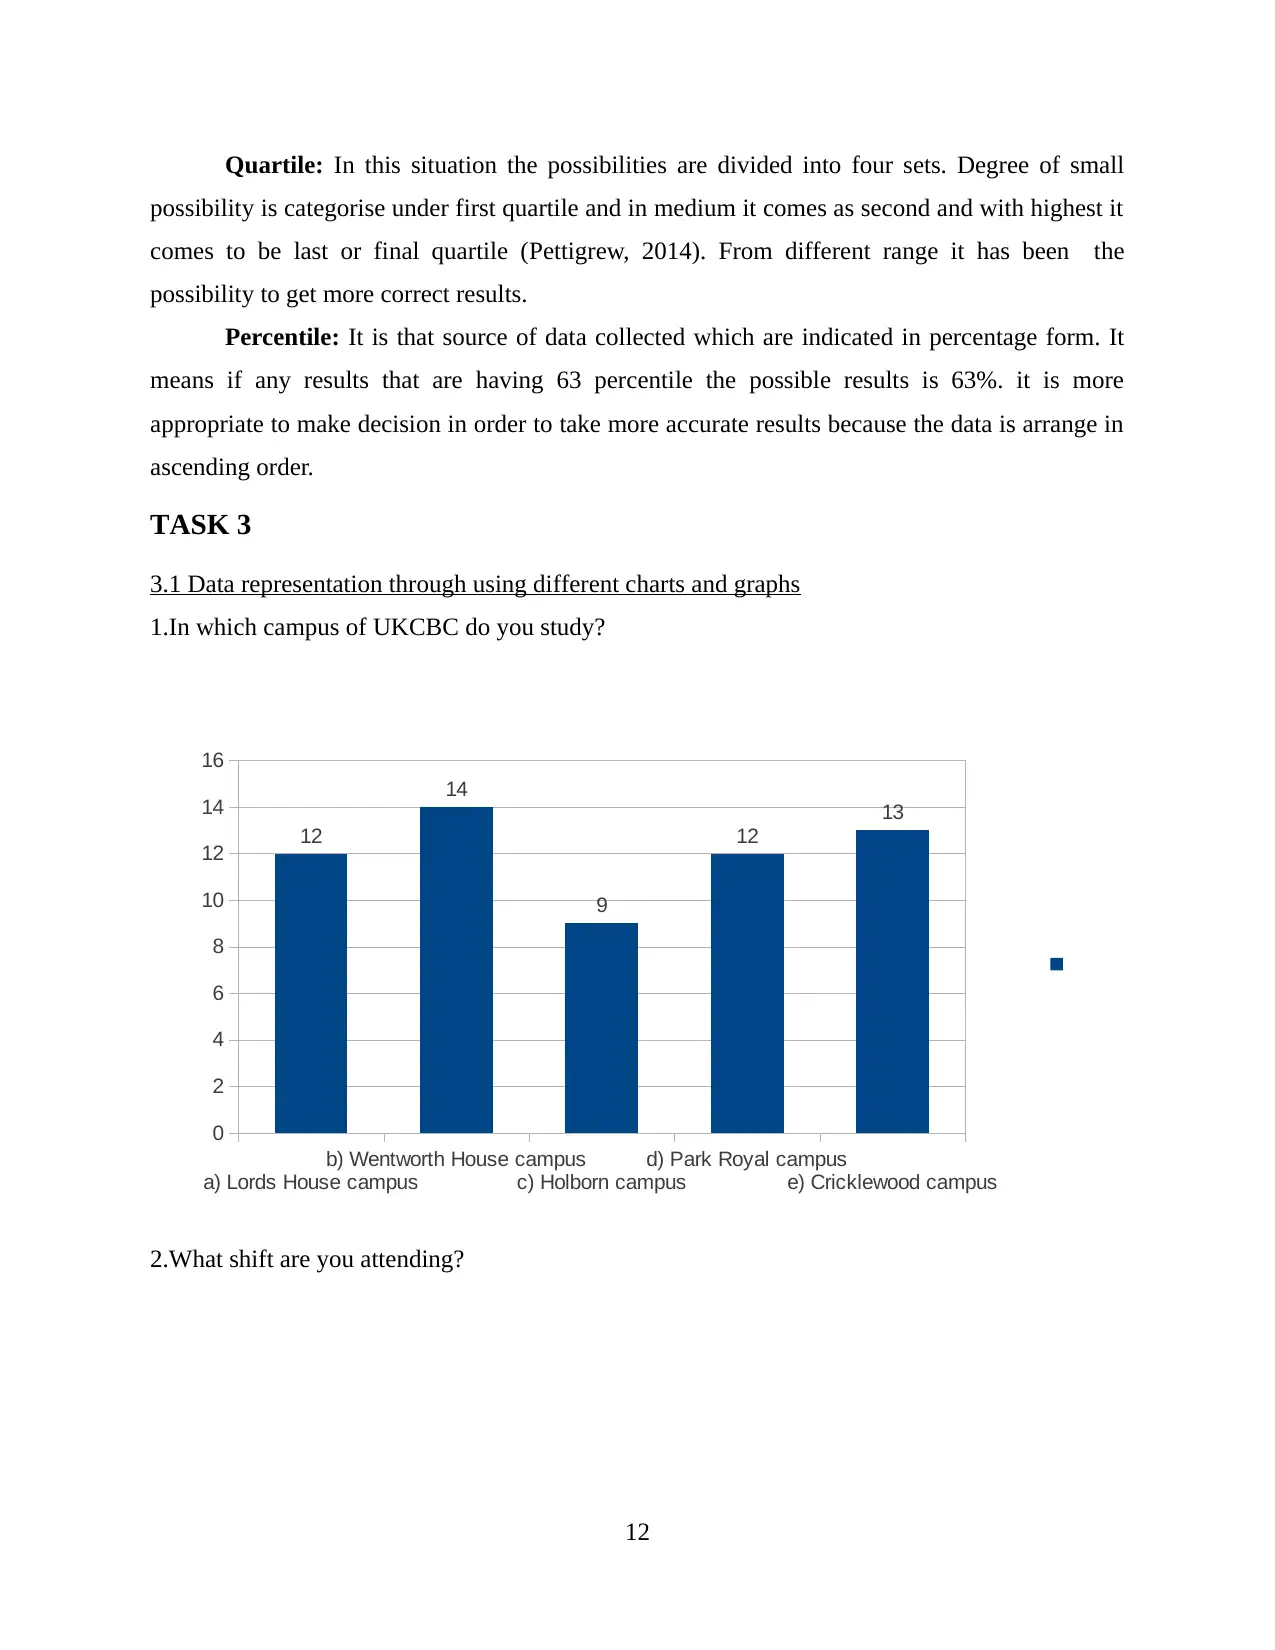
1.In which campus of UKCBC do you study?
a) Lords House campus
b) Wentworth House campus
c) Holborn campus
d) Park Royal campus
e) Cricklewood campus
0
2
4
6
8
10
12
14
16
12
14
9
12
13
2.What shift are you attending?
12
40
20
60
a) Day
b) Evening
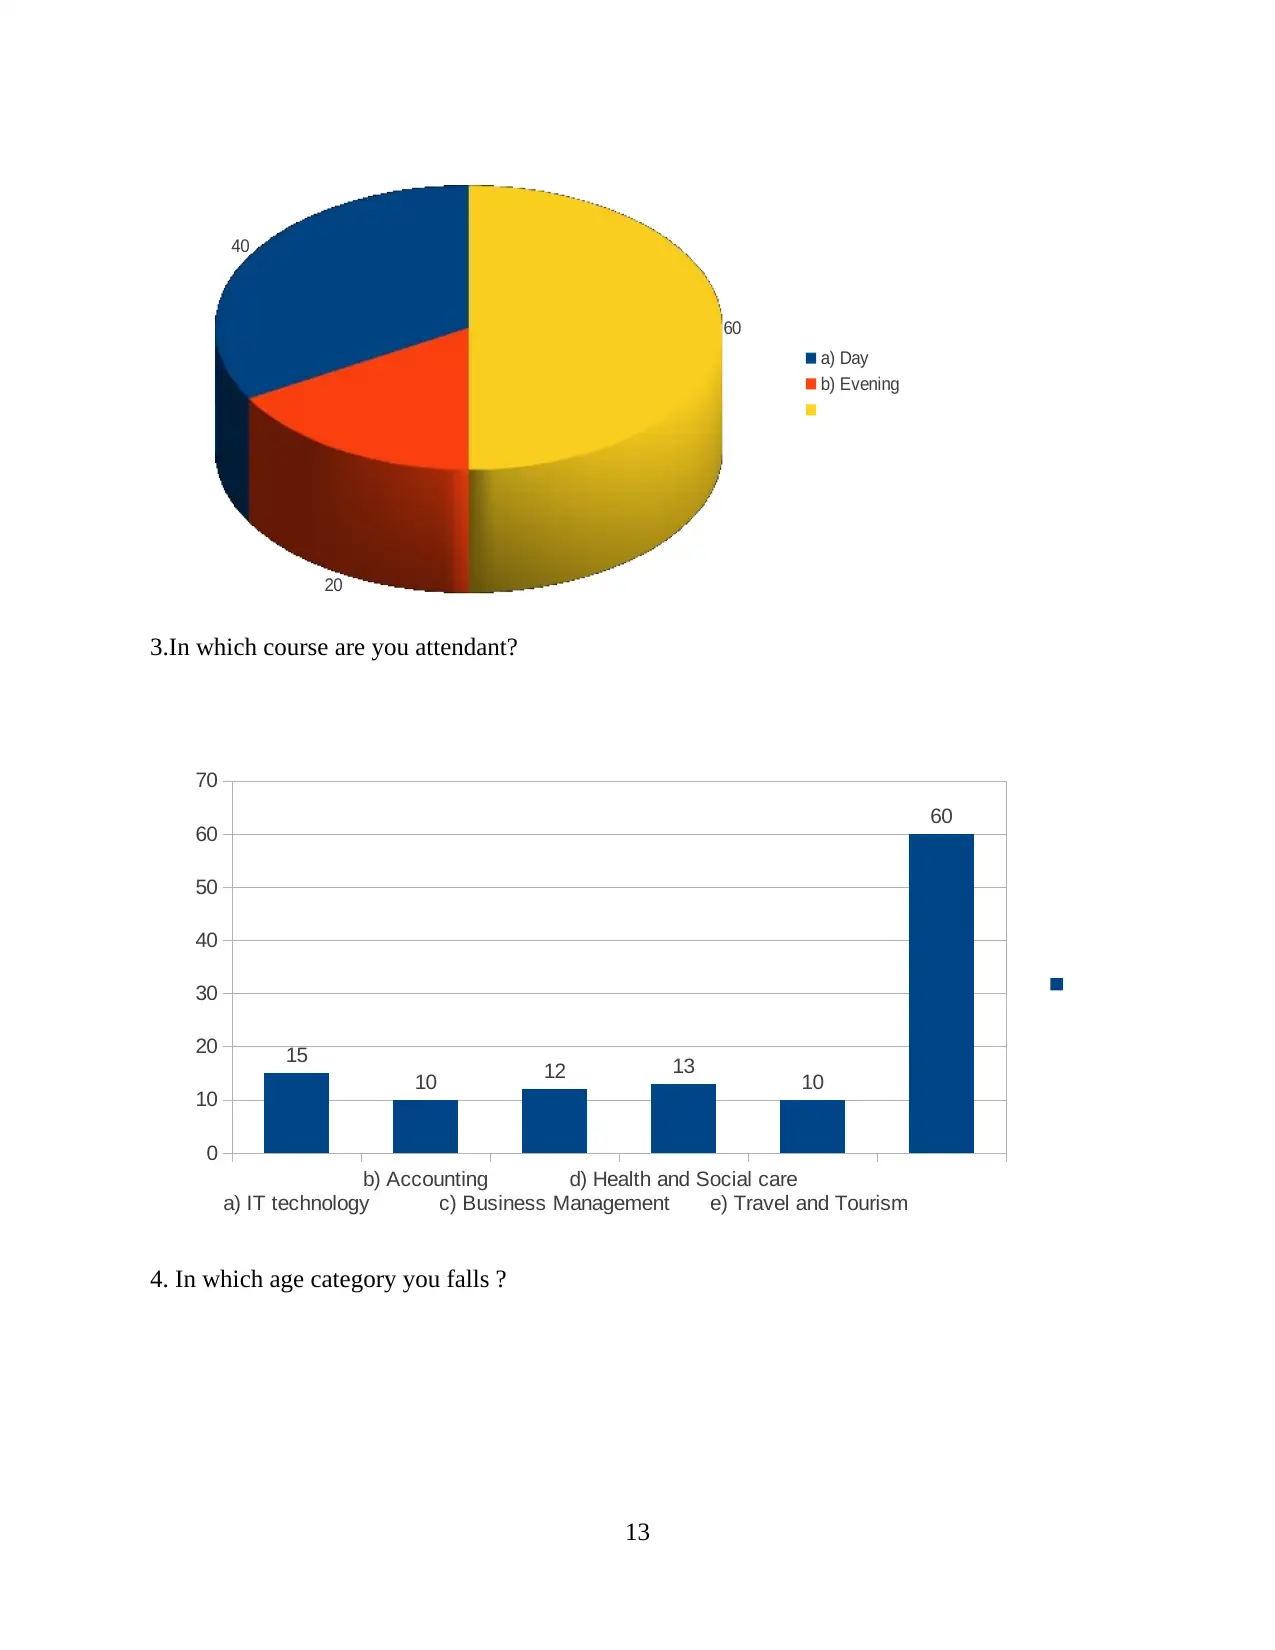
3.In which course are you attendant?
a) IT technology
b) Accounting
c) Business Management
d) Health and Social care
e) Travel and Tourism
0
10
20
30
40
50
60
70
15
10 12 13 10
60
4. In which age category you falls ?
13
20
60
a) Day
b) Evening
3.In which course are you attendant?
a) IT technology
b) Accounting
c) Business Management
d) Health and Social care
e) Travel and Tourism
0
10
20
30
40
50
60
70
15
10 12 13 10
60
4. In which age category you falls ?
13

a) 19 or younger b) 20-25 c) 25-30 d) 30-40 e) 40-50
0
10
20
30
40
50
60
70
18 20
12
5 5
60
5. Are you satisfied with the learning methods?
a) Very unsatisfied
b) Satisfied
c) Very satisfied
d) Slightly satisfied
e) Neutral
0
10
20
30
40
50
60
70
8
12
16 14
10
60
6. Are you satisfied with teaching facilities ? ( e.g. e-learning, library)
14
0
10
20
30
40
50
60
70
18 20
12
5 5
60
5. Are you satisfied with the learning methods?
a) Very unsatisfied
b) Satisfied
c) Very satisfied
d) Slightly satisfied
e) Neutral
0
10
20
30
40
50
60
70
8
12
16 14
10
60
6. Are you satisfied with teaching facilities ? ( e.g. e-learning, library)
14
Secure Best Marks with AI Grader
Need help grading? Try our AI Grader for instant feedback on your assignments.
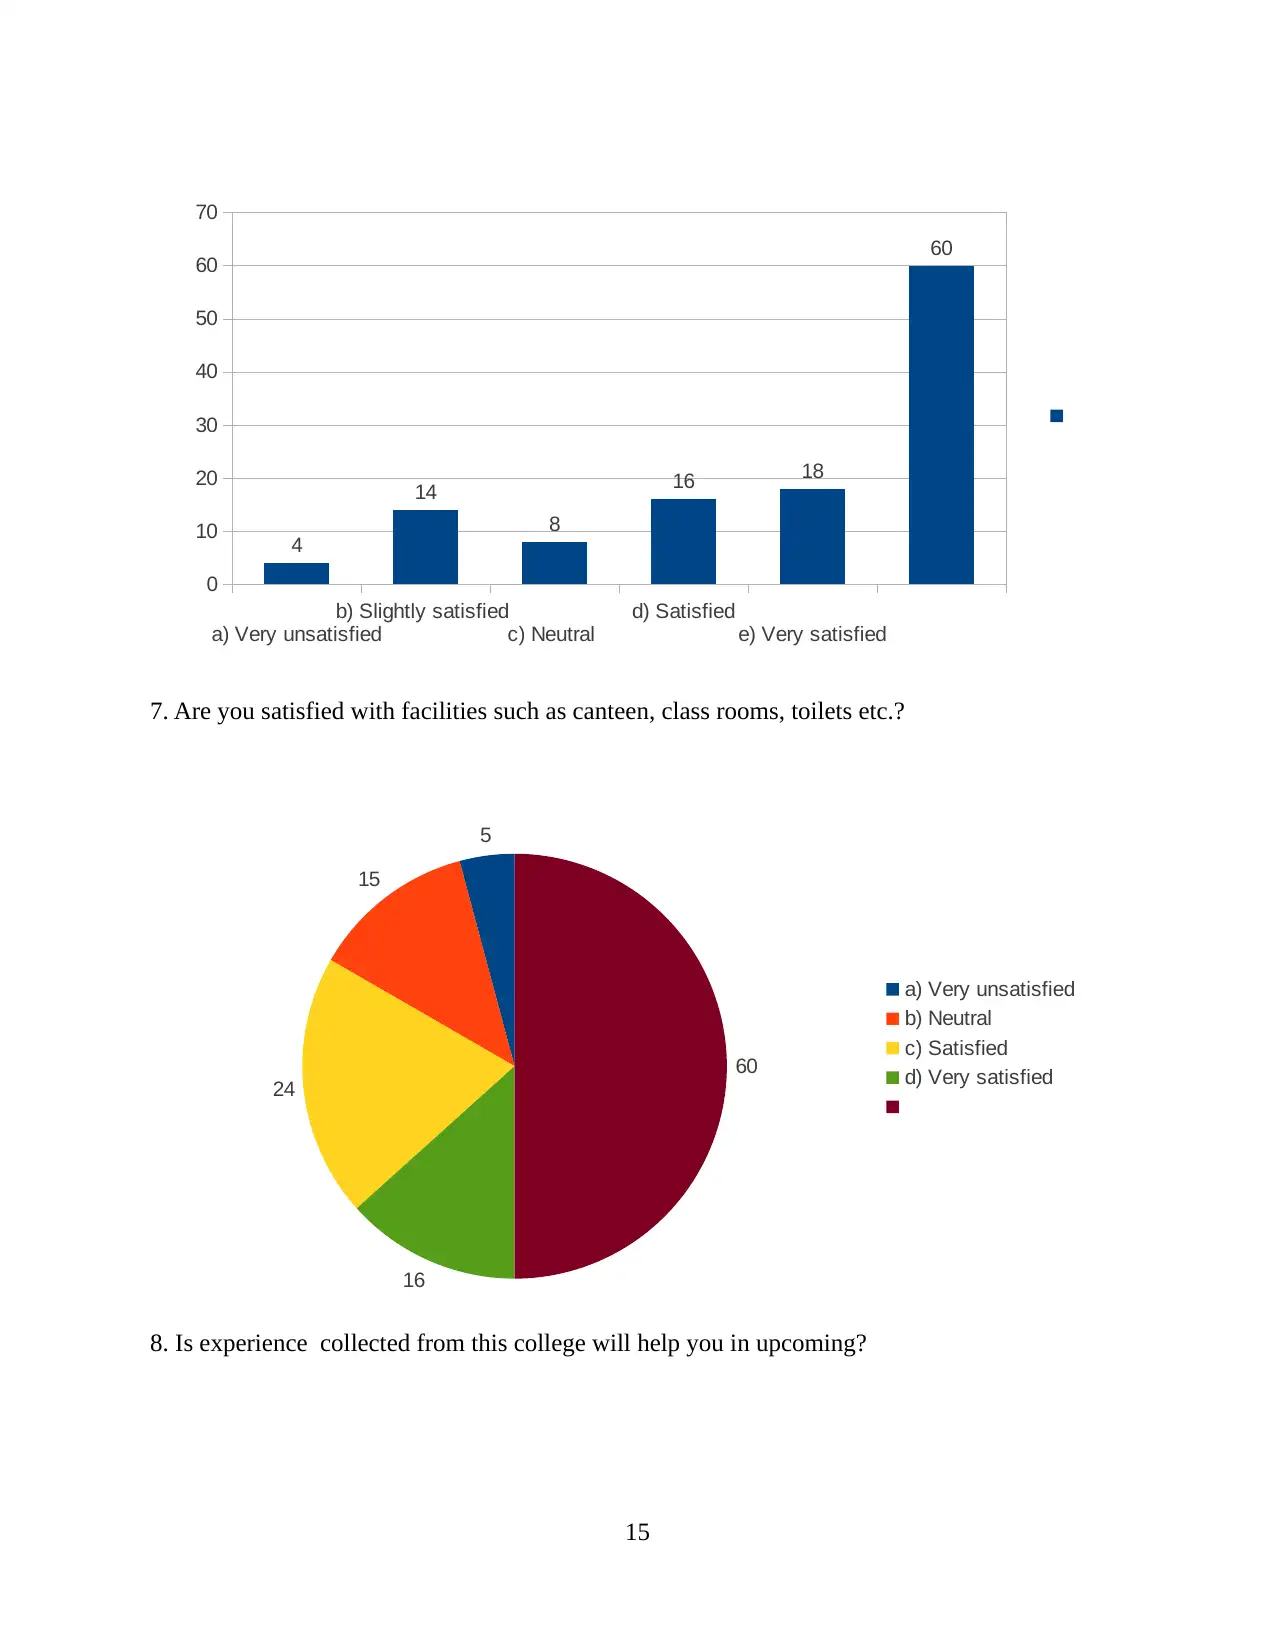
a) Very unsatisfied
b) Slightly satisfied
c) Neutral
d) Satisfied
e) Very satisfied
0
10
20
30
40
50
60
70
4
14
8
16 18
60
7. Are you satisfied with facilities such as canteen, class rooms, toilets etc.?
5
15
24
16
60
a) Very unsatisfied
b) Neutral
c) Satisfied
d) Very satisfied
8. Is experience collected from this college will help you in upcoming?
15
(a)Yes (b)No (c) can't say
0
10
20
30
40
50
60
70
35
15
10
60
9. Are you likely to inform other people about UKCBC?
a) Likely b) Very likely c) Very unlikely
0
10
20
30
40
50
60
70
25 25
10
60
10. As per you perception what best about UKCBC?
16
0
10
20
30
40
50
60
70
35
15
10
60
9. Are you likely to inform other people about UKCBC?
a) Likely b) Very likely c) Very unlikely
0
10
20
30
40
50
60
70
25 25
10
60
10. As per you perception what best about UKCBC?
16
30
25
60
a) Studying surroundings
b) cooperative staff
3.2 Trend line
In relation to other graphs trend line is said to be most effective as the results are more
accurate from this graphs because it is shown through a plain straight line. Most of researchers
uses it in there business to make proper decision.
1st 2nd 3rd 4th 5th Total
0
10
20
30
40
50
60
70
14 12 13 11 10
60
12 10 8 9 6
45
Number of students
Linear (Number of students)
Satisfied students
Linear (Satisfied students)
17
Paraphrase This Document
Need a fresh take? Get an instant paraphrase of this document with our AI Paraphraser
From above collected data from 60 respondents a trend line is being drawn. Out of 60
students 45 of them are highly satisfied and provided more accurate results. The research was
conduct from 5 weeks and in different week several number of respondents have provided their
own reviews that are in the favour of UKCBC college (Solomon, 2014). The most number of
students are collected in 1st and 2rd week as because they are interested enough to see some new
changes can be required made after this research work.
3.3 Covered in PPT
3.4 Formal report
FORMAL REPORT
To QAA committee
11th August 2017
The research project is designed in order to get relevant fact and reviews from student that
what there expectation and satisfaction from UKCBC college. The purpose of this research is to
collect effective feedback and suggestion through organising a survey with filling questionnaire
and personal interview from selected group of students. As total number of respondents are
selected was only 60 from various campuses of UKCBC colleges. The most of the selected group
has provided accurate and appropriate answers and has being drawn a complete reaction regarding
there view that they are satisfied with the performance of the college. Under this research sum of
the sampling framework is being design in order to divide people into different groups. The type of
learning and extra curricular activities organises by the college are attracting the intention of
outside students as well as those who are in current location. The overall results are positive
because the primary and secondary source are utilised in more effective manner. So the
environment are healthy and superior to learn and groom their personalities.
TASK 4
4.1 Different tools use in framing of project
There are various tools those are use by an organisation at various level which are
organise through applying certain effective decision that are based on higher authority as they are
18
using sum kind of system to manage and control their team as well as their project (Tzeng and
Huang, 2011). These are:
MIS: It is said to be management information system that is used by top management in
relation to control and provide direction to their goal ans objectives. It is done for all
because to get more quick results (MIS - Executive Support System. 2017).
DSS: This system is use at strategic level of an organisation because most of the
important decisions are taken in order to achieve the goal in more right ways.
ESS: Executives support system is a kind of system which is use by senior department to
take decision at internal and external levels to utilise the available resources (Zsambok,
2014).
TPS: It is said to be transaction processing system which issued at operational level in
which more transaction are done in a single and all those can be manage by the manager
with using this system.
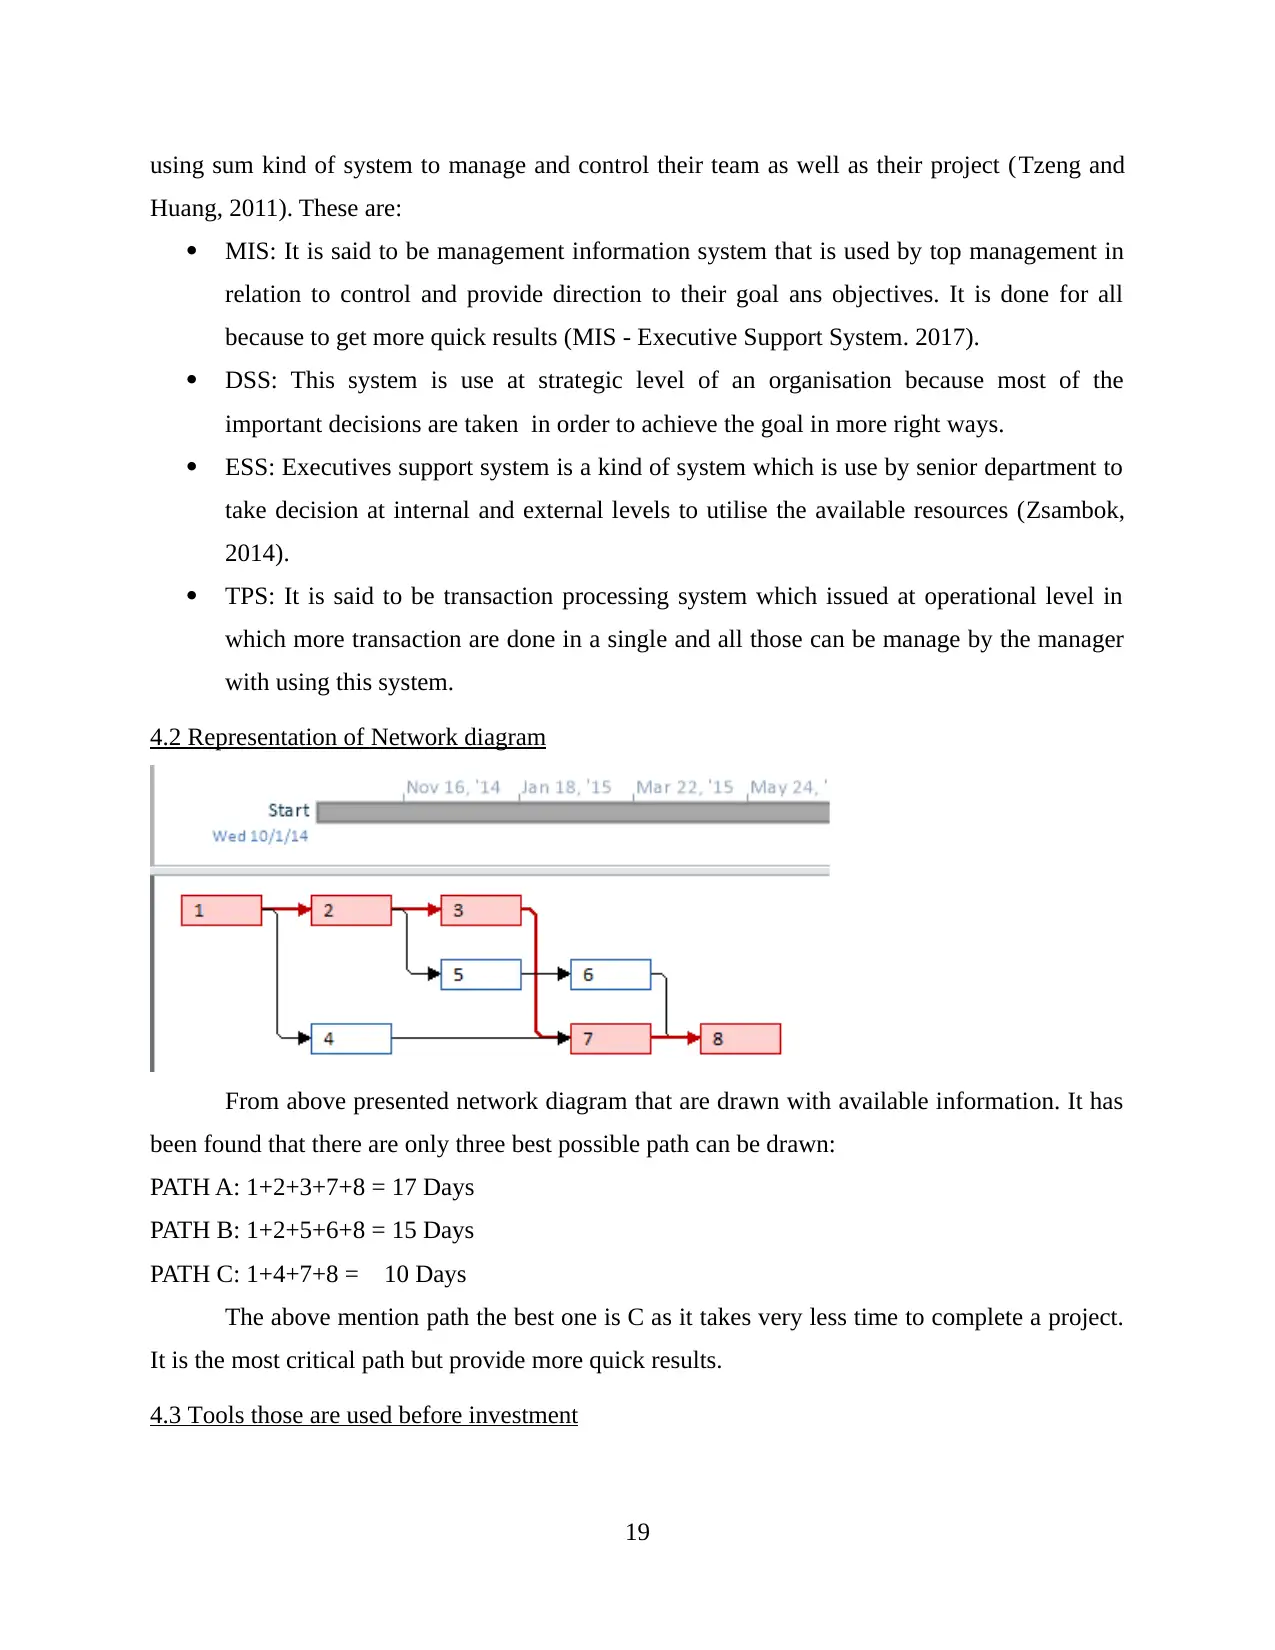
4.2 Representation of Network diagram
From above presented network diagram that are drawn with available information. It has
been found that there are only three best possible path can be drawn:
PATH A: 1+2+3+7+8 = 17 Days
PATH B: 1+2+5+6+8 = 15 Days
PATH C: 1+4+7+8 = 10 Days
The above mention path the best one is C as it takes very less time to complete a project.
It is the most critical path but provide more quick results.
4.3 Tools those are used before investment
19
Huang, 2011). These are:
MIS: It is said to be management information system that is used by top management in
relation to control and provide direction to their goal ans objectives. It is done for all
because to get more quick results (MIS - Executive Support System. 2017).
DSS: This system is use at strategic level of an organisation because most of the
important decisions are taken in order to achieve the goal in more right ways.
ESS: Executives support system is a kind of system which is use by senior department to
take decision at internal and external levels to utilise the available resources (Zsambok,
2014).
TPS: It is said to be transaction processing system which issued at operational level in
which more transaction are done in a single and all those can be manage by the manager
with using this system.
4.2 Representation of Network diagram
From above presented network diagram that are drawn with available information. It has
been found that there are only three best possible path can be drawn:
PATH A: 1+2+3+7+8 = 17 Days
PATH B: 1+2+5+6+8 = 15 Days
PATH C: 1+4+7+8 = 10 Days
The above mention path the best one is C as it takes very less time to complete a project.
It is the most critical path but provide more quick results.
4.3 Tools those are used before investment
19
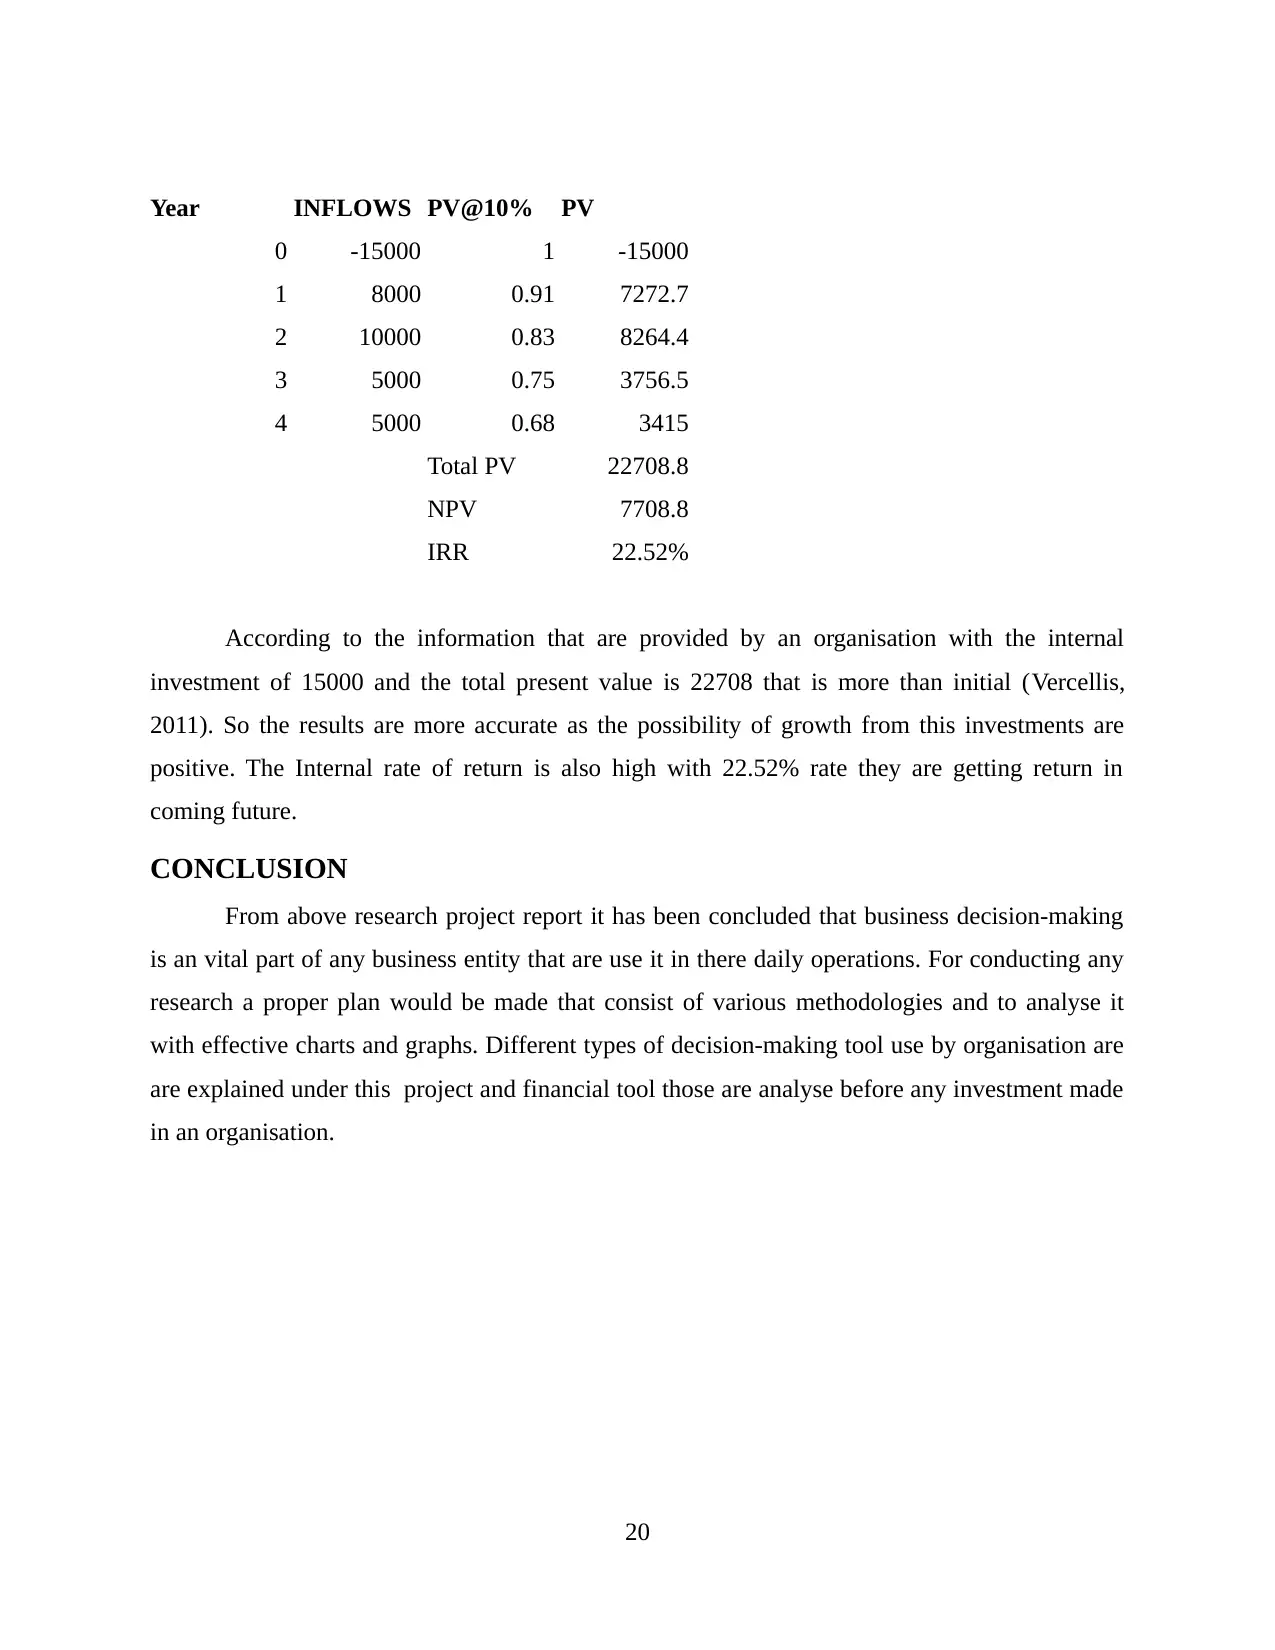
Year INFLOWS PV@10% PV
0 -15000 1 -15000
1 8000 0.91 7272.7
2 10000 0.83 8264.4
3 5000 0.75 3756.5
4 5000 0.68 3415
Total PV 22708.8
NPV 7708.8
IRR 22.52%
According to the information that are provided by an organisation with the internal
investment of 15000 and the total present value is 22708 that is more than initial (Vercellis,
2011). So the results are more accurate as the possibility of growth from this investments are
positive. The Internal rate of return is also high with 22.52% rate they are getting return in
coming future.
CONCLUSION
From above research project report it has been concluded that business decision-making
is an vital part of any business entity that are use it in there daily operations. For conducting any
research a proper plan would be made that consist of various methodologies and to analyse it
with effective charts and graphs. Different types of decision-making tool use by organisation are
are explained under this project and financial tool those are analyse before any investment made
in an organisation.
20
1 out of 22
Related Documents


Your All-in-One AI-Powered Toolkit for Academic Success.
+13062052269
info@desklib.com
Available 24*7 on WhatsApp / Email
![[object Object]](/_next/static/media/star-bottom.7253800d.svg)
Unlock your academic potential
© 2024 | Zucol Services PVT LTD | All rights reserved.