Market Research for London Expansion
VerifiedAdded on 2020/06/04
|26
|4705
|74
AI Summary
This assignment focuses on the crucial aspect of market research when a company plans to expand into a new city like London, UK. It emphasizes the need for comprehensive market knowledge and relevant data sources. The report highlights various financial tools and software that can provide statistical insights. Furthermore, it suggests utilizing questionnaires as a valuable method for conducting thorough market research.
Contribute Materials
Your contribution can guide someone’s learning journey. Share your
documents today.

BUSINESS
DECISION MAKING
DECISION MAKING
Secure Best Marks with AI Grader
Need help grading? Try our AI Grader for instant feedback on your assignments.
TABLE OF CONTENTS
INTRODUCTION...........................................................................................................................1
TASK 1............................................................................................................................................1
1.1 A plan for the collection of primary and secondary data.................................................1
1.2 Survey methodology & sampling frame...........................................................................2
1.3 Questionnaire....................................................................................................................3
2.1 Collection of data and summarisation of collected data...................................................4
2.2 Conclusion and recommendations....................................................................................7
2.3 Standard deviation, quartile, percentiles and the correlation coefficient.........................8
2.4 Conclusion through calculations....................................................................................11
TASK 2..........................................................................................................................................11
3.1 & 3.2 Graphs and a valid conclusions based on the information derived with trend line11
3.3 Business Presentation.....................................................................................................18
3.4 A formal Business Report to disseminate information effectively which include.........18
TASK 3..........................................................................................................................................19
4.1 Information processing tools..........................................................................................19
4.2 Gantt chart and critical path for project plan..................................................................19
4.3 Financial tools for decision making...............................................................................21
CONCLUSION..............................................................................................................................21
REFERENCES..............................................................................................................................23
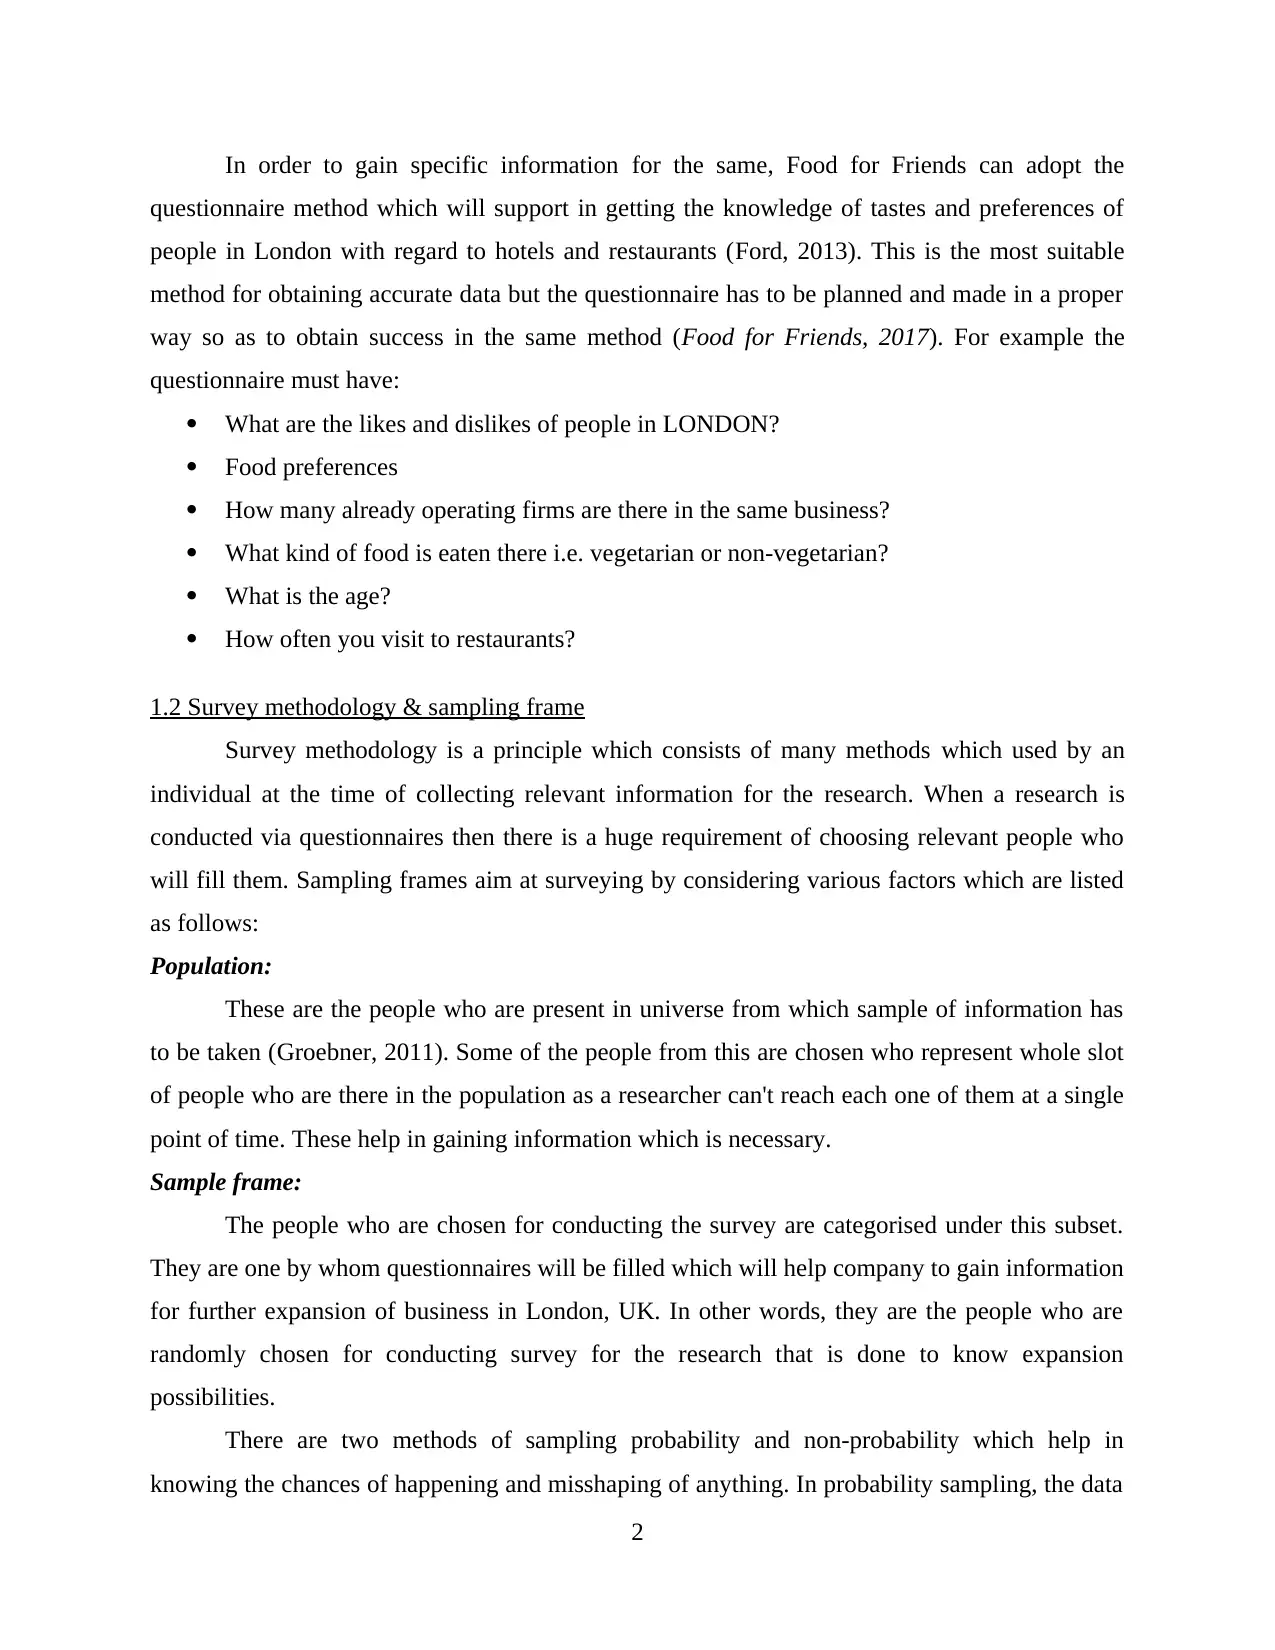
INTRODUCTION
Business decision-making is not about choosing the right decision but it is making right
decision by analysing yearly report of business. There is no consistency in the operations of
business which are there while any plan is implemented in an organisation. When a company
have has take any decision regarding its growth and development then there is a need for analysis
which can be theoretical or practical. Interpretation of data get done by using various number of
sources like graphs, articles. A proper data interpretation will lead to aid in taking appropriate
decision for business which support in long term. This report is a complete analysis of restaurant,
Food for Friends so as to take business decision in opening the another restaurant in London by
conducting primary and secondary research with methodologies to support the study.
TASK 1
1.1 A plan for the collection of primary and secondary data
In order to collect information, there are many ways which can be utilised for the same so
as to have proper collection. These ways help in the ascertainment of proper results so as to gain
relevant information on which researcher conduct appropriate investigation in relation to collect
data (Ferrell, 2015). As Food for Friends is aiming to expand its business in the areas of London,
UK, in that case, it has to collect data from population which is present there so as to know the
tastes and preferences. There are several methods which can be implemented for taking
beneficial decision in order to get data and these are explained as below: Questionnaire: Company can utilize this method by forming formal questions which are
summarised on a sheet of paper representing information which has to be collected by the
people as they answer them. In order to have effectiveness in this method, questionnaire
must be prepared properly so that data can be collected properly according to the needs. Feedback Forms: These are forms which are prepared in such a manner that people give
their views with regard to services which are provided to them. This helps in knowing
whether the customers like services of restaurant or not.
Personal Observation: There are many experts like auditors and researchers which can
be appointed for observing the market and trends personally so as to gain proper
information.
1
In order to gain specific information for the same, Food for Friends can adopt the
questionnaire method which will support in getting the knowledge of tastes and preferences of
people in London with regard to hotels and restaurants (Ford, 2013). This is the most suitable
method for obtaining accurate data but the questionnaire has to be planned and made in a proper
way so as to obtain success in the same method (Food for Friends, 2017). For example the
questionnaire must have:
What are the likes and dislikes of people in LONDON?
Food preferences
How many already operating firms are there in the same business?
What kind of food is eaten there i.e. vegetarian or non-vegetarian?
What is the age?
How often you visit to restaurants?
1.2 Survey methodology & sampling frame
Survey methodology is a principle which consists of many methods which used by an
individual at the time of collecting relevant information for the research. When a research is
conducted via questionnaires then there is a huge requirement of choosing relevant people who
will fill them. Sampling frames aim at surveying by considering various factors which are listed
as follows:
Population:
These are the people who are present in universe from which sample of information has
to be taken (Groebner, 2011). Some of the people from this are chosen who represent whole slot
of people who are there in the population as a researcher can't reach each one of them at a single
point of time. These help in gaining information which is necessary.
Sample frame:
The people who are chosen for conducting the survey are categorised under this subset.
They are one by whom questionnaires will be filled which will help company to gain information
for further expansion of business in London, UK. In other words, they are the people who are
randomly chosen for conducting survey for the research that is done to know expansion
possibilities.
There are two methods of sampling probability and non-probability which help in
knowing the chances of happening and misshaping of anything. In probability sampling, the data
2
Secure Best Marks with AI Grader
Need help grading? Try our AI Grader for instant feedback on your assignments.
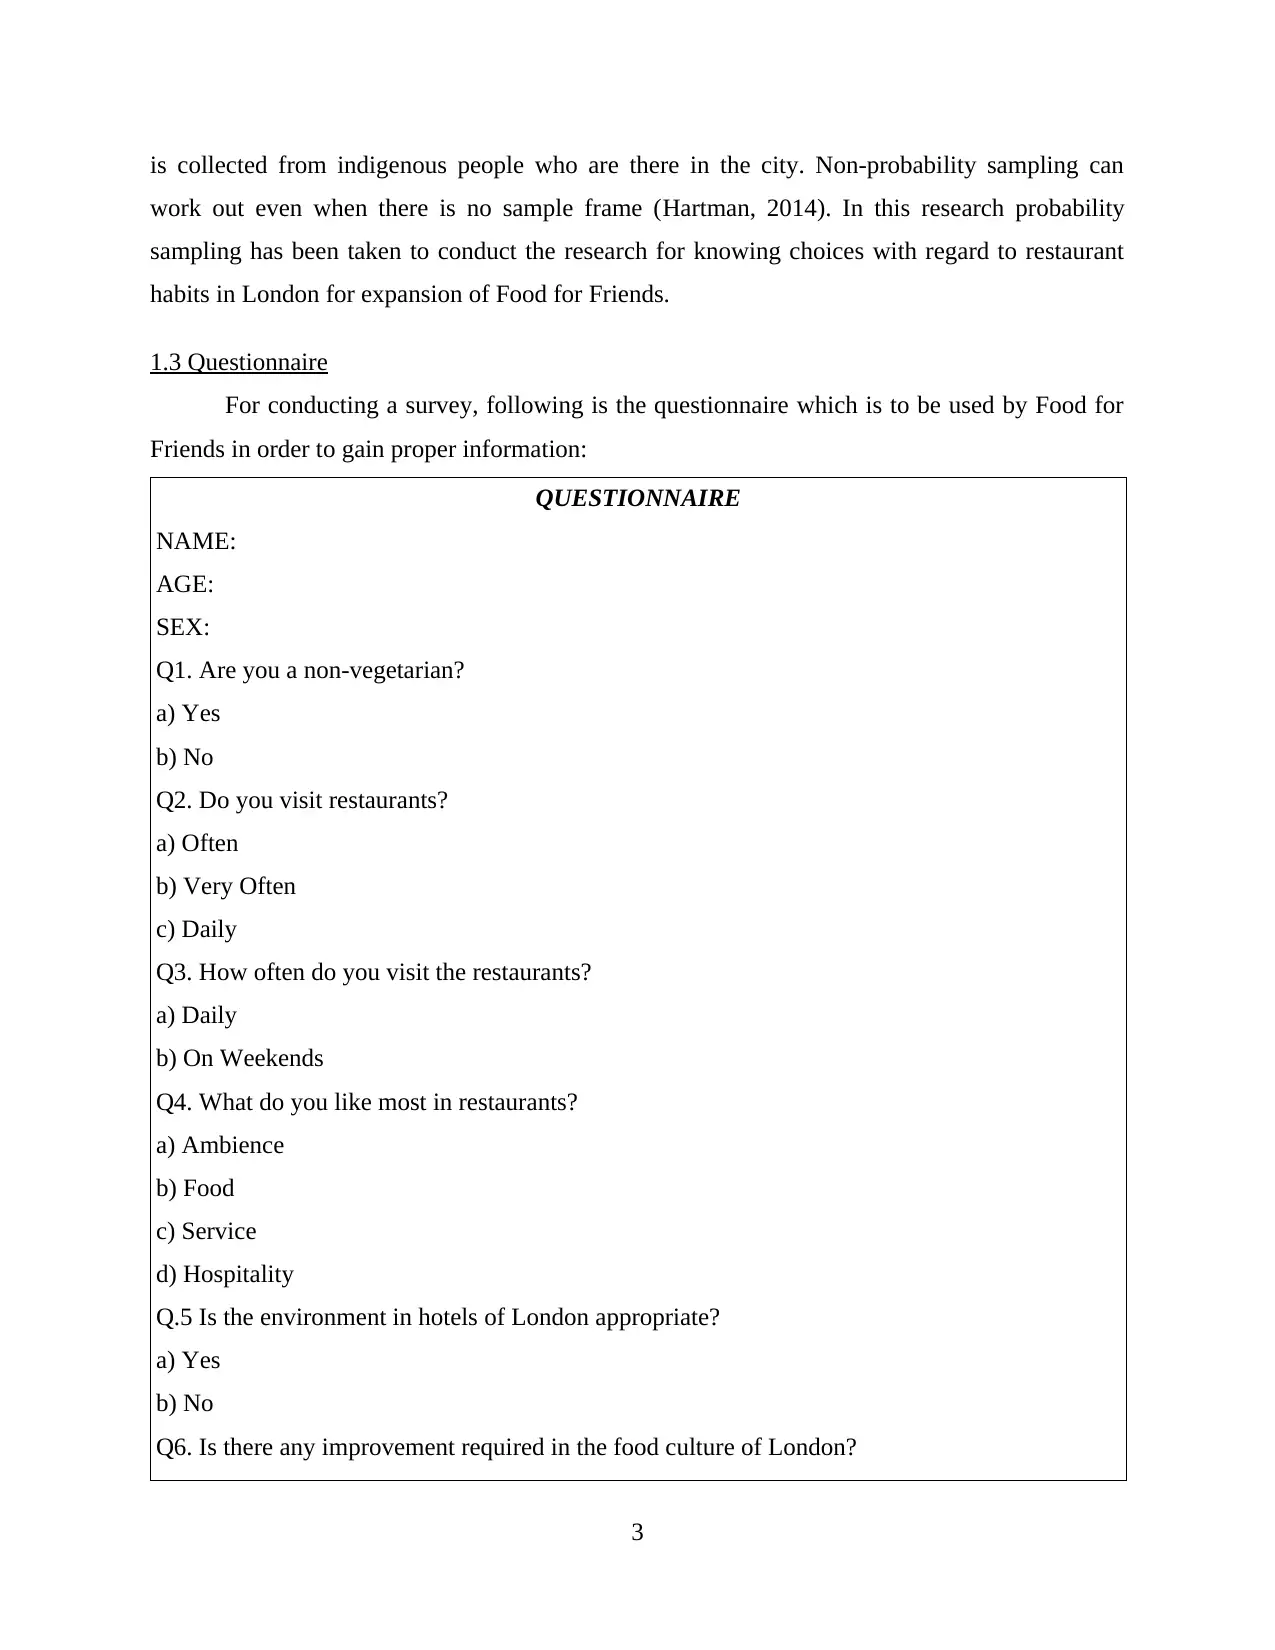
is collected from indigenous people who are there in the city. Non-probability sampling can
work out even when there is no sample frame (Hartman, 2014). In this research probability
sampling has been taken to conduct the research for knowing choices with regard to restaurant
habits in London for expansion of Food for Friends.
1.3 Questionnaire
For conducting a survey, following is the questionnaire which is to be used by Food for
Friends in order to gain proper information:
QUESTIONNAIRE
NAME:
AGE:
SEX:
Q1. Are you a non-vegetarian?
a) Yes
b) No
Q2. Do you visit restaurants?
a) Often
b) Very Often
c) Daily
Q3. How often do you visit the restaurants?
a) Daily
b) On Weekends
Q4. What do you like most in restaurants?
a) Ambience
b) Food
c) Service
d) Hospitality
Q.5 Is the environment in hotels of London appropriate?
a) Yes
b) No
Q6. Is there any improvement required in the food culture of London?
3
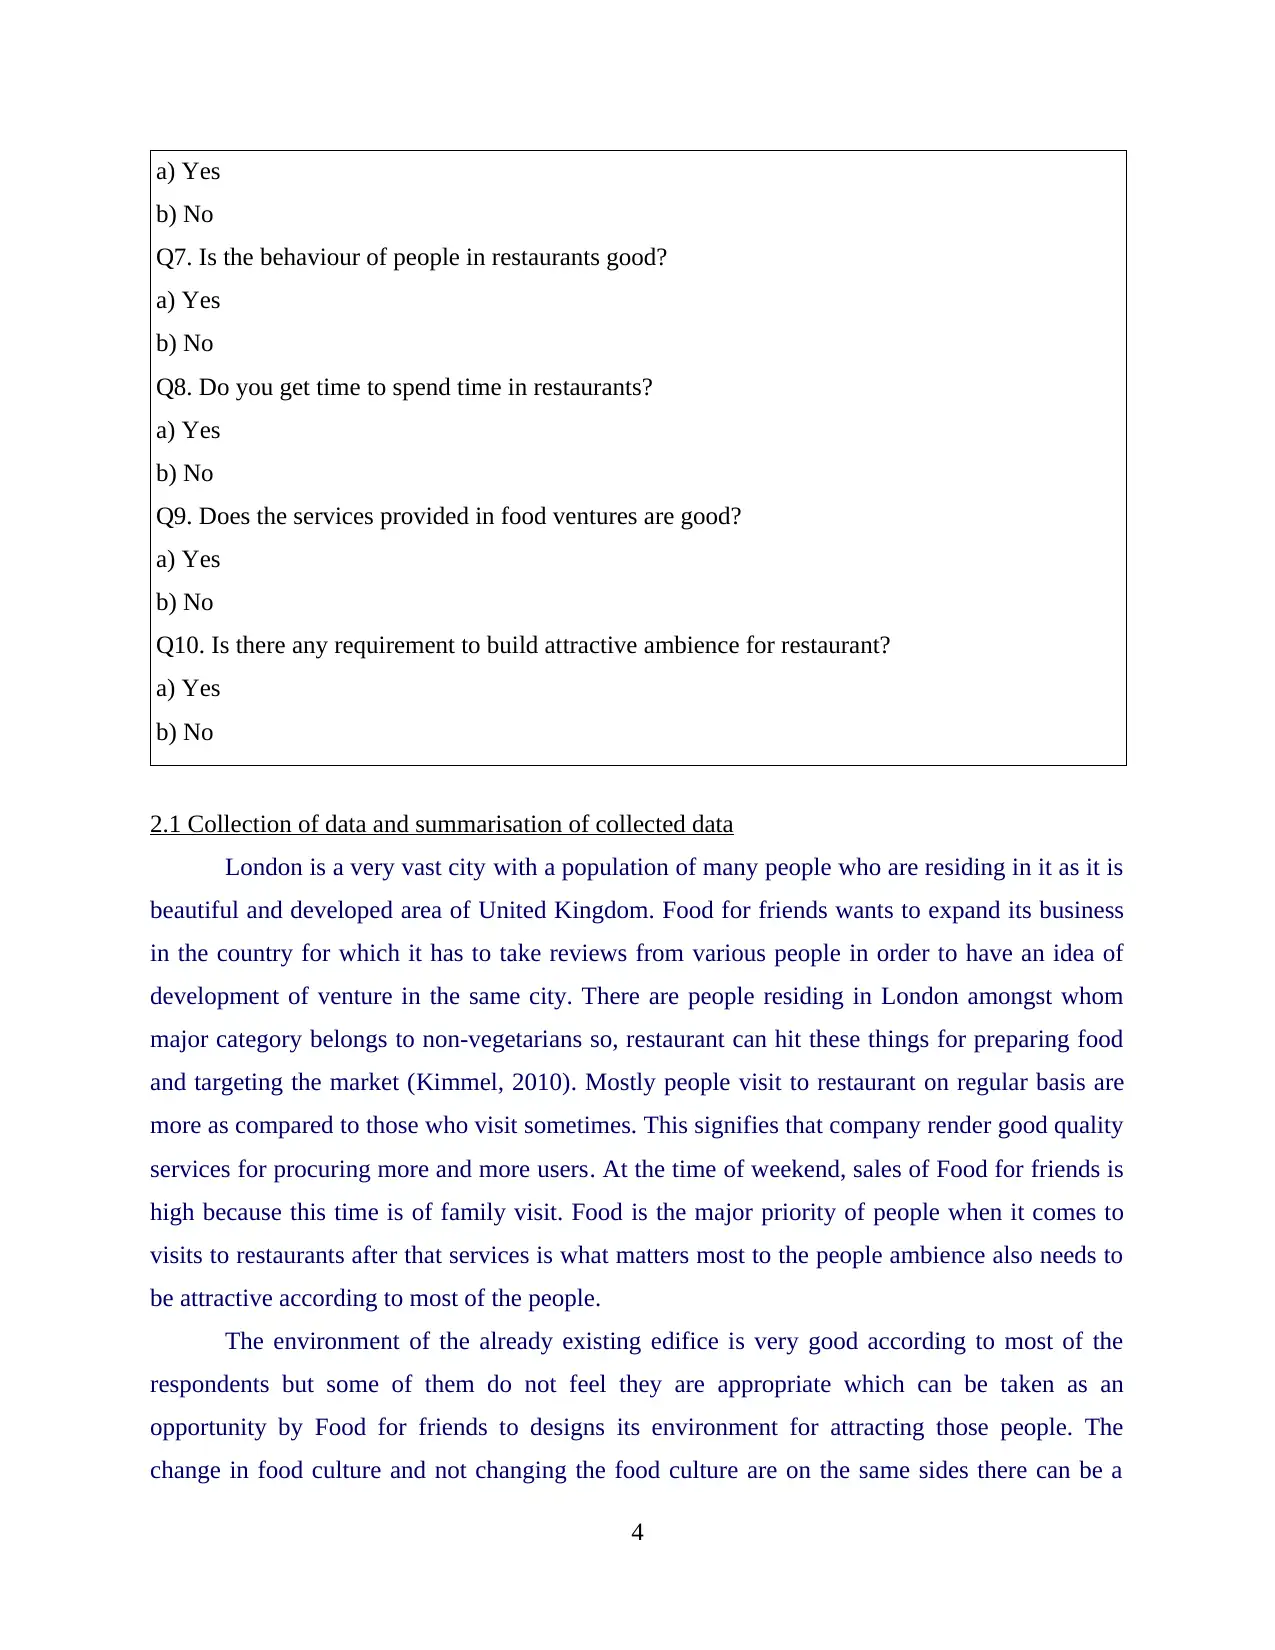
a) Yes
b) No
Q7. Is the behaviour of people in restaurants good?
a) Yes
b) No
Q8. Do you get time to spend time in restaurants?
a) Yes
b) No
Q9. Does the services provided in food ventures are good?
a) Yes
b) No
Q10. Is there any requirement to build attractive ambience for restaurant?
a) Yes
b) No
2.1 Collection of data and summarisation of collected data
London is a very vast city with a population of many people who are residing in it as it is
beautiful and developed area of United Kingdom. Food for friends wants to expand its business
in the country for which it has to take reviews from various people in order to have an idea of
development of venture in the same city. There are people residing in London amongst whom
major category belongs to non-vegetarians so, restaurant can hit these things for preparing food
and targeting the market (Kimmel, 2010). Mostly people visit to restaurant on regular basis are
more as compared to those who visit sometimes. This signifies that company render good quality
services for procuring more and more users. At the time of weekend, sales of Food for friends is
high because this time is of family visit. Food is the major priority of people when it comes to
visits to restaurants after that services is what matters most to the people ambience also needs to
be attractive according to most of the people.
The environment of the already existing edifice is very good according to most of the
respondents but some of them do not feel they are appropriate which can be taken as an
opportunity by Food for friends to designs its environment for attracting those people. The
change in food culture and not changing the food culture are on the same sides there can be a
4
b) No
Q7. Is the behaviour of people in restaurants good?
a) Yes
b) No
Q8. Do you get time to spend time in restaurants?
a) Yes
b) No
Q9. Does the services provided in food ventures are good?
a) Yes
b) No
Q10. Is there any requirement to build attractive ambience for restaurant?
a) Yes
b) No
2.1 Collection of data and summarisation of collected data
London is a very vast city with a population of many people who are residing in it as it is
beautiful and developed area of United Kingdom. Food for friends wants to expand its business
in the country for which it has to take reviews from various people in order to have an idea of
development of venture in the same city. There are people residing in London amongst whom
major category belongs to non-vegetarians so, restaurant can hit these things for preparing food
and targeting the market (Kimmel, 2010). Mostly people visit to restaurant on regular basis are
more as compared to those who visit sometimes. This signifies that company render good quality
services for procuring more and more users. At the time of weekend, sales of Food for friends is
high because this time is of family visit. Food is the major priority of people when it comes to
visits to restaurants after that services is what matters most to the people ambience also needs to
be attractive according to most of the people.
The environment of the already existing edifice is very good according to most of the
respondents but some of them do not feel they are appropriate which can be taken as an
opportunity by Food for friends to designs its environment for attracting those people. The
change in food culture and not changing the food culture are on the same sides there can be a
4
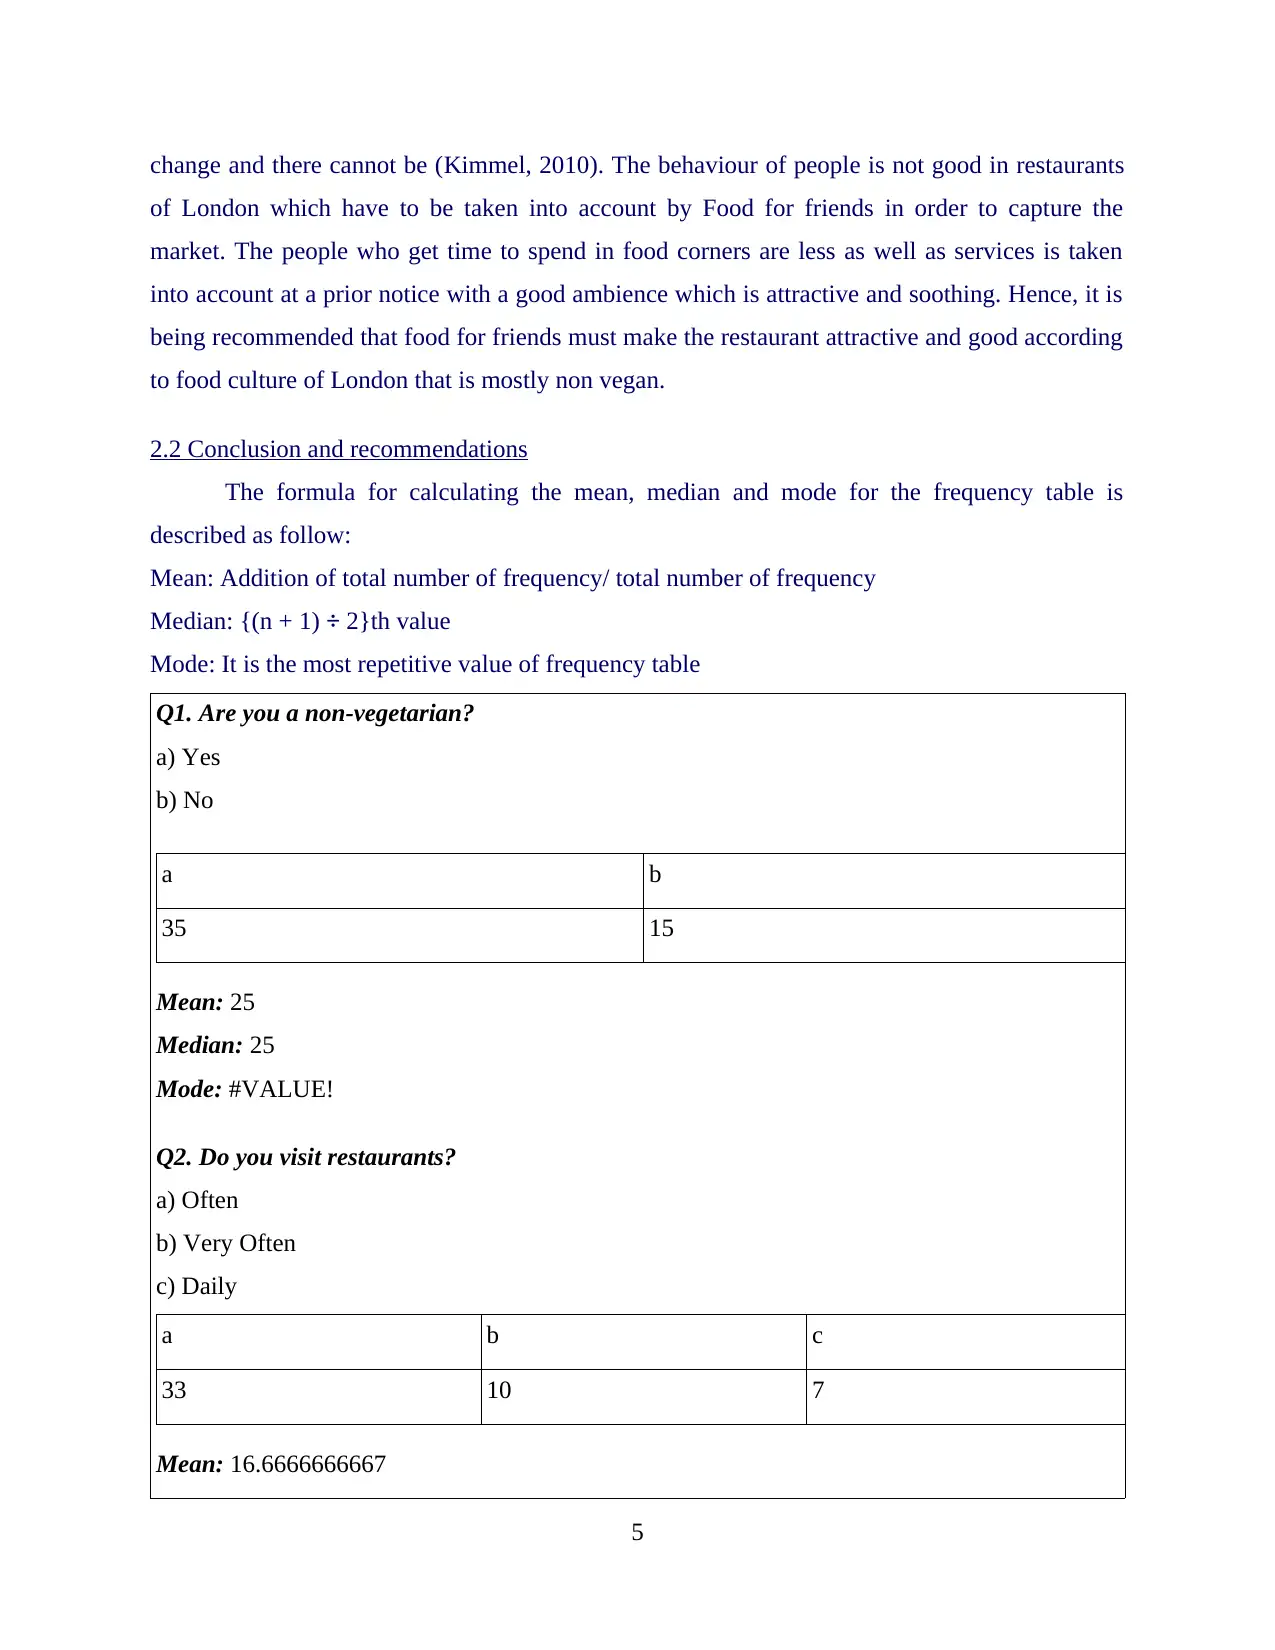
change and there cannot be (Kimmel, 2010). The behaviour of people is not good in restaurants
of London which have to be taken into account by Food for friends in order to capture the
market. The people who get time to spend in food corners are less as well as services is taken
into account at a prior notice with a good ambience which is attractive and soothing. Hence, it is
being recommended that food for friends must make the restaurant attractive and good according
to food culture of London that is mostly non vegan.
2.2 Conclusion and recommendations
The formula for calculating the mean, median and mode for the frequency table is
described as follow:
Mean: Addition of total number of frequency/ total number of frequency
Median: {(n + 1) ÷ 2}th value
Mode: It is the most repetitive value of frequency table
Q1. Are you a non-vegetarian?
a) Yes
b) No
a b
35 15
Mean: 25
Median: 25
Mode: #VALUE!
Q2. Do you visit restaurants?
a) Often
b) Very Often
c) Daily
a b c
33 10 7
Mean: 16.6666666667
5
Paraphrase This Document
Need a fresh take? Get an instant paraphrase of this document with our AI Paraphraser
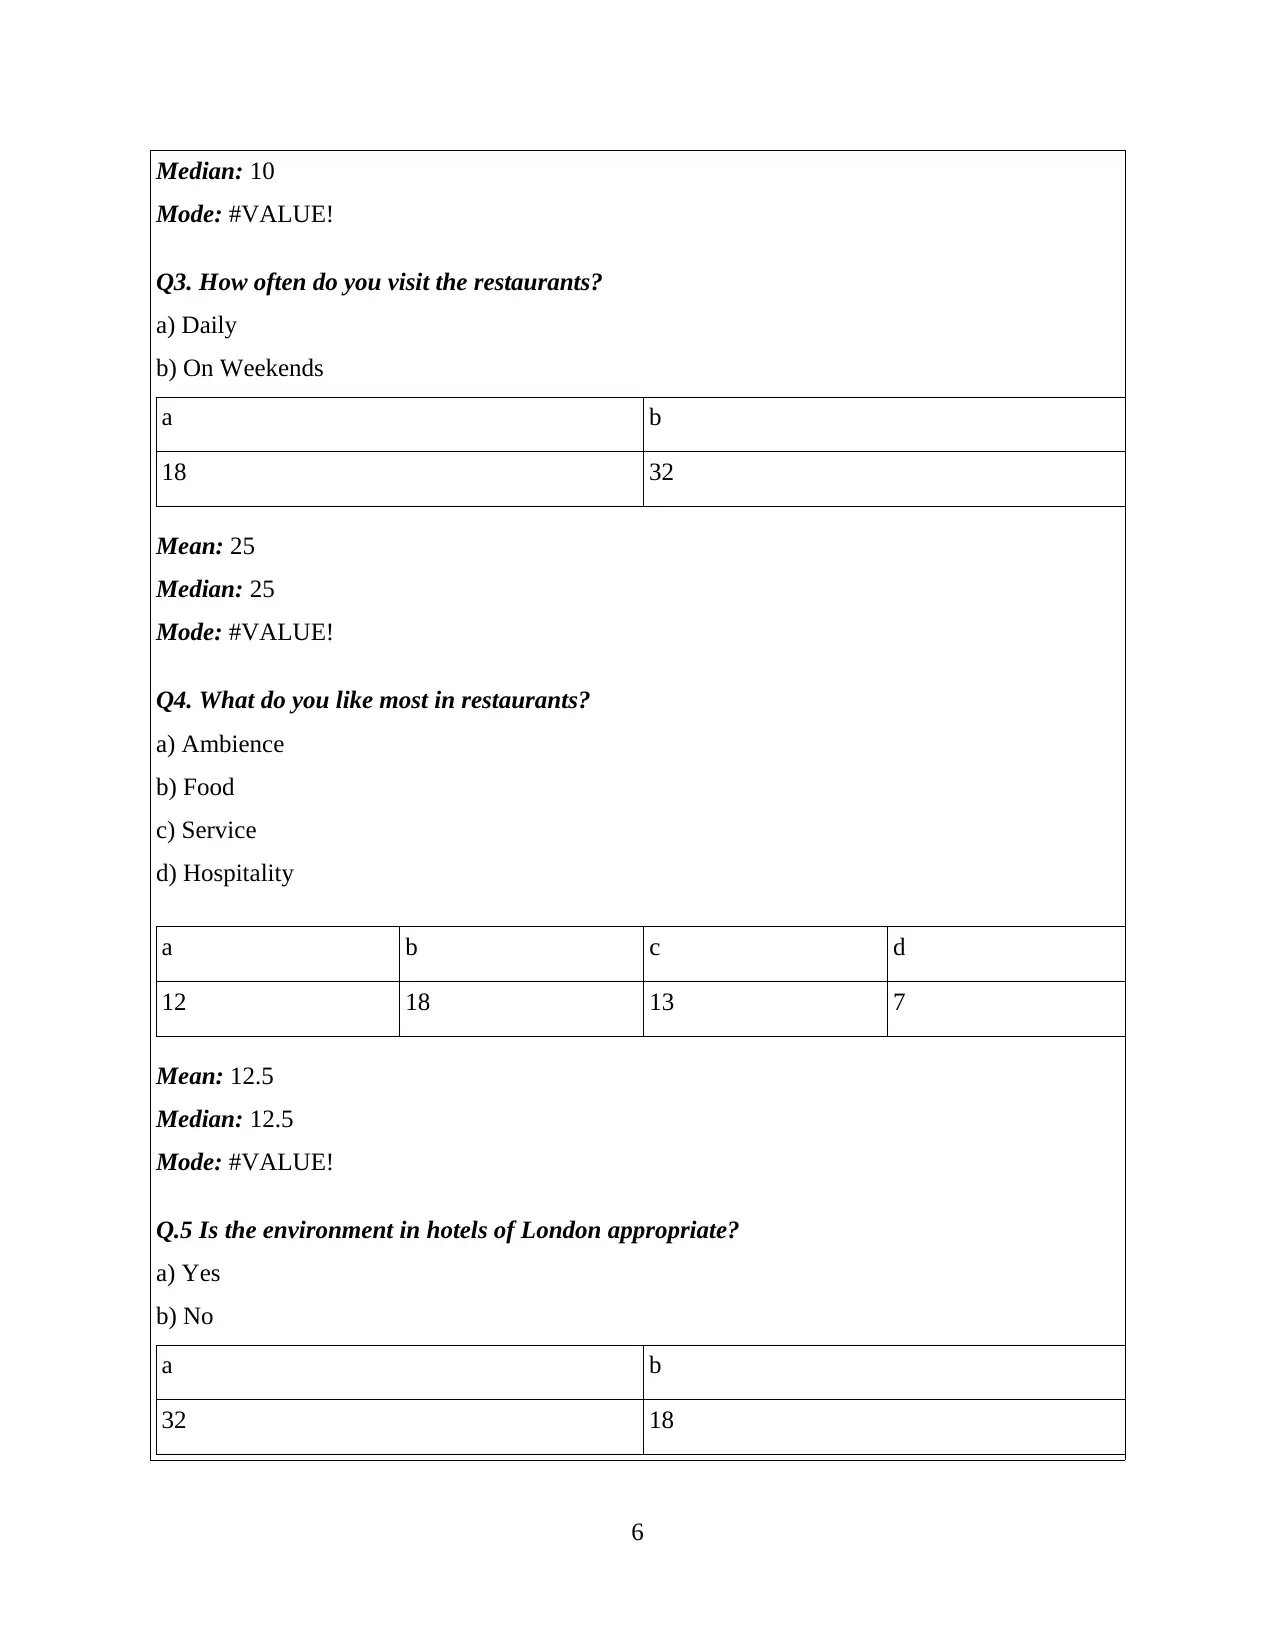
Median: 10
Mode: #VALUE!
Q3. How often do you visit the restaurants?
a) Daily
b) On Weekends
a b
18 32
Mean: 25
Median: 25
Mode: #VALUE!
Q4. What do you like most in restaurants?
a) Ambience
b) Food
c) Service
d) Hospitality
a b c d
12 18 13 7
Mean: 12.5
Median: 12.5
Mode: #VALUE!
Q.5 Is the environment in hotels of London appropriate?
a) Yes
b) No
a b
32 18
6
Mode: #VALUE!
Q3. How often do you visit the restaurants?
a) Daily
b) On Weekends
a b
18 32
Mean: 25
Median: 25
Mode: #VALUE!
Q4. What do you like most in restaurants?
a) Ambience
b) Food
c) Service
d) Hospitality
a b c d
12 18 13 7
Mean: 12.5
Median: 12.5
Mode: #VALUE!
Q.5 Is the environment in hotels of London appropriate?
a) Yes
b) No
a b
32 18
6
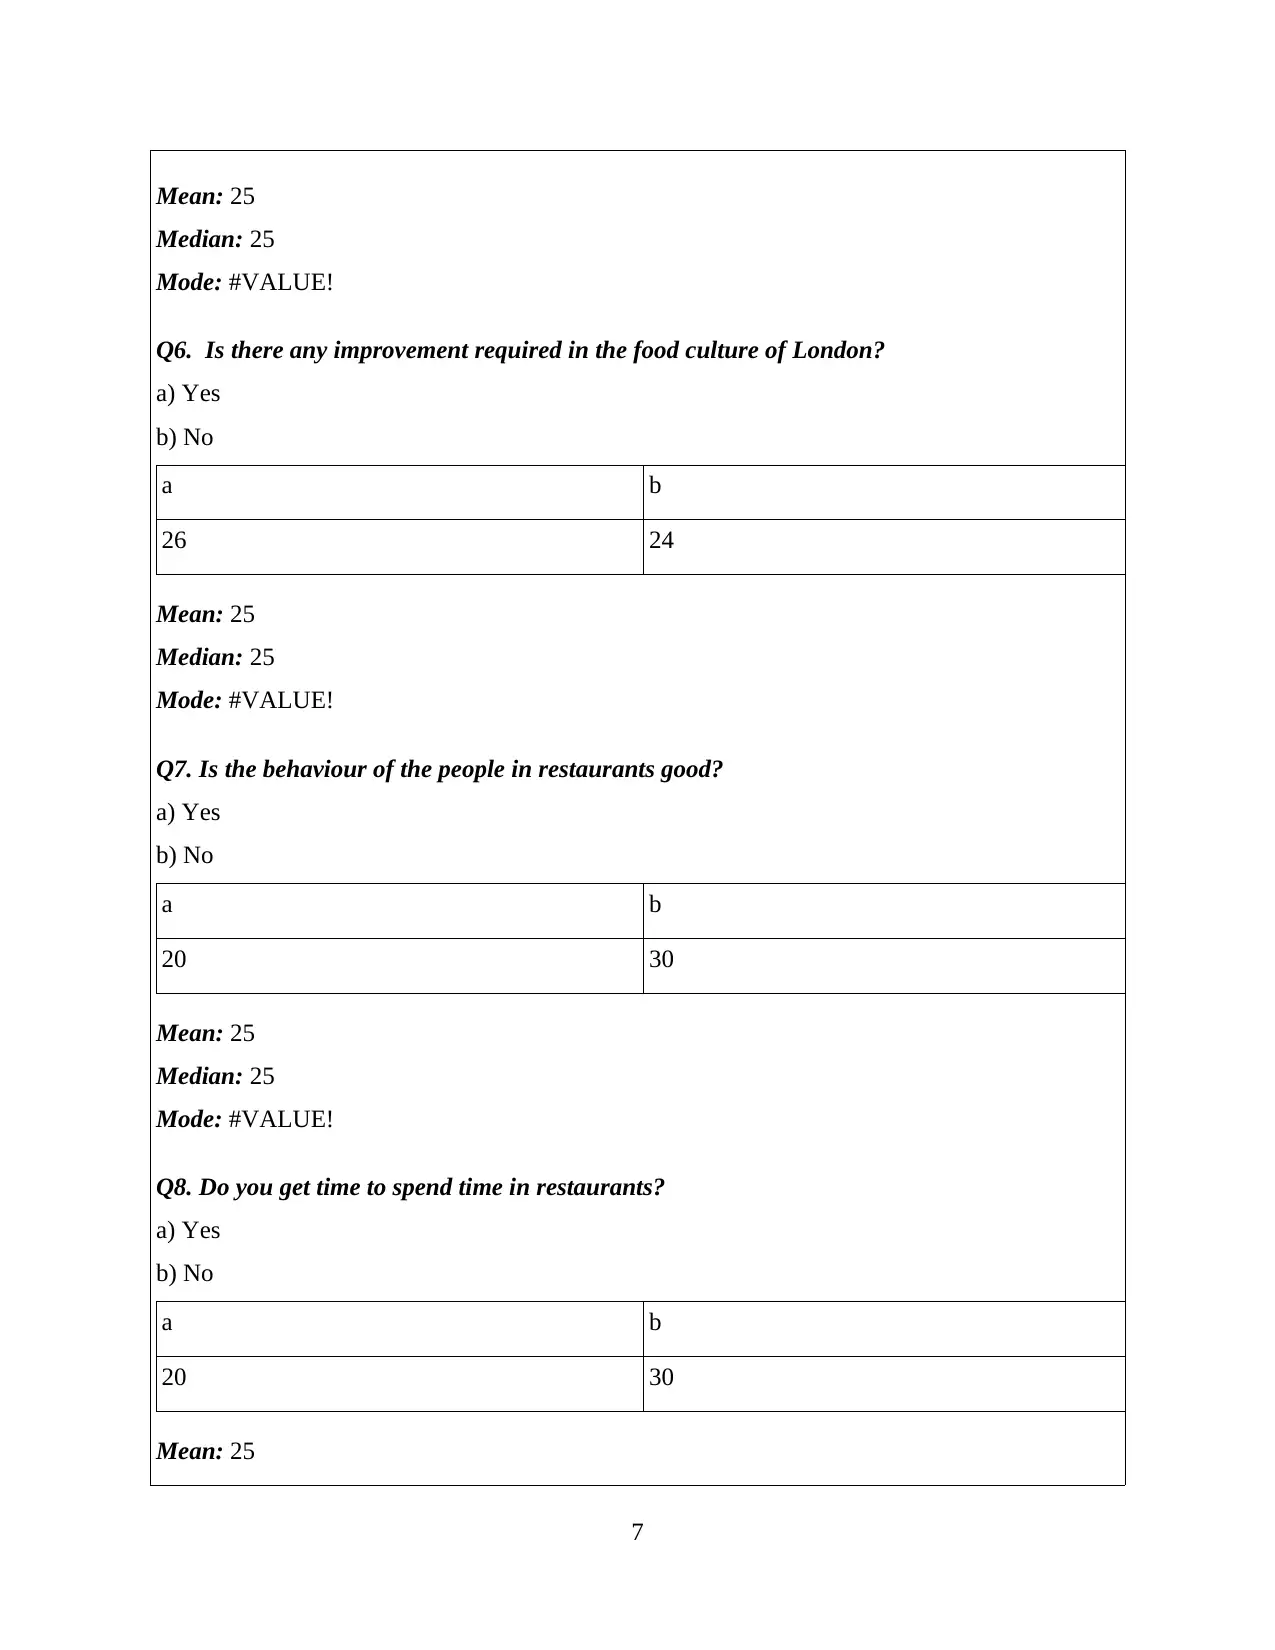
Mean: 25
Median: 25
Mode: #VALUE!
Q6. Is there any improvement required in the food culture of London?
a) Yes
b) No
a b
26 24
Mean: 25
Median: 25
Mode: #VALUE!
Q7. Is the behaviour of the people in restaurants good?
a) Yes
b) No
a b
20 30
Mean: 25
Median: 25
Mode: #VALUE!
Q8. Do you get time to spend time in restaurants?
a) Yes
b) No
a b
20 30
Mean: 25
7
Median: 25
Mode: #VALUE!
Q6. Is there any improvement required in the food culture of London?
a) Yes
b) No
a b
26 24
Mean: 25
Median: 25
Mode: #VALUE!
Q7. Is the behaviour of the people in restaurants good?
a) Yes
b) No
a b
20 30
Mean: 25
Median: 25
Mode: #VALUE!
Q8. Do you get time to spend time in restaurants?
a) Yes
b) No
a b
20 30
Mean: 25
7
Median: 25
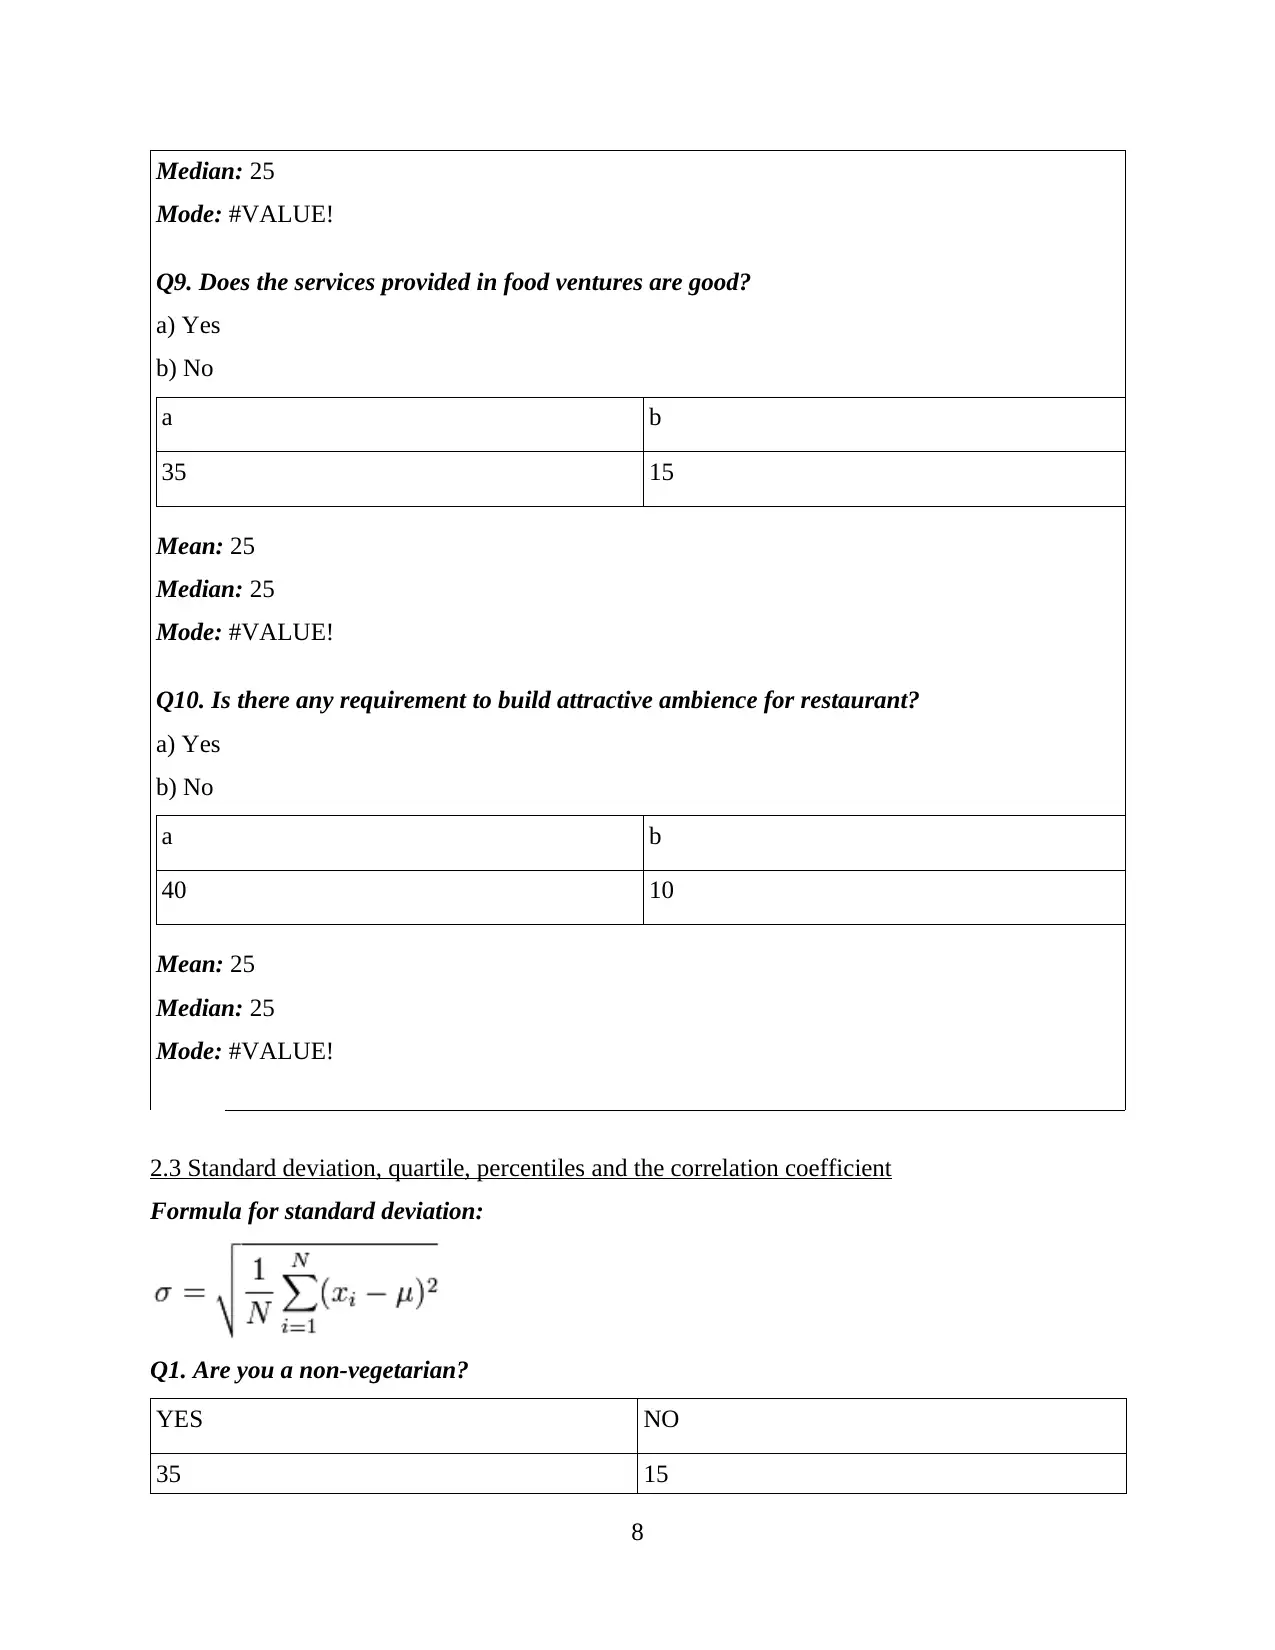
Mode: #VALUE!
Q9. Does the services provided in food ventures are good?
a) Yes
b) No
a b
35 15
Mean: 25
Median: 25
Mode: #VALUE!
Q10. Is there any requirement to build attractive ambience for restaurant?
a) Yes
b) No
a b
40 10
Mean: 25
Median: 25
Mode: #VALUE!
2.3 Standard deviation, quartile, percentiles and the correlation coefficient
Formula for standard deviation:
Q1. Are you a non-vegetarian?
YES NO
35 15
8
Mode: #VALUE!
Q9. Does the services provided in food ventures are good?
a) Yes
b) No
a b
35 15
Mean: 25
Median: 25
Mode: #VALUE!
Q10. Is there any requirement to build attractive ambience for restaurant?
a) Yes
b) No
a b
40 10
Mean: 25
Median: 25
Mode: #VALUE!
2.3 Standard deviation, quartile, percentiles and the correlation coefficient
Formula for standard deviation:
Q1. Are you a non-vegetarian?
YES NO
35 15
8
Secure Best Marks with AI Grader
Need help grading? Try our AI Grader for instant feedback on your assignments.
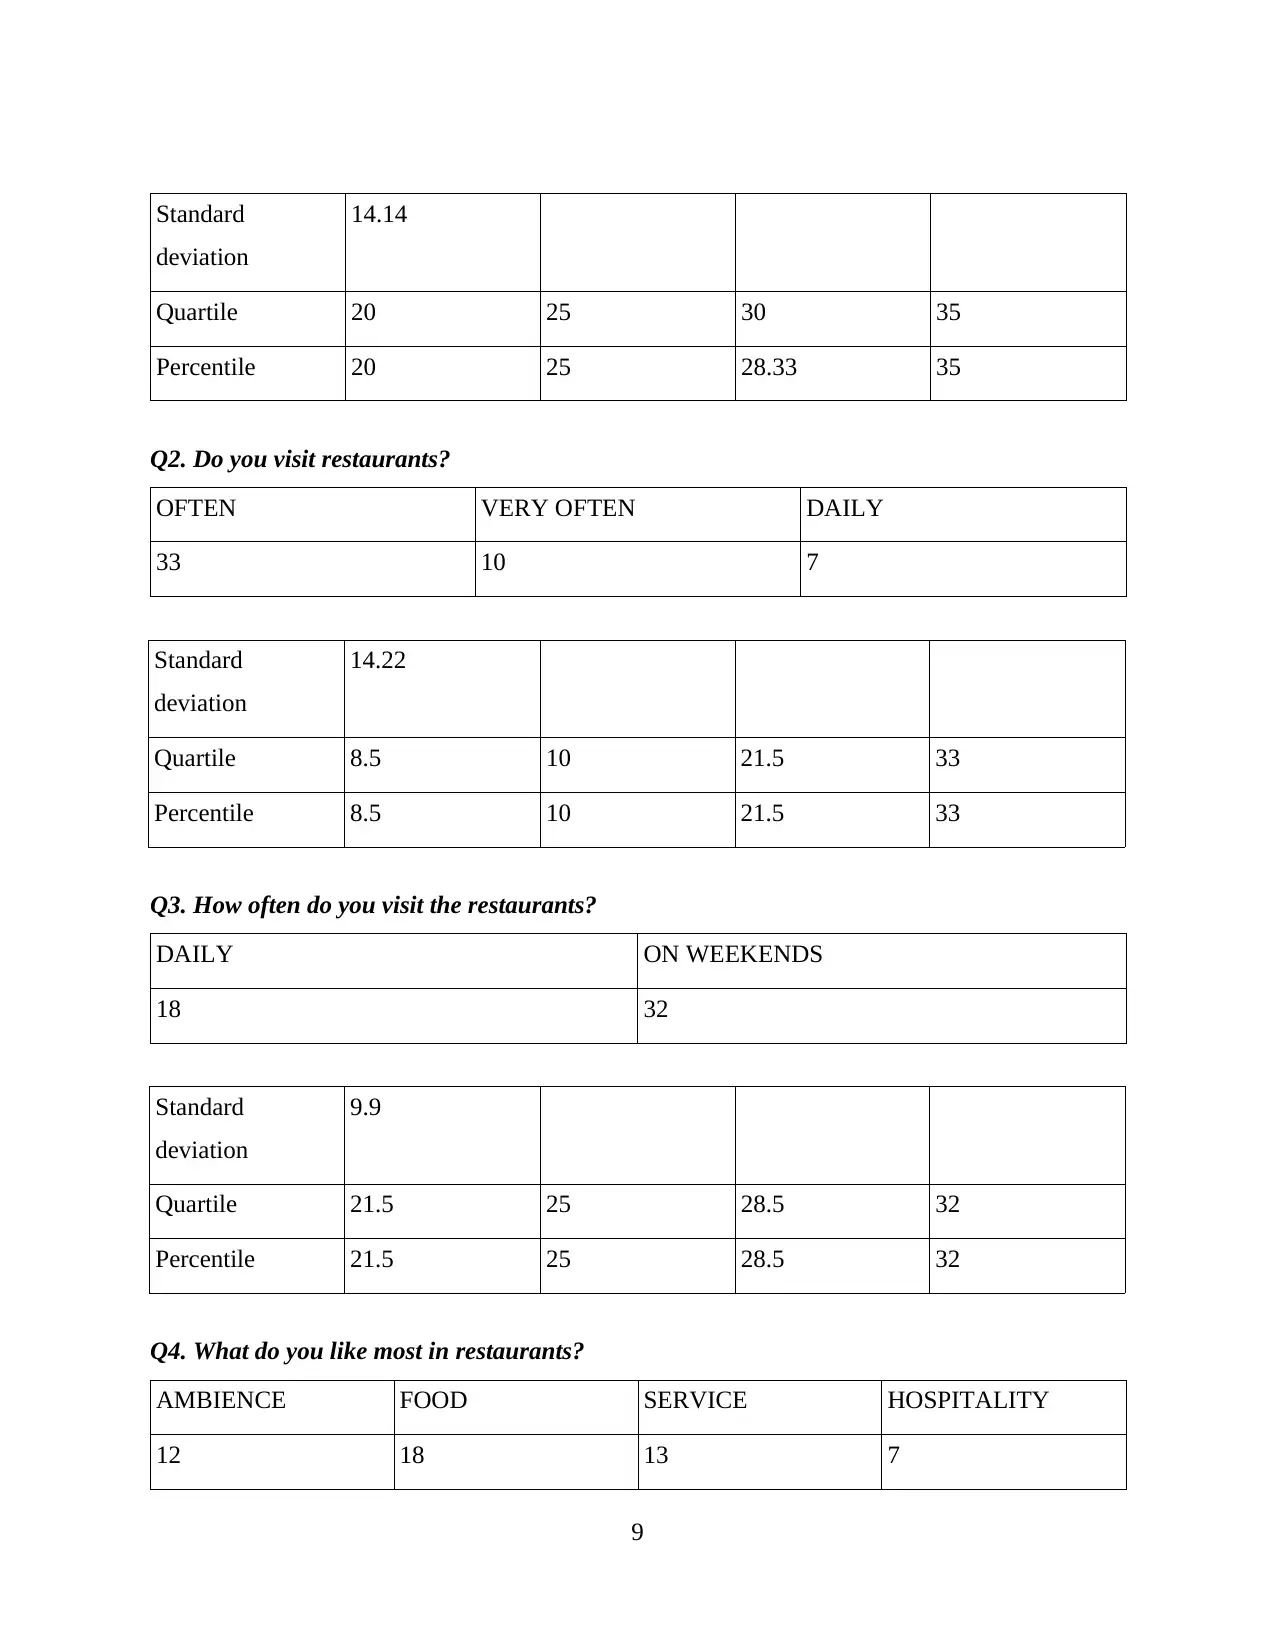
Standard
deviation
14.14
Quartile 20 25 30 35
Percentile 20 25 28.33 35
Q2. Do you visit restaurants?
OFTEN VERY OFTEN DAILY
33 10 7
Standard
deviation
14.22
Quartile 8.5 10 21.5 33
Percentile 8.5 10 21.5 33
Q3. How often do you visit the restaurants?
DAILY ON WEEKENDS
18 32
Standard
deviation
9.9
Quartile 21.5 25 28.5 32
Percentile 21.5 25 28.5 32
Q4. What do you like most in restaurants?
AMBIENCE FOOD SERVICE HOSPITALITY
12 18 13 7
9
deviation
14.14
Quartile 20 25 30 35
Percentile 20 25 28.33 35
Q2. Do you visit restaurants?
OFTEN VERY OFTEN DAILY
33 10 7
Standard
deviation
14.22
Quartile 8.5 10 21.5 33
Percentile 8.5 10 21.5 33
Q3. How often do you visit the restaurants?
DAILY ON WEEKENDS
18 32
Standard
deviation
9.9
Quartile 21.5 25 28.5 32
Percentile 21.5 25 28.5 32
Q4. What do you like most in restaurants?
AMBIENCE FOOD SERVICE HOSPITALITY
12 18 13 7
9
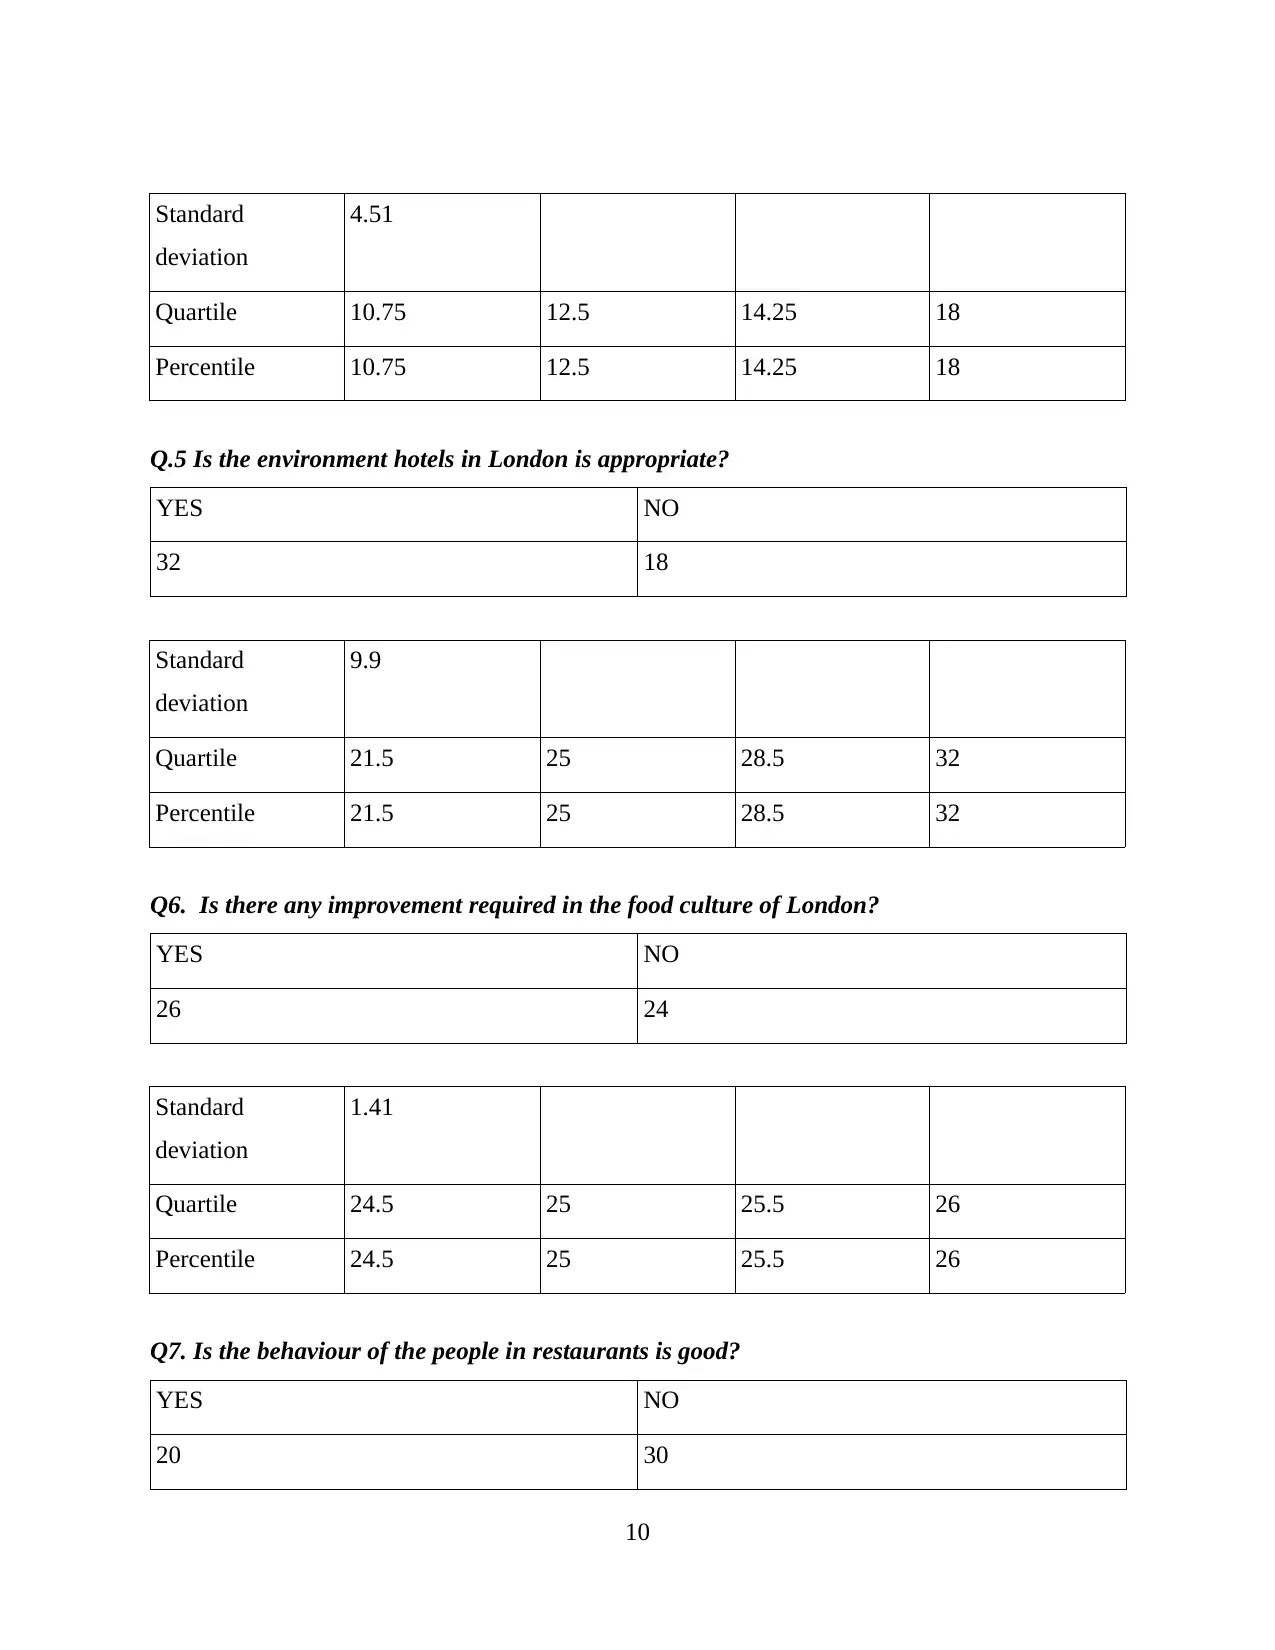
Standard
deviation
4.51
Quartile 10.75 12.5 14.25 18
Percentile 10.75 12.5 14.25 18
Q.5 Is the environment hotels in London is appropriate?
YES NO
32 18
Standard
deviation
9.9
Quartile 21.5 25 28.5 32
Percentile 21.5 25 28.5 32
Q6. Is there any improvement required in the food culture of London?
YES NO
26 24
Standard
deviation
1.41
Quartile 24.5 25 25.5 26
Percentile 24.5 25 25.5 26
Q7. Is the behaviour of the people in restaurants is good?
YES NO
20 30
10
deviation
4.51
Quartile 10.75 12.5 14.25 18
Percentile 10.75 12.5 14.25 18
Q.5 Is the environment hotels in London is appropriate?
YES NO
32 18
Standard
deviation
9.9
Quartile 21.5 25 28.5 32
Percentile 21.5 25 28.5 32
Q6. Is there any improvement required in the food culture of London?
YES NO
26 24
Standard
deviation
1.41
Quartile 24.5 25 25.5 26
Percentile 24.5 25 25.5 26
Q7. Is the behaviour of the people in restaurants is good?
YES NO
20 30
10
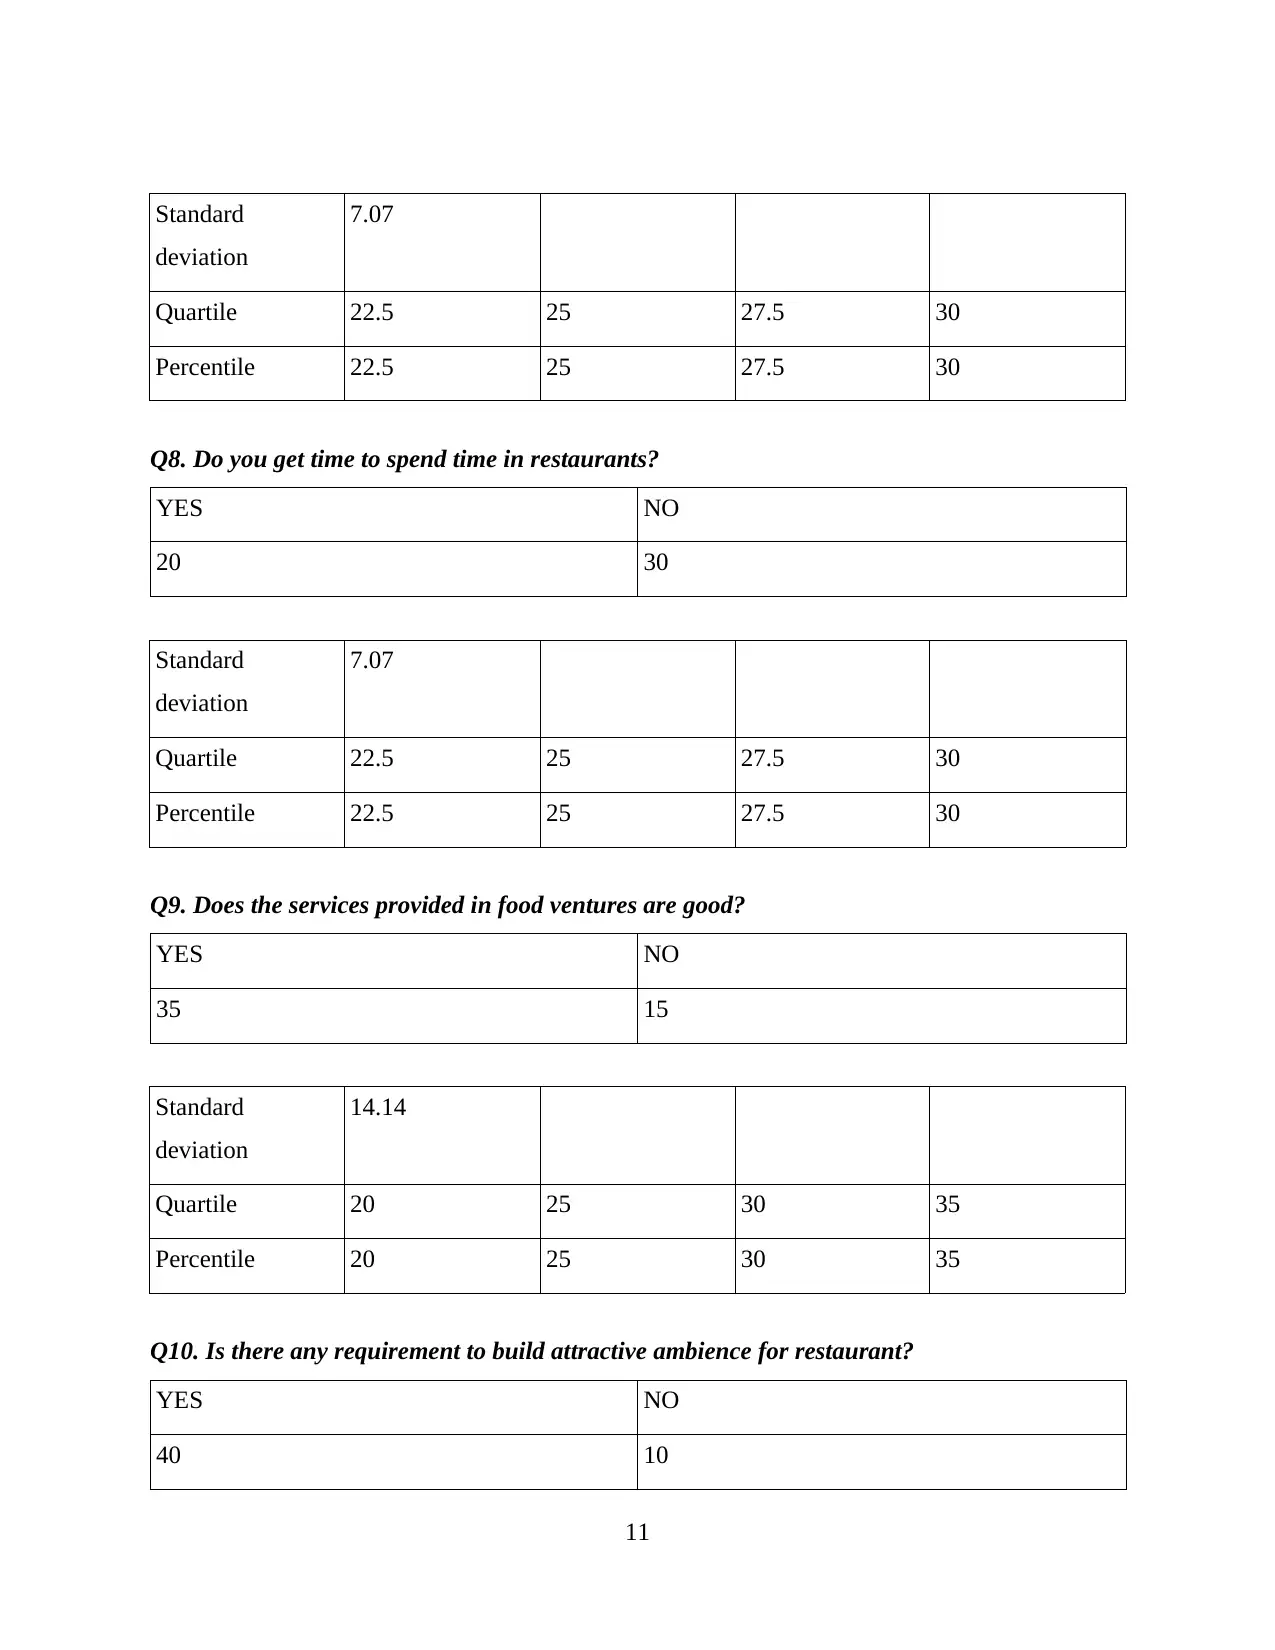
Standard
deviation
7.07
Quartile 22.5 25 27.5 30
Percentile 22.5 25 27.5 30
Q8. Do you get time to spend time in restaurants?
YES NO
20 30
Standard
deviation
7.07
Quartile 22.5 25 27.5 30
Percentile 22.5 25 27.5 30
Q9. Does the services provided in food ventures are good?
YES NO
35 15
Standard
deviation
14.14
Quartile 20 25 30 35
Percentile 20 25 30 35
Q10. Is there any requirement to build attractive ambience for restaurant?
YES NO
40 10
11
deviation
7.07
Quartile 22.5 25 27.5 30
Percentile 22.5 25 27.5 30
Q8. Do you get time to spend time in restaurants?
YES NO
20 30
Standard
deviation
7.07
Quartile 22.5 25 27.5 30
Percentile 22.5 25 27.5 30
Q9. Does the services provided in food ventures are good?
YES NO
35 15
Standard
deviation
14.14
Quartile 20 25 30 35
Percentile 20 25 30 35
Q10. Is there any requirement to build attractive ambience for restaurant?
YES NO
40 10
11
Paraphrase This Document
Need a fresh take? Get an instant paraphrase of this document with our AI Paraphraser
Standard
deviation
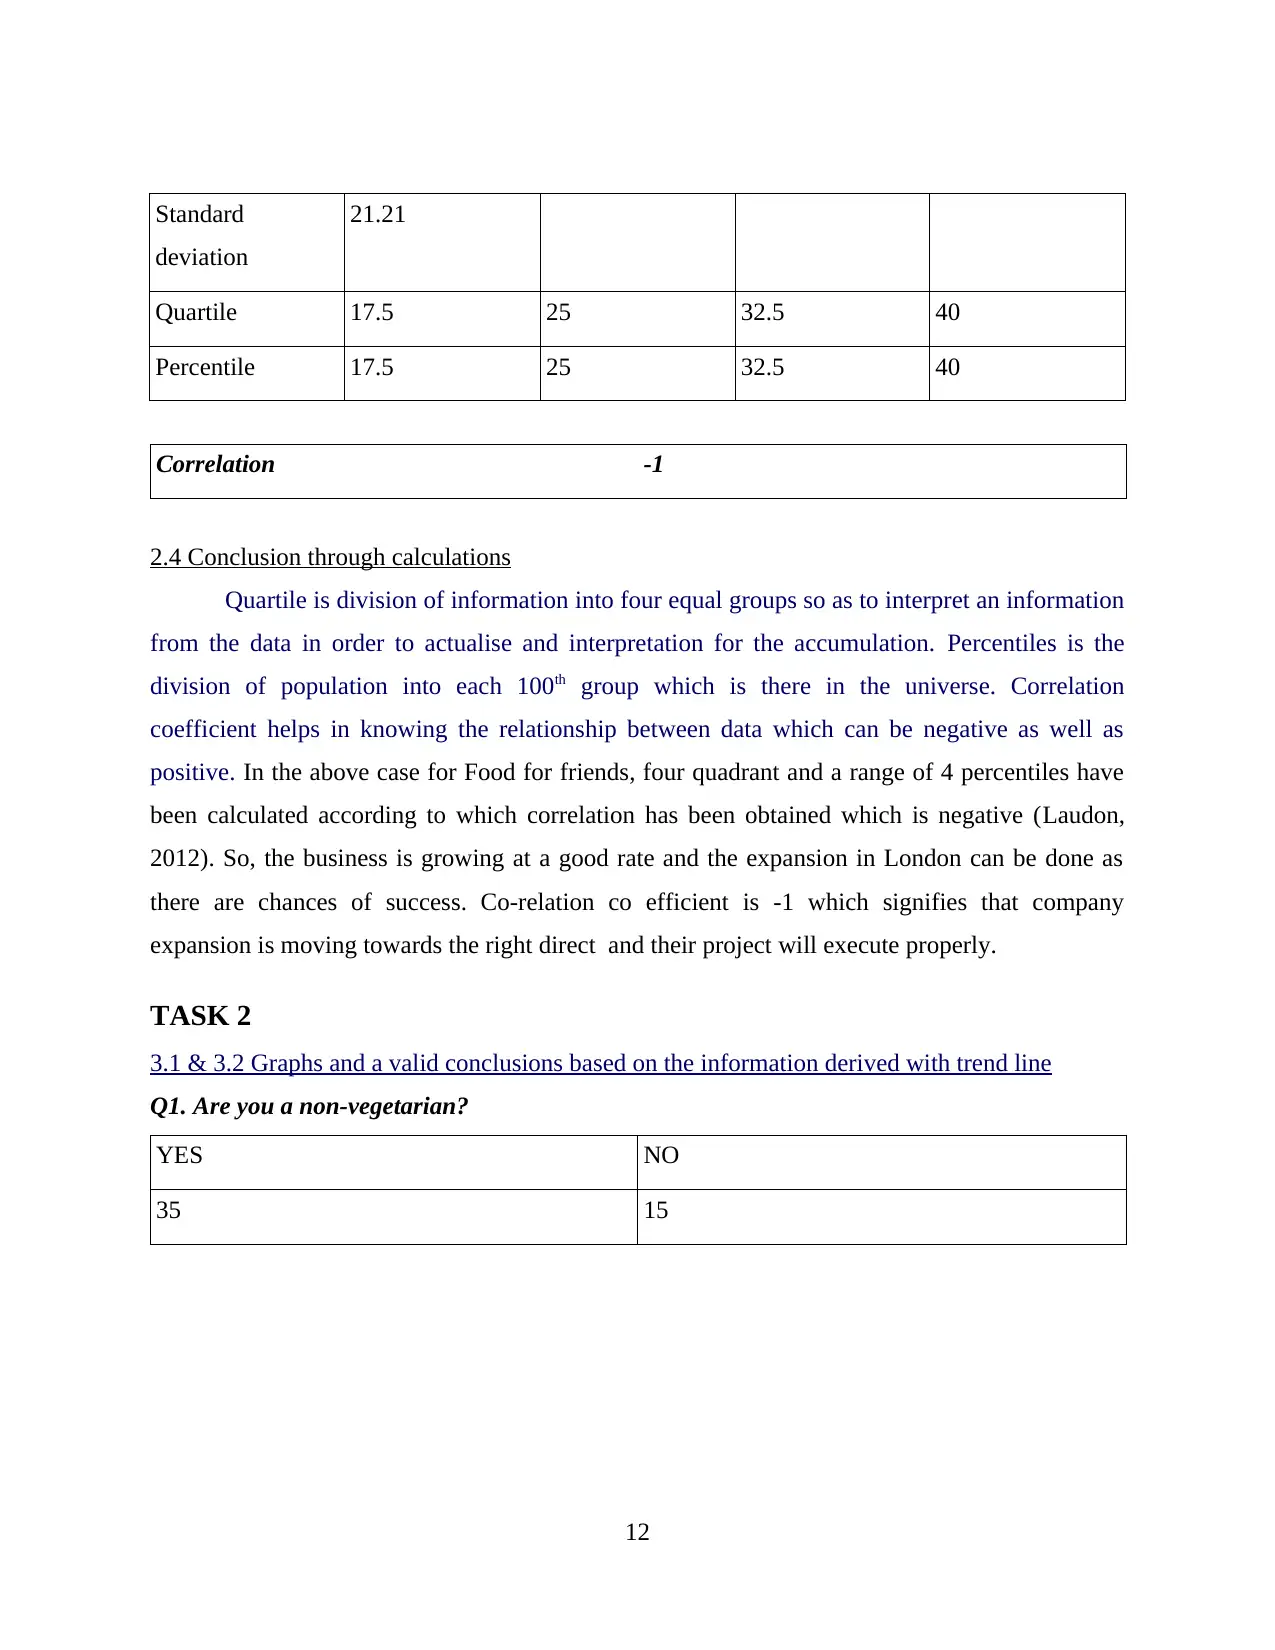
21.21
Quartile 17.5 25 32.5 40
Percentile 17.5 25 32.5 40
Correlation -1
2.4 Conclusion through calculations
Quartile is division of information into four equal groups so as to interpret an information
from the data in order to actualise and interpretation for the accumulation. Percentiles is the
division of population into each 100th group which is there in the universe. Correlation
coefficient helps in knowing the relationship between data which can be negative as well as
positive. In the above case for Food for friends, four quadrant and a range of 4 percentiles have
been calculated according to which correlation has been obtained which is negative (Laudon,
2012). So, the business is growing at a good rate and the expansion in London can be done as
there are chances of success. Co-relation co efficient is -1 which signifies that company
expansion is moving towards the right direct and their project will execute properly.
TASK 2
3.1 & 3.2 Graphs and a valid conclusions based on the information derived with trend line
Q1. Are you a non-vegetarian?
YES NO
35 15
12
deviation
21.21
Quartile 17.5 25 32.5 40
Percentile 17.5 25 32.5 40
Correlation -1
2.4 Conclusion through calculations
Quartile is division of information into four equal groups so as to interpret an information
from the data in order to actualise and interpretation for the accumulation. Percentiles is the
division of population into each 100th group which is there in the universe. Correlation
coefficient helps in knowing the relationship between data which can be negative as well as
positive. In the above case for Food for friends, four quadrant and a range of 4 percentiles have
been calculated according to which correlation has been obtained which is negative (Laudon,
2012). So, the business is growing at a good rate and the expansion in London can be done as
there are chances of success. Co-relation co efficient is -1 which signifies that company
expansion is moving towards the right direct and their project will execute properly.
TASK 2
3.1 & 3.2 Graphs and a valid conclusions based on the information derived with trend line
Q1. Are you a non-vegetarian?
YES NO
35 15
12
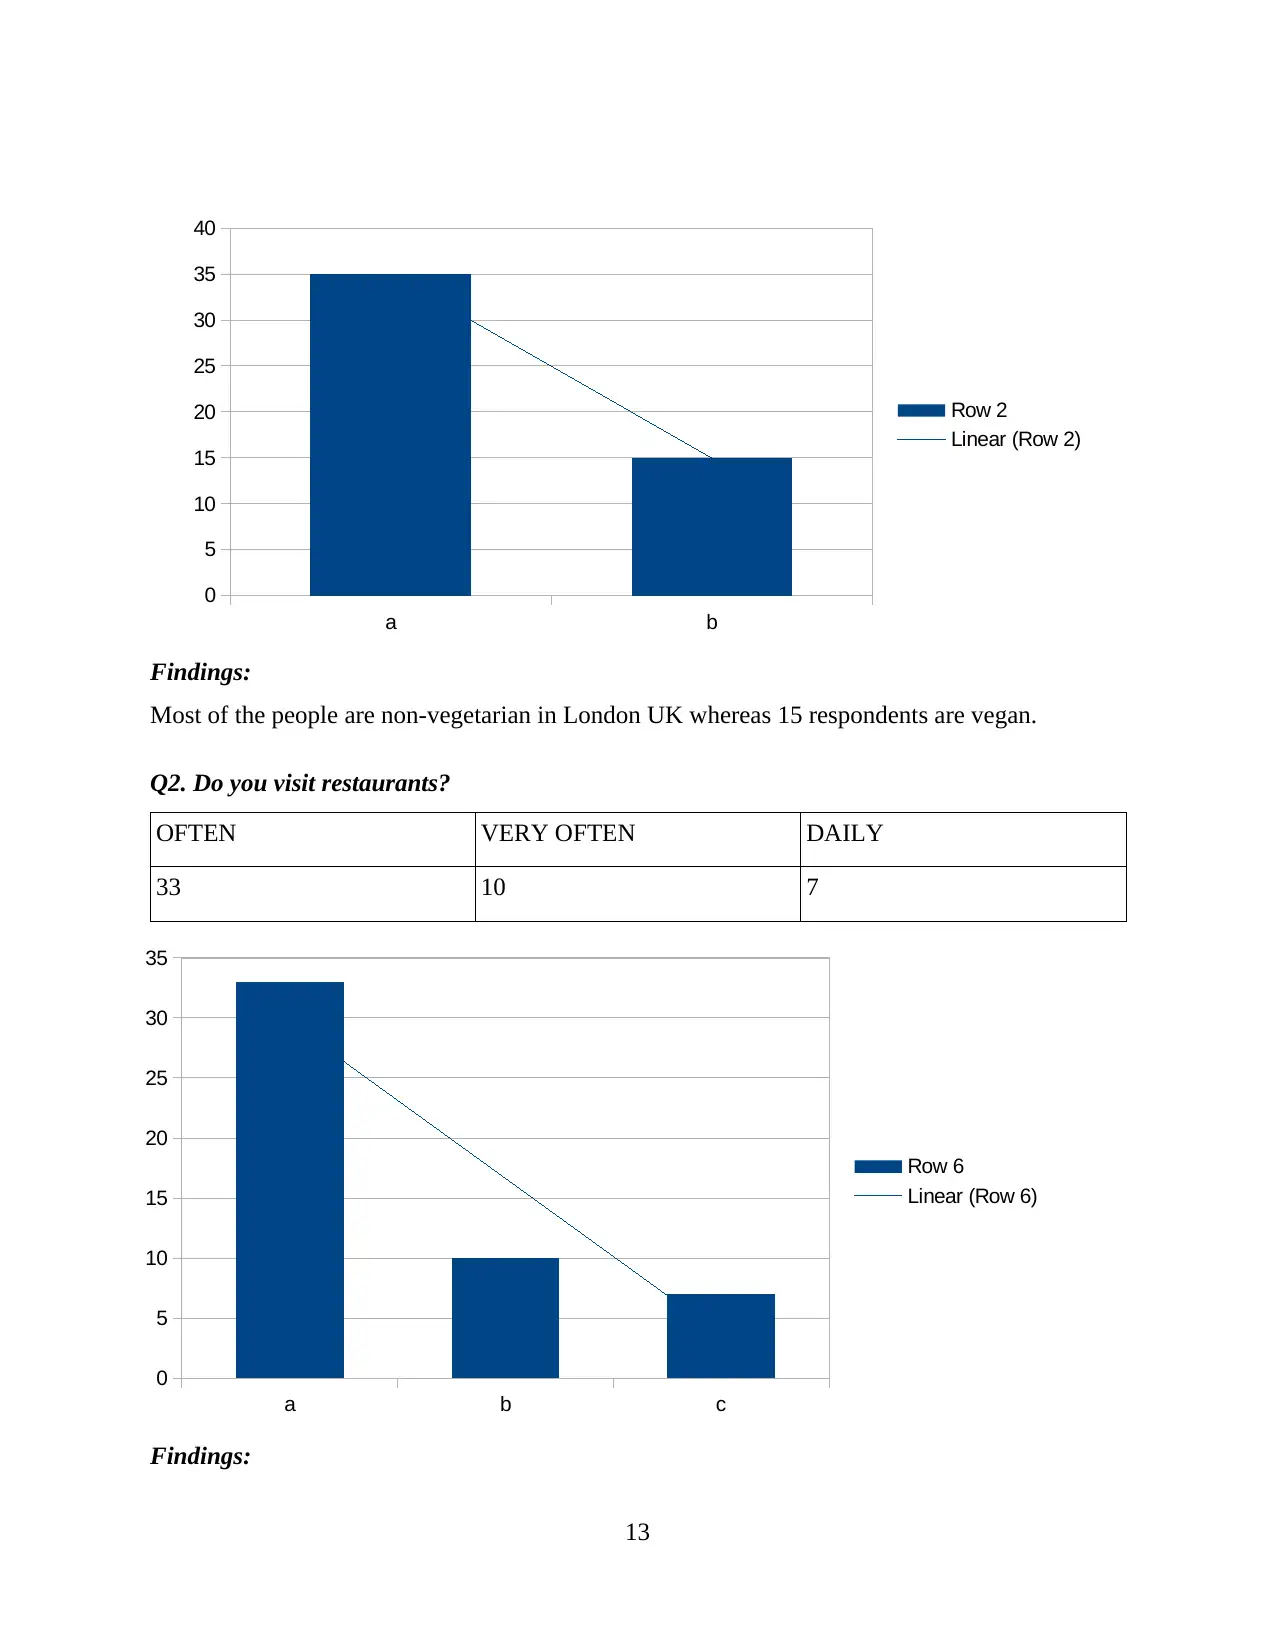
Findings:
Most of the people are non-vegetarian in London UK whereas 15 respondents are vegan.
Q2. Do you visit restaurants?
OFTEN VERY OFTEN DAILY
33 10 7
Findings:
13
a b
0
5
10
15
20
25
30
35
40
Row 2
Linear (Row 2)
a b c
0
5
10
15
20
25
30
35
Row 6
Linear (Row 6)
Most of the people are non-vegetarian in London UK whereas 15 respondents are vegan.
Q2. Do you visit restaurants?
OFTEN VERY OFTEN DAILY
33 10 7
Findings:
13
a b
0
5
10
15
20
25
30
35
40
Row 2
Linear (Row 2)
a b c
0
5
10
15
20
25
30
35
Row 6
Linear (Row 6)
33 out of 50 people visits restaurants often and rest 10 visits very often where 7 are the
daily visitors to restaurant.
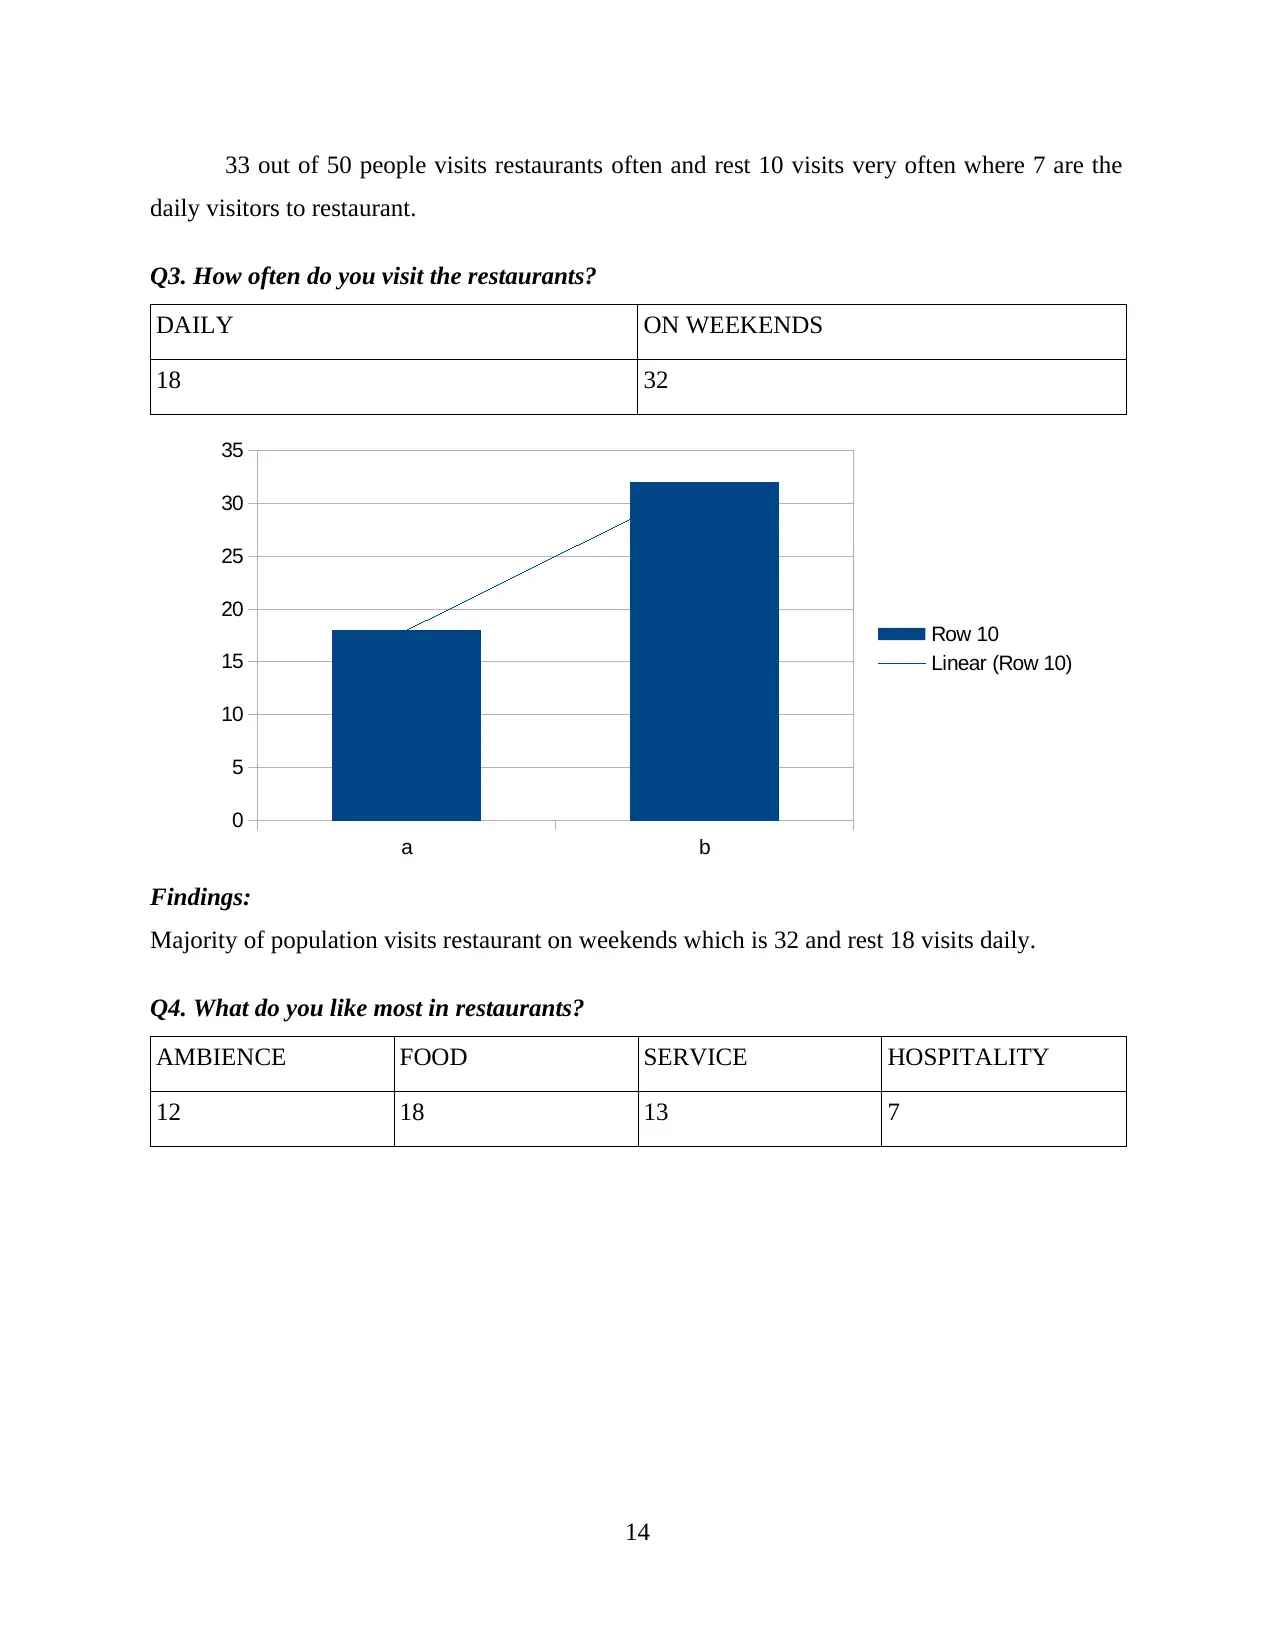
Q3. How often do you visit the restaurants?
DAILY ON WEEKENDS
18 32
Findings:
Majority of population visits restaurant on weekends which is 32 and rest 18 visits daily.
Q4. What do you like most in restaurants?
AMBIENCE FOOD SERVICE HOSPITALITY
12 18 13 7
14
a b
0
5
10
15
20
25
30
35
Row 10
Linear (Row 10)
daily visitors to restaurant.
Q3. How often do you visit the restaurants?
DAILY ON WEEKENDS
18 32
Findings:
Majority of population visits restaurant on weekends which is 32 and rest 18 visits daily.
Q4. What do you like most in restaurants?
AMBIENCE FOOD SERVICE HOSPITALITY
12 18 13 7
14
a b
0
5
10
15
20
25
30
35
Row 10
Linear (Row 10)
Secure Best Marks with AI Grader
Need help grading? Try our AI Grader for instant feedback on your assignments.
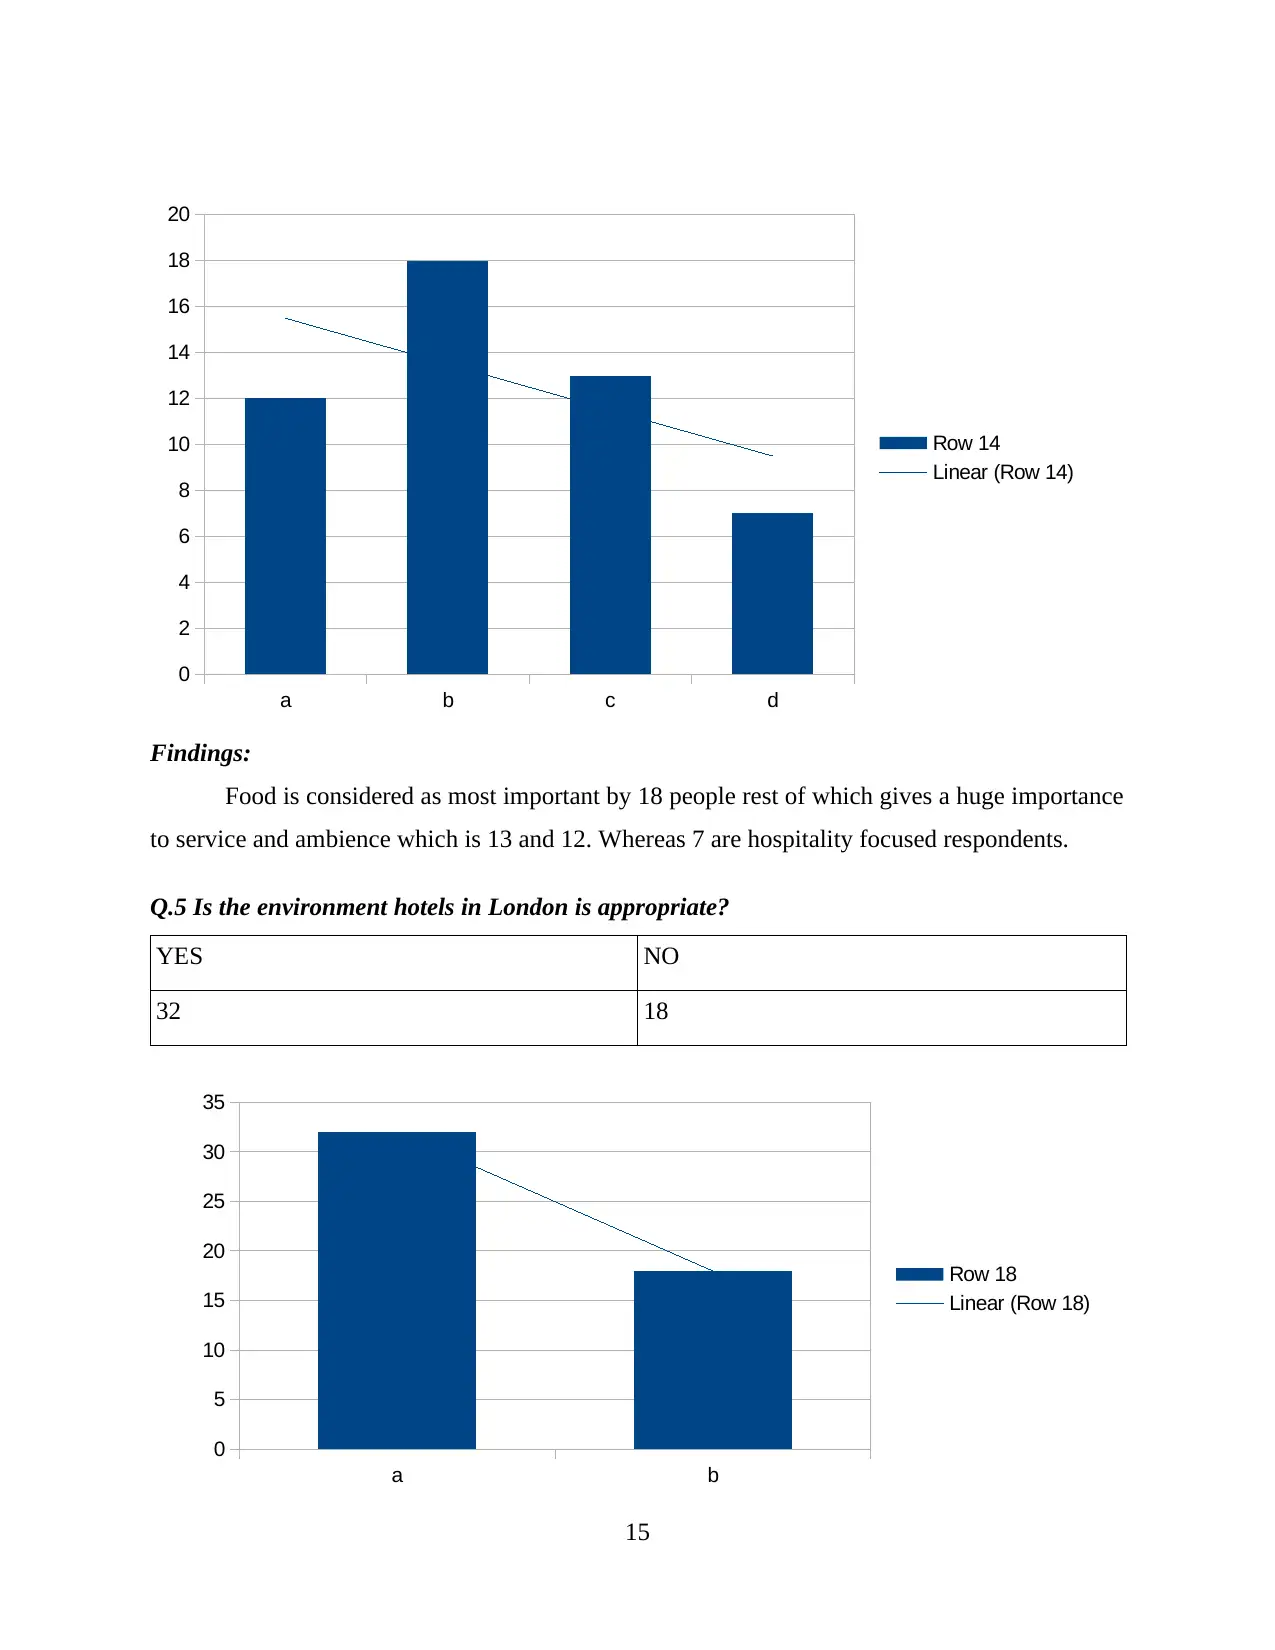
Findings:
Food is considered as most important by 18 people rest of which gives a huge importance
to service and ambience which is 13 and 12. Whereas 7 are hospitality focused respondents.
Q.5 Is the environment hotels in London is appropriate?
YES NO
32 18
15
a b c d
0
2
4
6
8
10
12
14
16
18
20
Row 14
Linear (Row 14)
a b
0
5
10
15
20
25
30
35
Row 18
Linear (Row 18)
Findings:
The environment of hotels is considered as good by 32 of the people rest 18 considers it
as not appropriate.
Q6. Is there any improvement required in the food culture of London?
YES NO
26 24
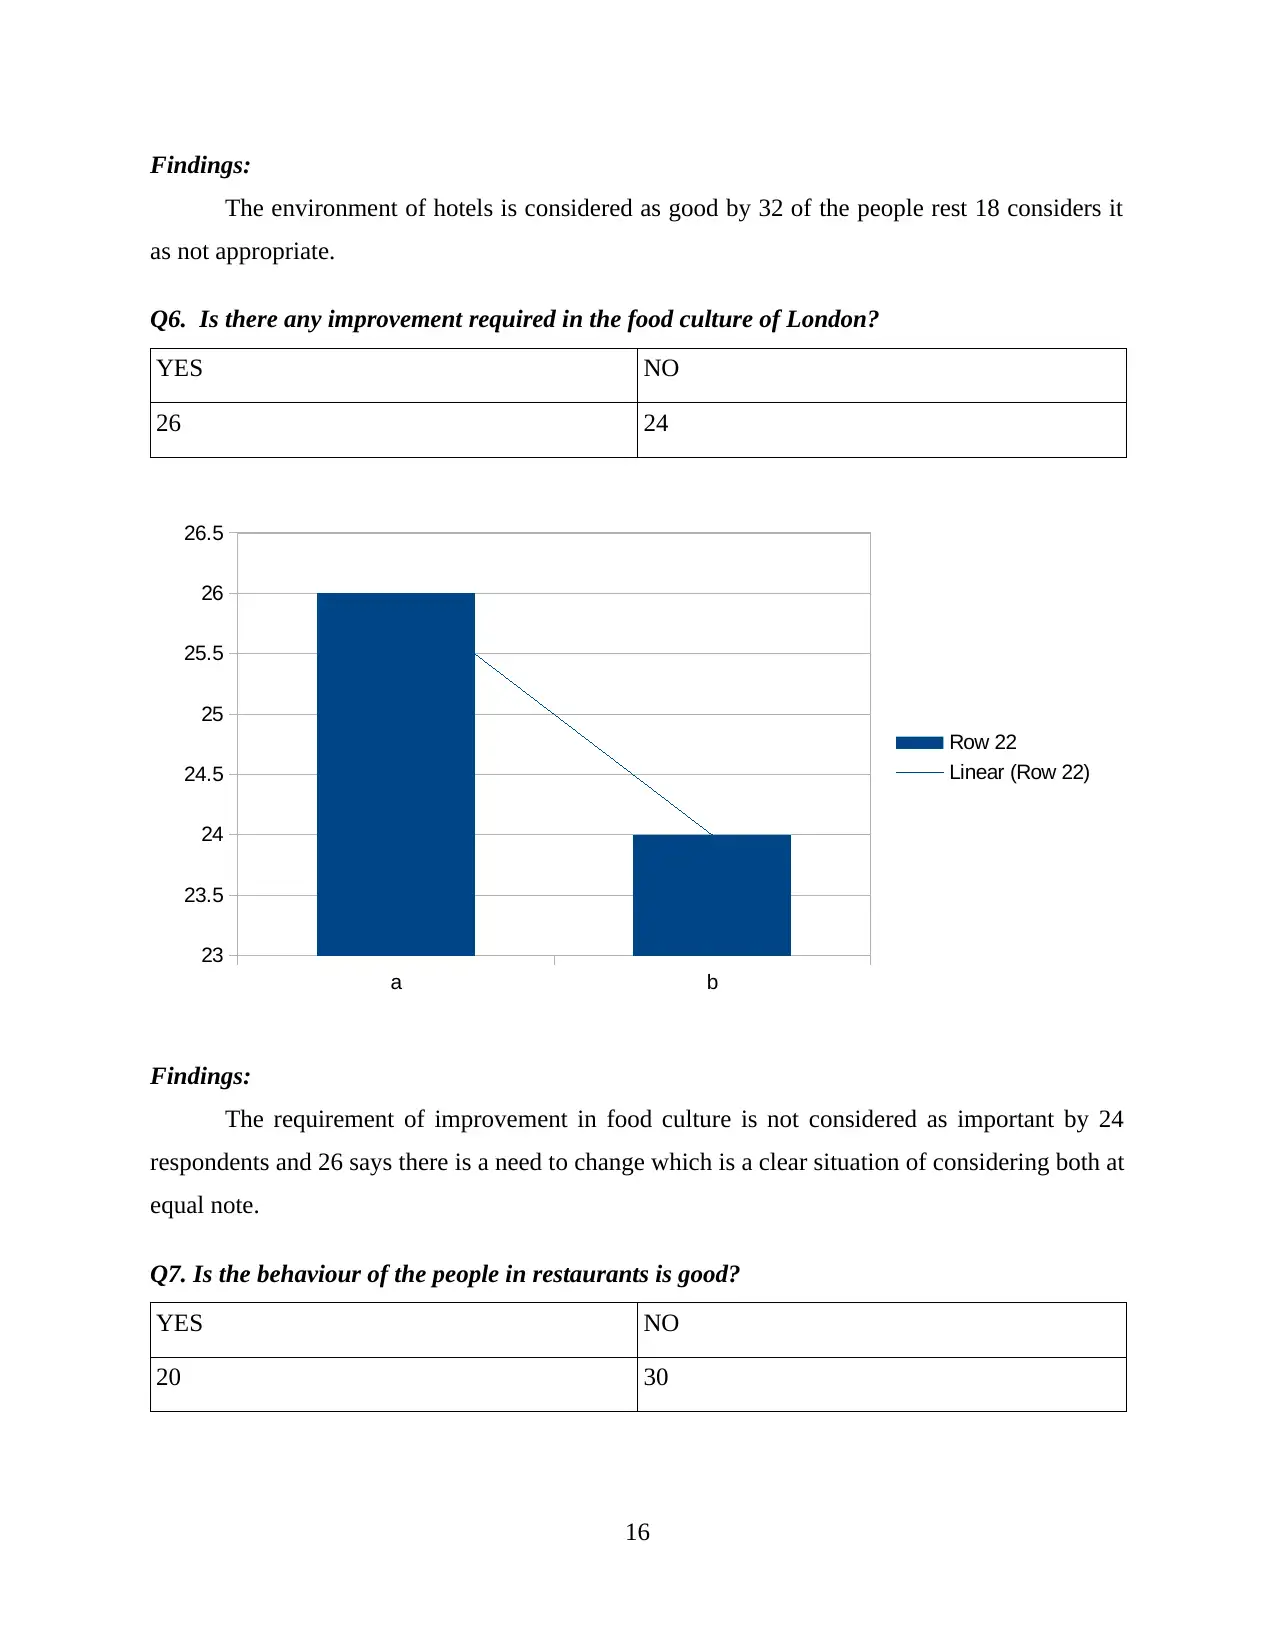
Findings:
The requirement of improvement in food culture is not considered as important by 24
respondents and 26 says there is a need to change which is a clear situation of considering both at
equal note.
Q7. Is the behaviour of the people in restaurants is good?
YES NO
20 30
16
a b
23
23.5
24
24.5
25
25.5
26
26.5
Row 22
Linear (Row 22)
The environment of hotels is considered as good by 32 of the people rest 18 considers it
as not appropriate.
Q6. Is there any improvement required in the food culture of London?
YES NO
26 24
Findings:
The requirement of improvement in food culture is not considered as important by 24
respondents and 26 says there is a need to change which is a clear situation of considering both at
equal note.
Q7. Is the behaviour of the people in restaurants is good?
YES NO
20 30
16
a b
23
23.5
24
24.5
25
25.5
26
26.5
Row 22
Linear (Row 22)
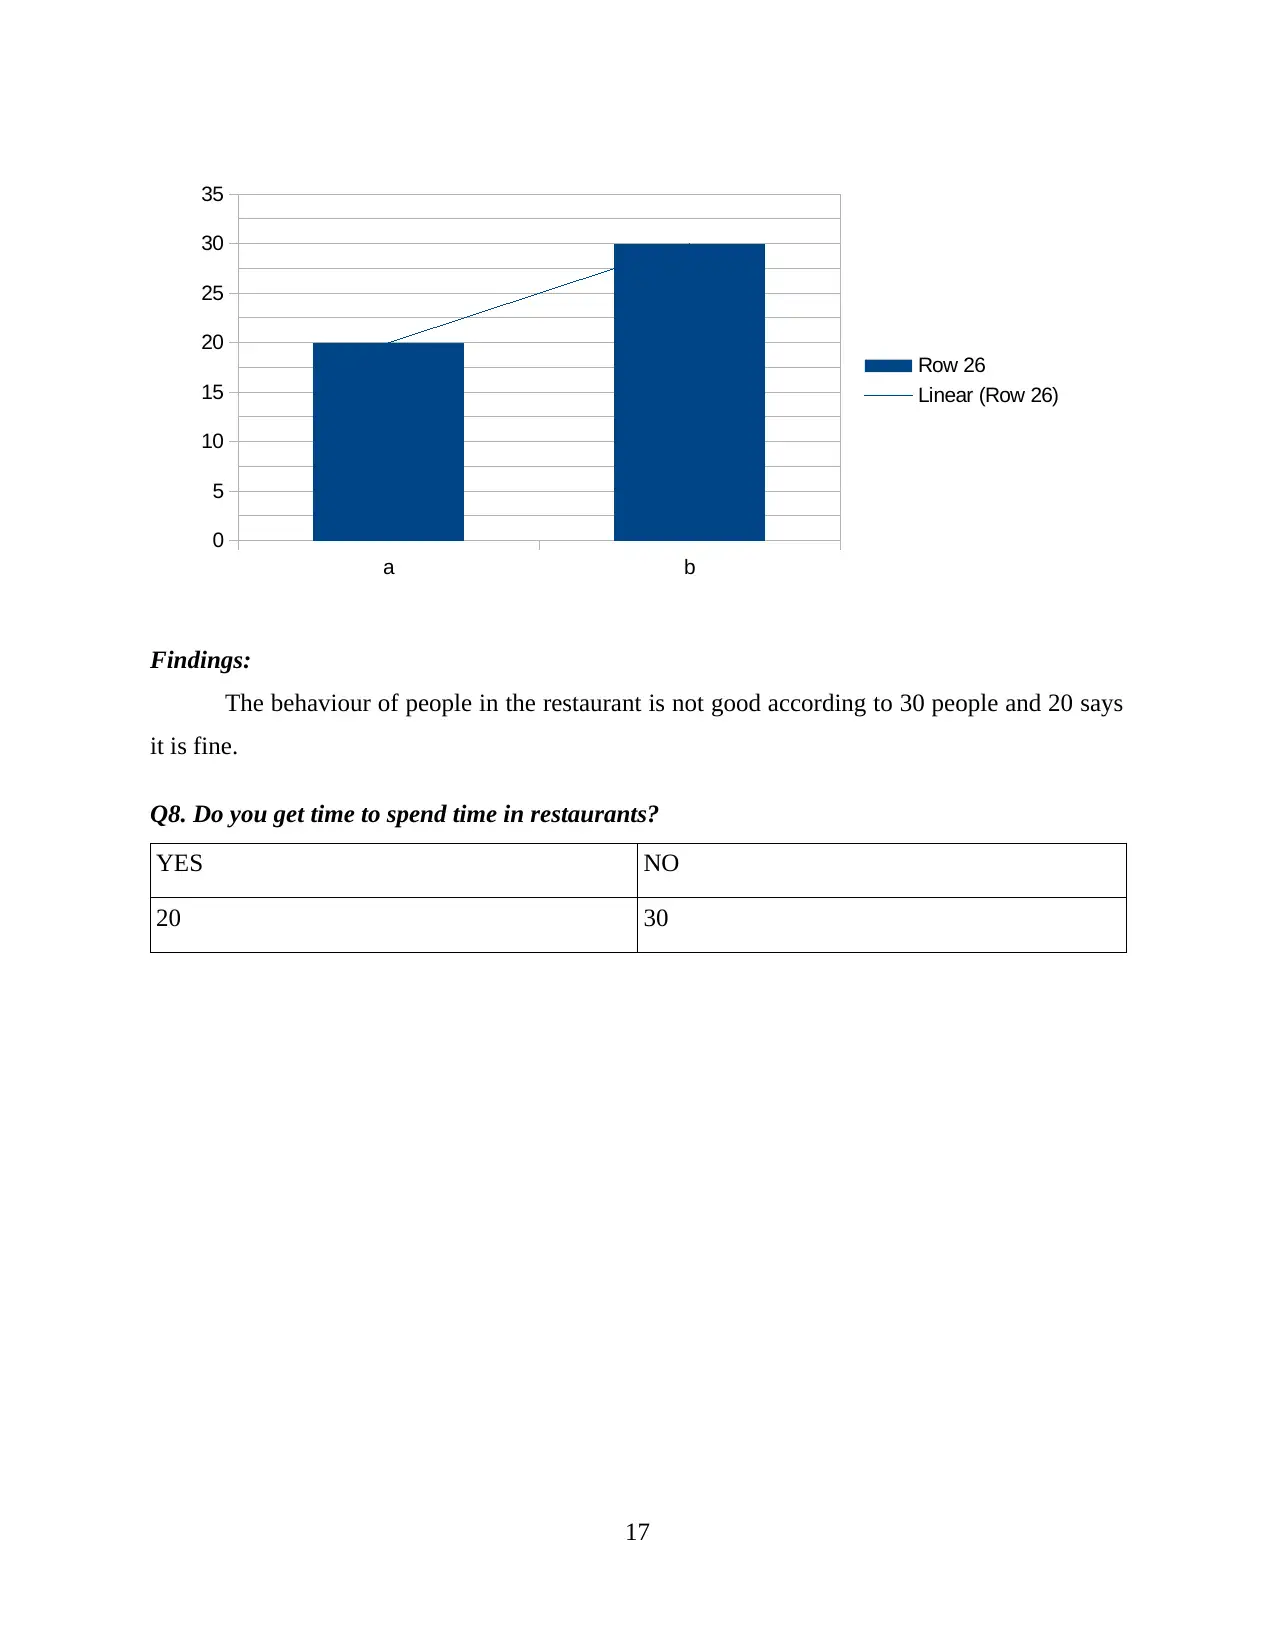
Findings:
The behaviour of people in the restaurant is not good according to 30 people and 20 says
it is fine.
Q8. Do you get time to spend time in restaurants?
YES NO
20 30
17
a b
0
5
10
15
20
25
30
35
Row 26
Linear (Row 26)
The behaviour of people in the restaurant is not good according to 30 people and 20 says
it is fine.
Q8. Do you get time to spend time in restaurants?
YES NO
20 30
17
a b
0
5
10
15
20
25
30
35
Row 26
Linear (Row 26)
Paraphrase This Document
Need a fresh take? Get an instant paraphrase of this document with our AI Paraphraser
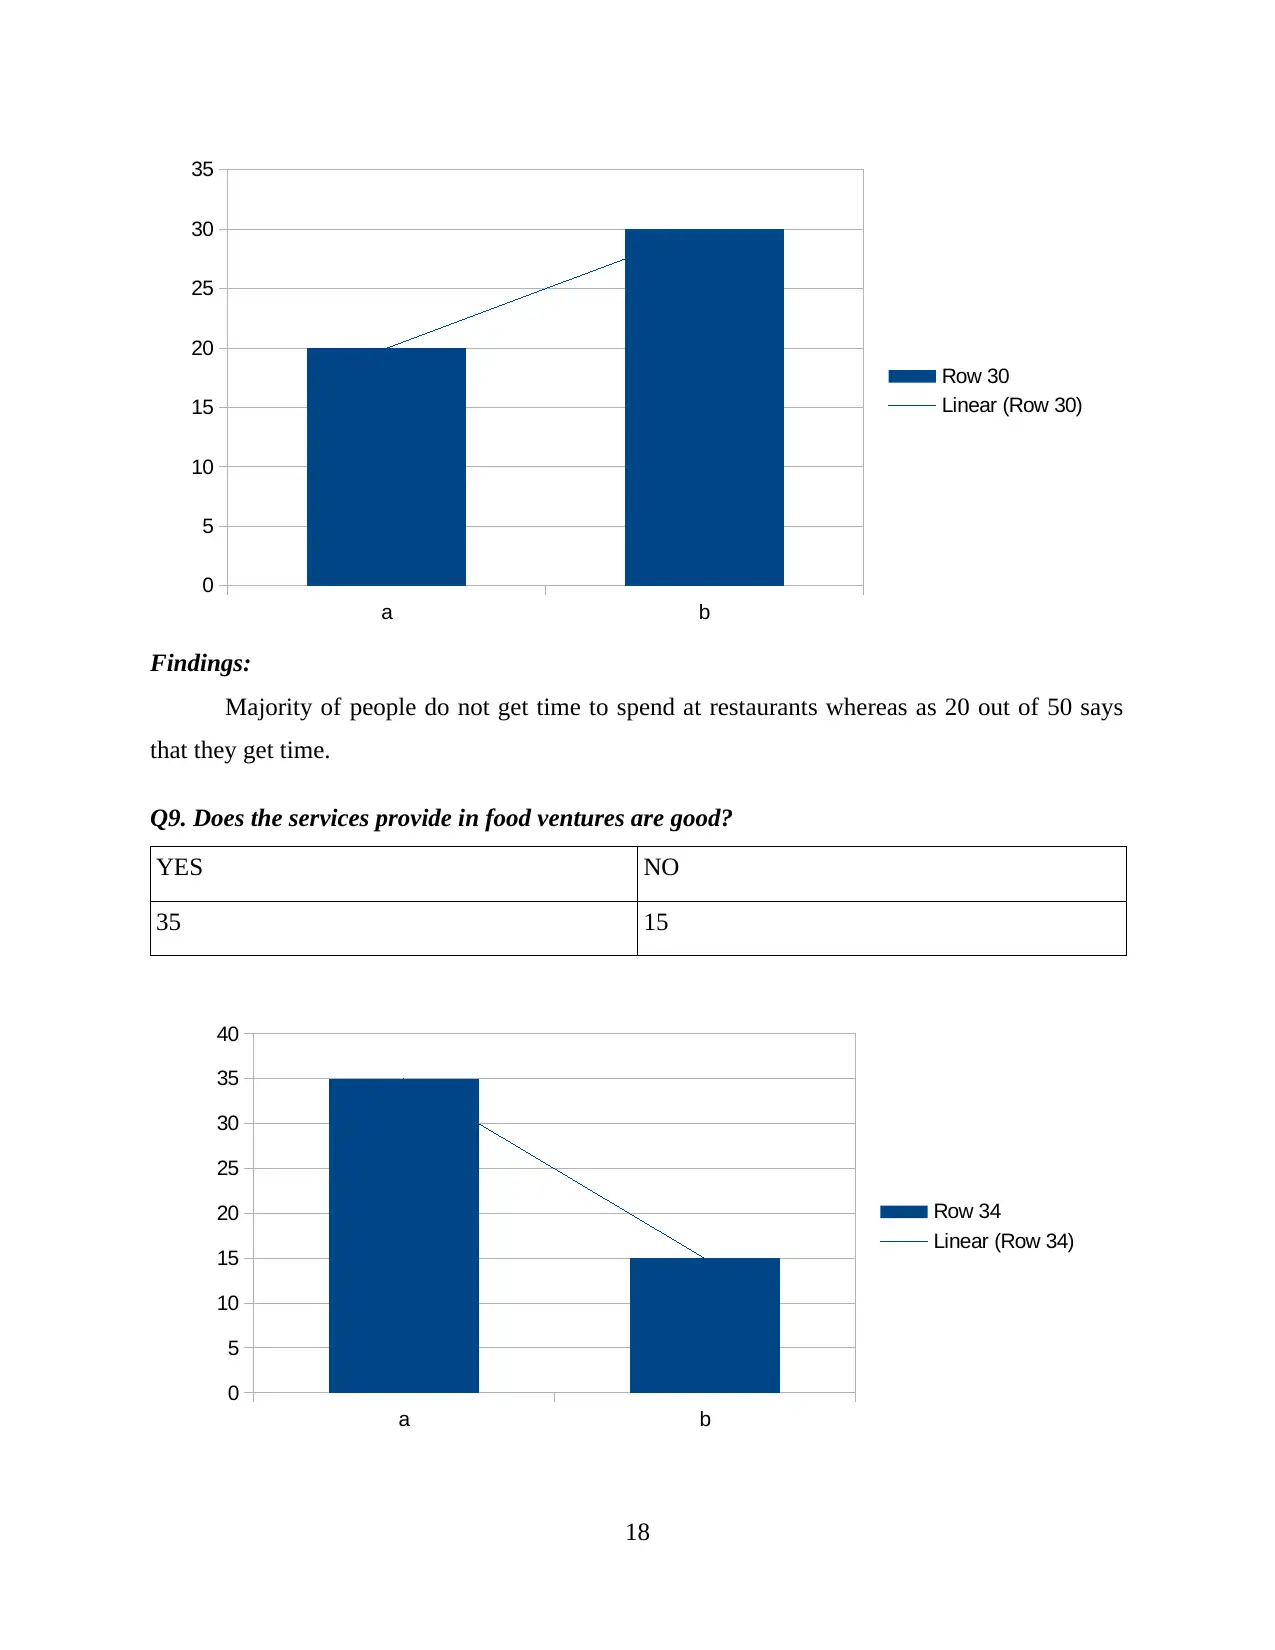
Findings:
Majority of people do not get time to spend at restaurants whereas as 20 out of 50 says
that they get time.
Q9. Does the services provide in food ventures are good?
YES NO
35 15
18
a b
0
5
10
15
20
25
30
35
Row 30
Linear (Row 30)
a b
0
5
10
15
20
25
30
35
40
Row 34
Linear (Row 34)
Majority of people do not get time to spend at restaurants whereas as 20 out of 50 says
that they get time.
Q9. Does the services provide in food ventures are good?
YES NO
35 15
18
a b
0
5
10
15
20
25
30
35
Row 30
Linear (Row 30)
a b
0
5
10
15
20
25
30
35
40
Row 34
Linear (Row 34)
Findings:
The services provided in food venture are considered as good by 35 people which is a
good number and rest 15 says it is not appropriate.
Q10. Is there any requirement to build attractive ambience for restaurant?
YES NO
40 10
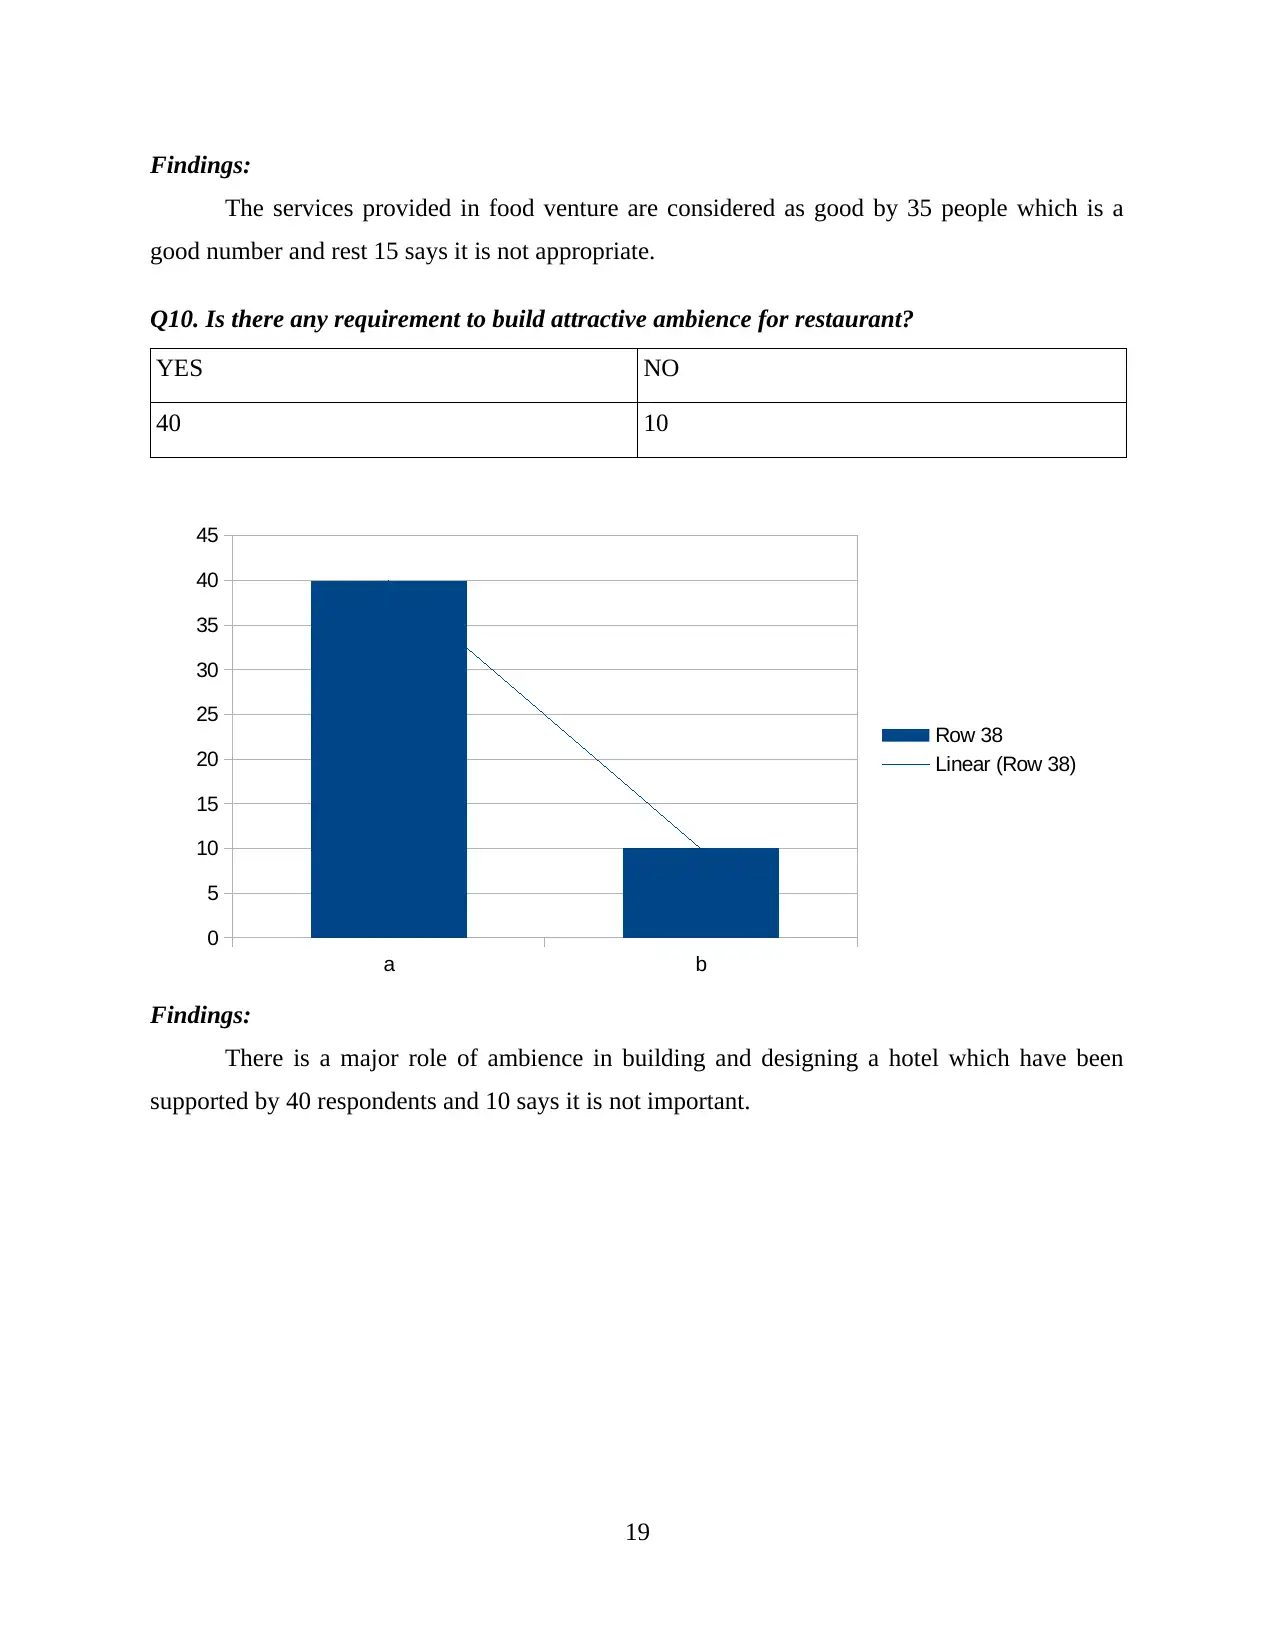
Findings:
There is a major role of ambience in building and designing a hotel which have been
supported by 40 respondents and 10 says it is not important.
19
a b
0
5
10
15
20
25
30
35
40
45
Row 38
Linear (Row 38)
The services provided in food venture are considered as good by 35 people which is a
good number and rest 15 says it is not appropriate.
Q10. Is there any requirement to build attractive ambience for restaurant?
YES NO
40 10
Findings:
There is a major role of ambience in building and designing a hotel which have been
supported by 40 respondents and 10 says it is not important.
19
a b
0
5
10
15
20
25
30
35
40
45
Row 38
Linear (Row 38)
3.3 Business Presentation (Covered in power point presentation)
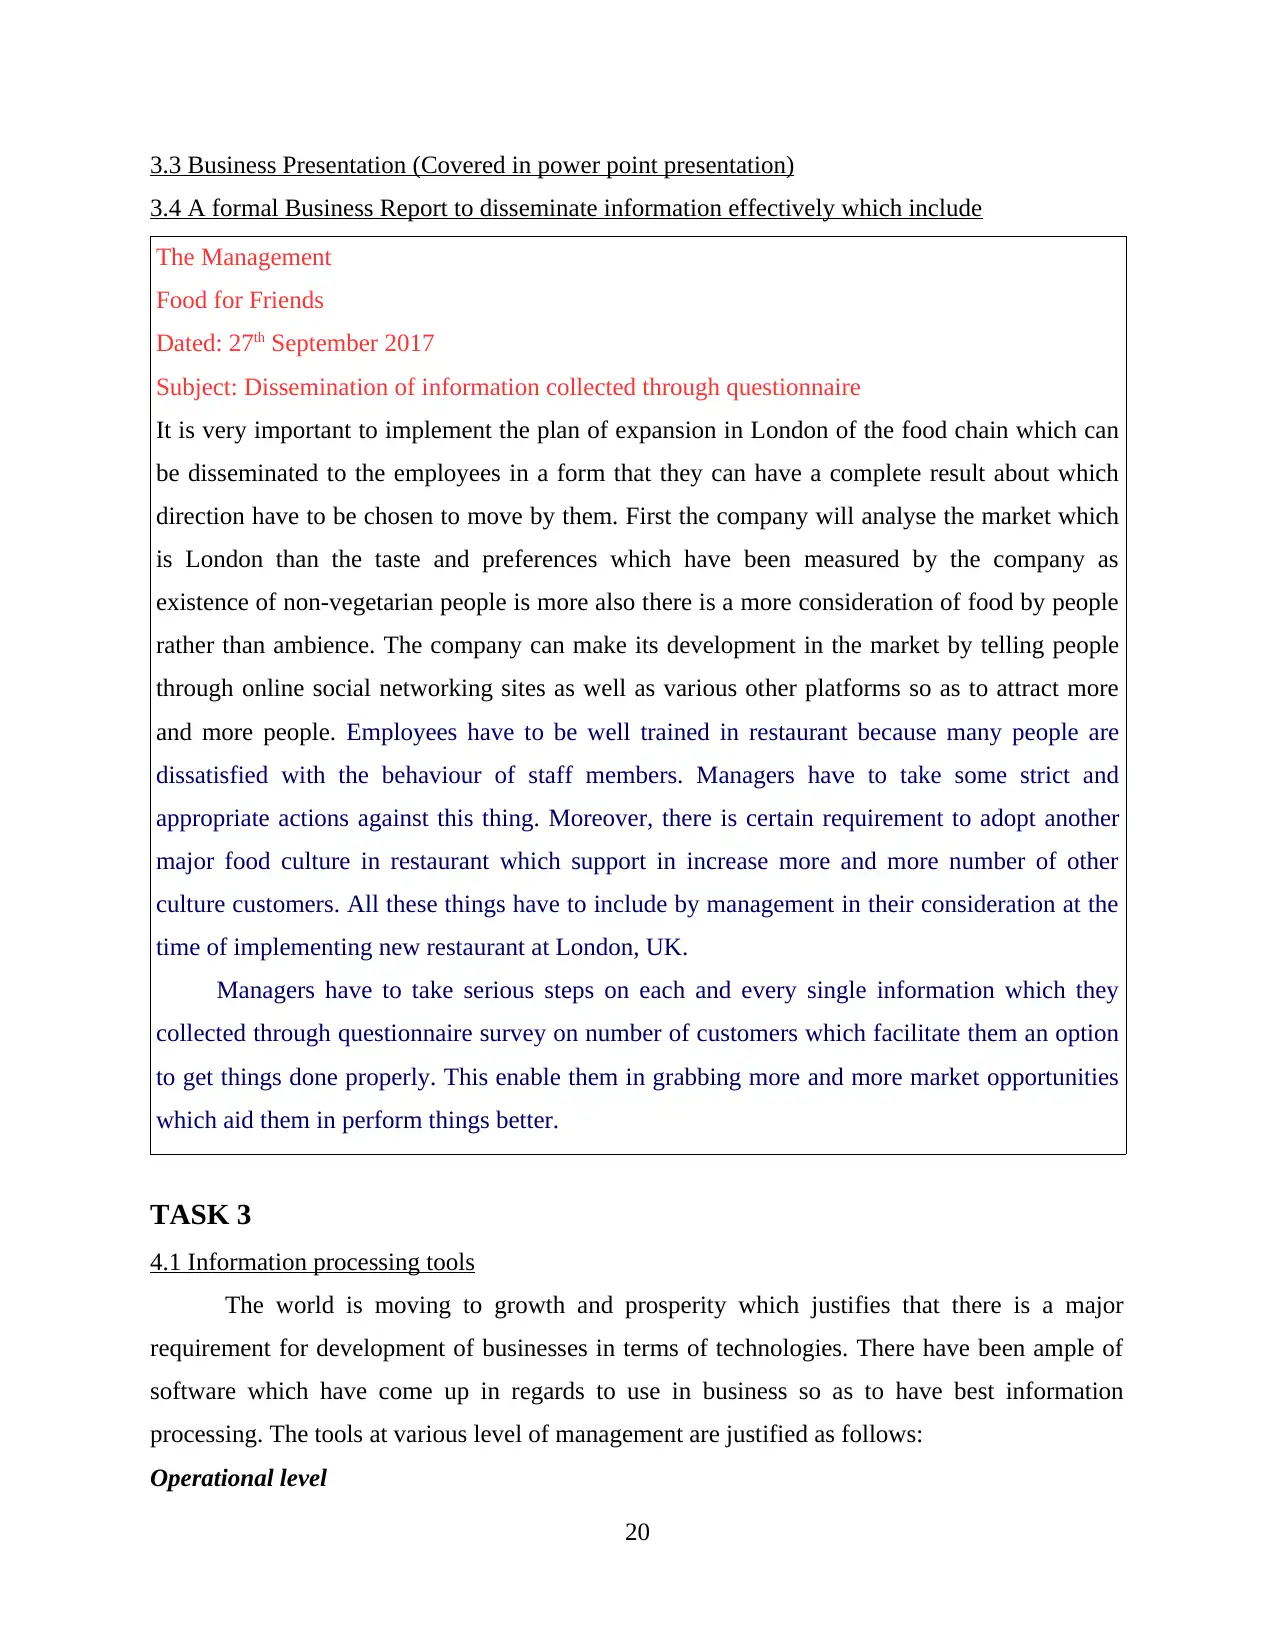
3.4 A formal Business Report to disseminate information effectively which include
The Management
Food for Friends
Dated: 27th September 2017
Subject: Dissemination of information collected through questionnaire
It is very important to implement the plan of expansion in London of the food chain which can
be disseminated to the employees in a form that they can have a complete result about which
direction have to be chosen to move by them. First the company will analyse the market which
is London than the taste and preferences which have been measured by the company as
existence of non-vegetarian people is more also there is a more consideration of food by people
rather than ambience. The company can make its development in the market by telling people
through online social networking sites as well as various other platforms so as to attract more
and more people. Employees have to be well trained in restaurant because many people are
dissatisfied with the behaviour of staff members. Managers have to take some strict and
appropriate actions against this thing. Moreover, there is certain requirement to adopt another
major food culture in restaurant which support in increase more and more number of other
culture customers. All these things have to include by management in their consideration at the
time of implementing new restaurant at London, UK.
Managers have to take serious steps on each and every single information which they
collected through questionnaire survey on number of customers which facilitate them an option
to get things done properly. This enable them in grabbing more and more market opportunities
which aid them in perform things better.
TASK 3
4.1 Information processing tools
The world is moving to growth and prosperity which justifies that there is a major
requirement for development of businesses in terms of technologies. There have been ample of
software which have come up in regards to use in business so as to have best information
processing. The tools at various level of management are justified as follows:
Operational level
20
Secure Best Marks with AI Grader
Need help grading? Try our AI Grader for instant feedback on your assignments.
This section of an organisation directly relates to the employees who are working in it
and data regarding them have to be circulated (Popovič, 2012). For this many software's like
employee entry and exit software, attendance software to know how many employees are present
in a company can be obtained this will help in conveying messages through servers which are
acquired by company.
Tactical level
This level of management uses software's which help in analysing data that is Ms excel
etc. so as to give and interpret the information which have to be conveyed.
Management level
At this level information regarding whole process which is going on in a company have
to be maintained which is done by various software's to measure performance of employees and
keeping them updated with them (Groebner and et. al., 2011).
Various information processing tool of Food for Friends are describe as below which can
used by managers for effective information transformation: Transaction processing tool: Collection, modification and retrieval of data of business
get done through transnational processing system. It is reliable in nature and provide
proper information of all the messages which are transform from top to bottom. This
process work when proper working pattern has been used. A major advantage of using
this system is to make information safe and modify it according to time frame by proper
back up time which arise due to human failure, system failure etc.
Decision support system: For taking beneficial decision in business, organisation have to
use their data in an appropriate manner. Decision support system is a tool which facilitate
the option of decision making easy and appropriate by reviewing information on regular
time frame.
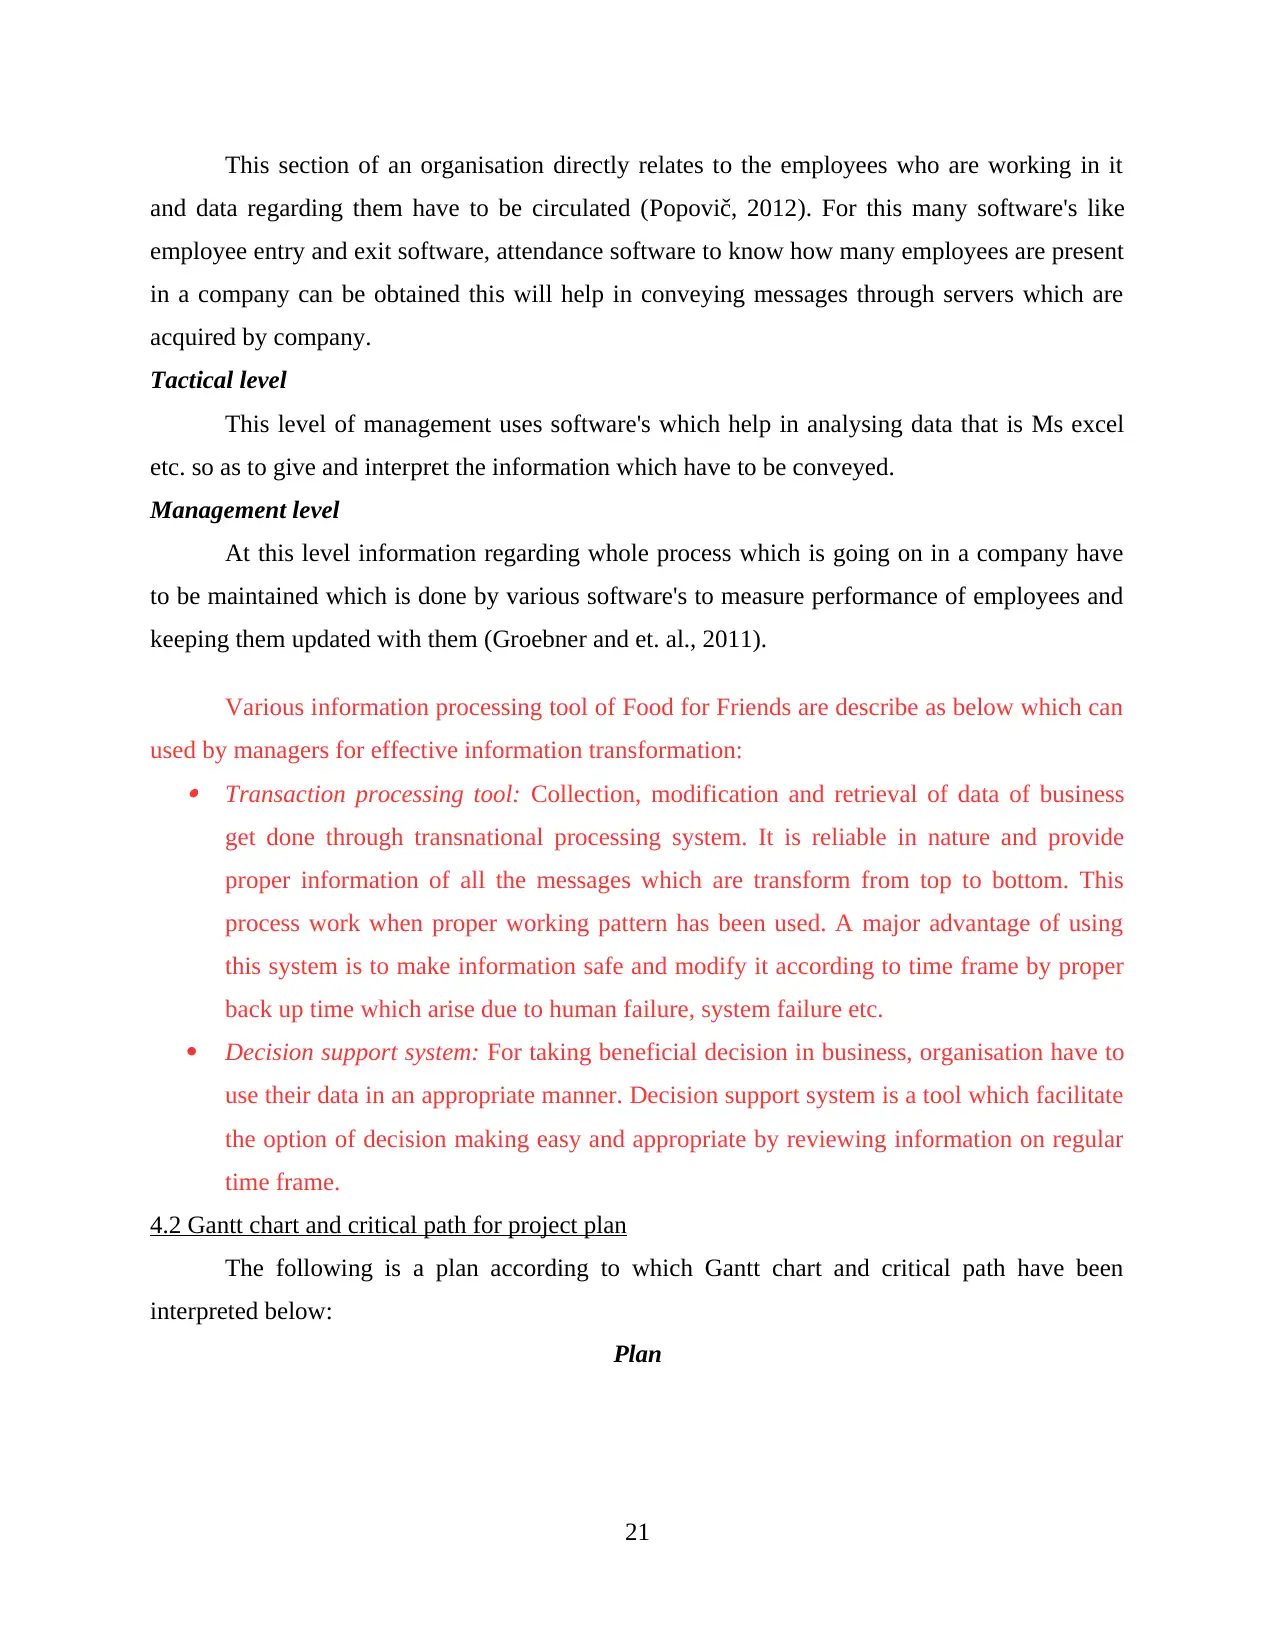
4.2 Gantt chart and critical path for project plan
The following is a plan according to which Gantt chart and critical path have been
interpreted below:
Plan
21
and data regarding them have to be circulated (Popovič, 2012). For this many software's like
employee entry and exit software, attendance software to know how many employees are present
in a company can be obtained this will help in conveying messages through servers which are
acquired by company.
Tactical level
This level of management uses software's which help in analysing data that is Ms excel
etc. so as to give and interpret the information which have to be conveyed.
Management level
At this level information regarding whole process which is going on in a company have
to be maintained which is done by various software's to measure performance of employees and
keeping them updated with them (Groebner and et. al., 2011).
Various information processing tool of Food for Friends are describe as below which can
used by managers for effective information transformation: Transaction processing tool: Collection, modification and retrieval of data of business
get done through transnational processing system. It is reliable in nature and provide
proper information of all the messages which are transform from top to bottom. This
process work when proper working pattern has been used. A major advantage of using
this system is to make information safe and modify it according to time frame by proper
back up time which arise due to human failure, system failure etc.
Decision support system: For taking beneficial decision in business, organisation have to
use their data in an appropriate manner. Decision support system is a tool which facilitate
the option of decision making easy and appropriate by reviewing information on regular
time frame.
4.2 Gantt chart and critical path for project plan
The following is a plan according to which Gantt chart and critical path have been
interpreted below:
Plan
21
Gantt Chart
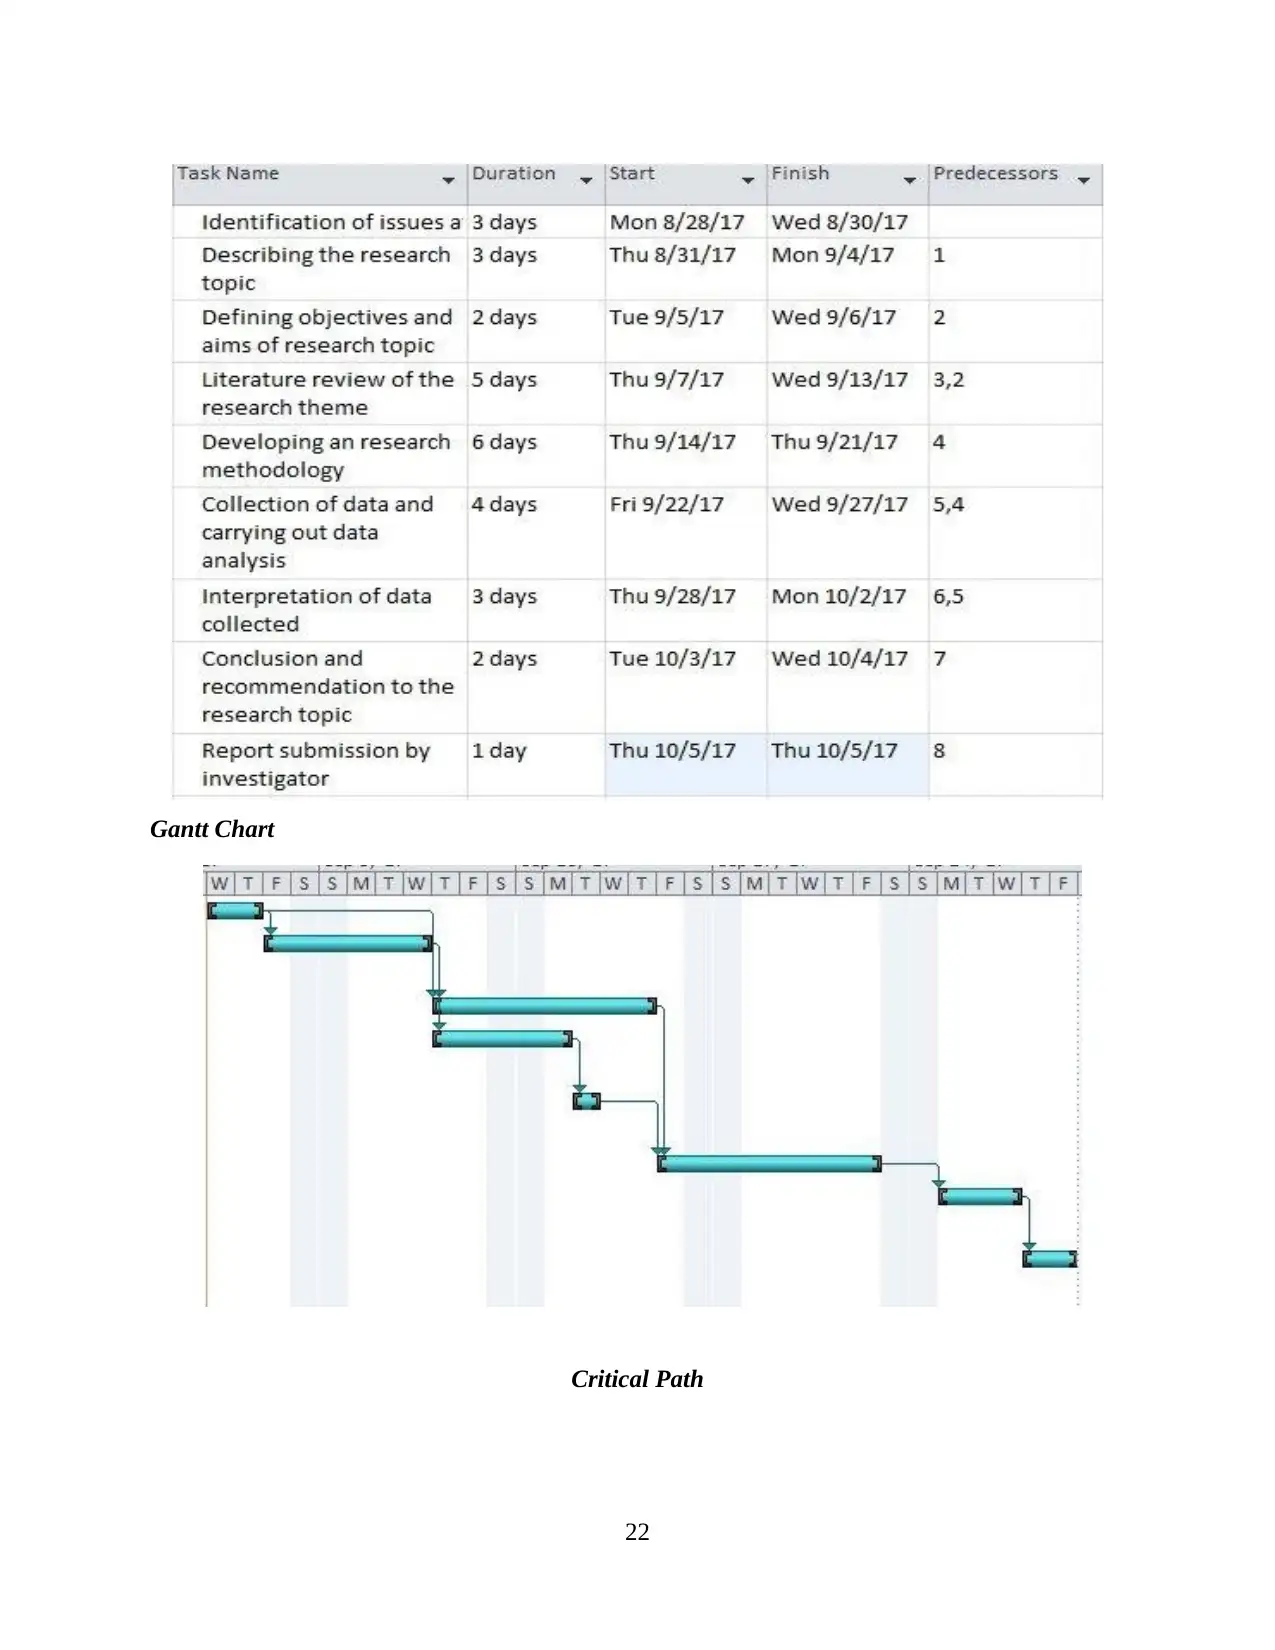
Critical Path
22
Critical Path
22
1+2+4+5+6+7+8 = 33 days
1+3+6+7+8= 25 days
Suitable critical path system for the project is around 25 days which have to take in
account by managers of an organisation so that they are going to take appropriate outcomes in
long term context.
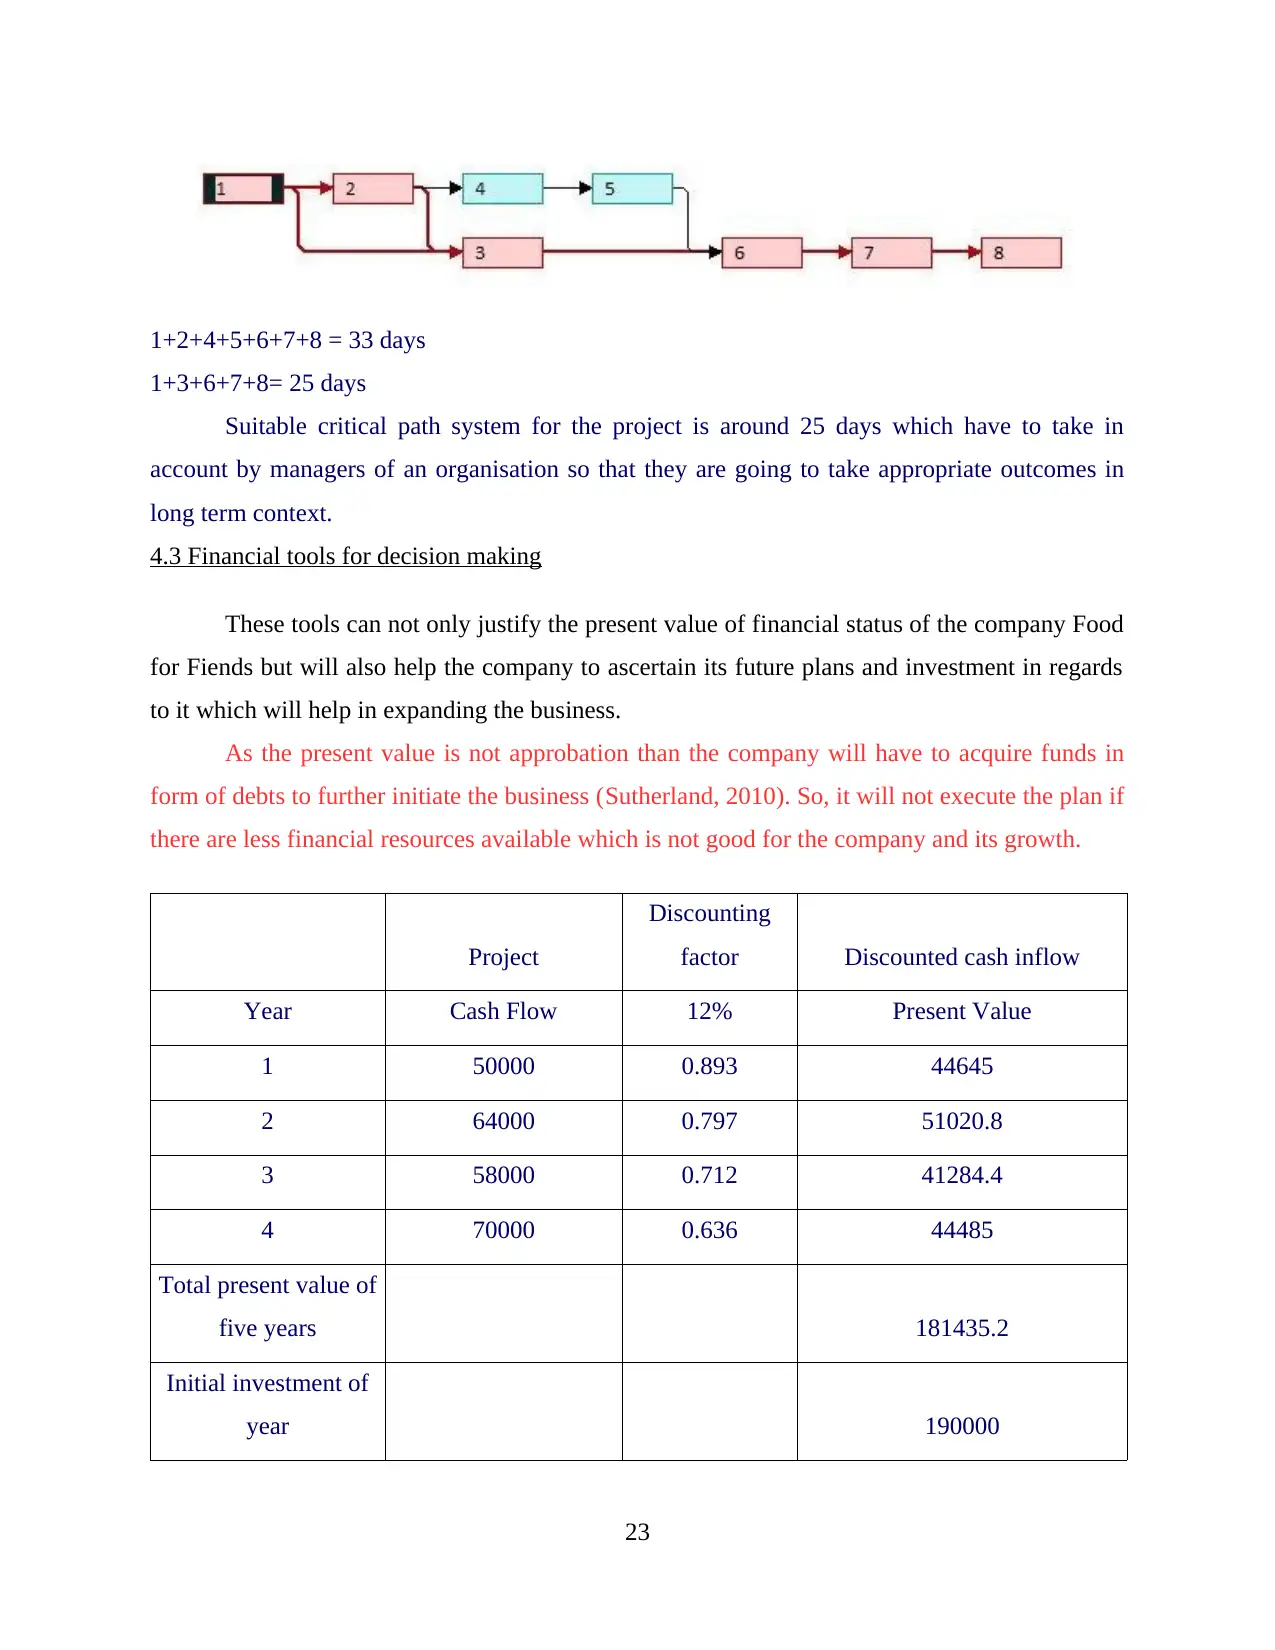
4.3 Financial tools for decision making
These tools can not only justify the present value of financial status of the company Food
for Fiends but will also help the company to ascertain its future plans and investment in regards
to it which will help in expanding the business.
As the present value is not approbation than the company will have to acquire funds in
form of debts to further initiate the business (Sutherland, 2010). So, it will not execute the plan if
there are less financial resources available which is not good for the company and its growth.
Project
Discounting
factor Discounted cash inflow
Year Cash Flow 12% Present Value
1 50000 0.893 44645
2 64000 0.797 51020.8
3 58000 0.712 41284.4
4 70000 0.636 44485
Total present value of
five years 181435.2
Initial investment of
year 190000
23
1+3+6+7+8= 25 days
Suitable critical path system for the project is around 25 days which have to take in
account by managers of an organisation so that they are going to take appropriate outcomes in
long term context.
4.3 Financial tools for decision making
These tools can not only justify the present value of financial status of the company Food
for Fiends but will also help the company to ascertain its future plans and investment in regards
to it which will help in expanding the business.
As the present value is not approbation than the company will have to acquire funds in
form of debts to further initiate the business (Sutherland, 2010). So, it will not execute the plan if
there are less financial resources available which is not good for the company and its growth.
Project
Discounting
factor Discounted cash inflow
Year Cash Flow 12% Present Value
1 50000 0.893 44645
2 64000 0.797 51020.8
3 58000 0.712 41284.4
4 70000 0.636 44485
Total present value of
five years 181435.2
Initial investment of
year 190000
23
Paraphrase This Document
Need a fresh take? Get an instant paraphrase of this document with our AI Paraphraser
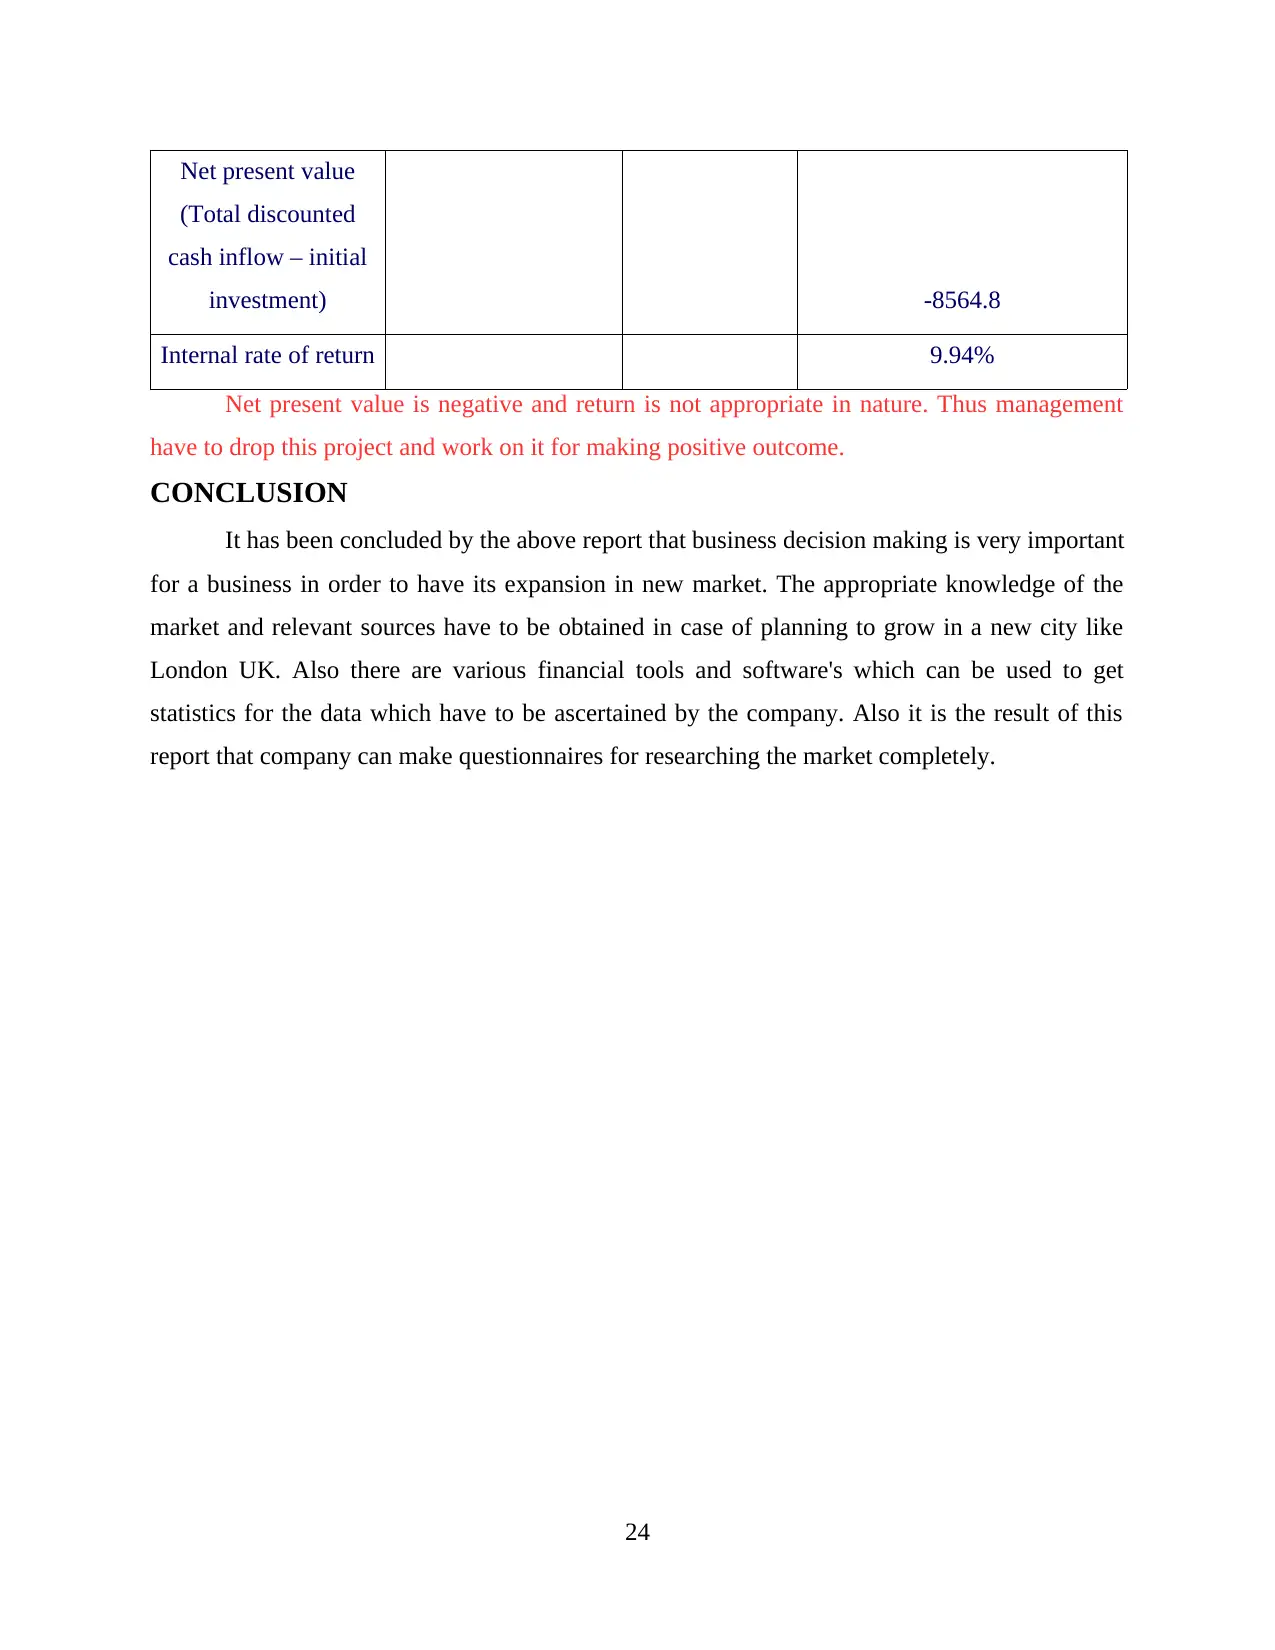
Net present value
(Total discounted
cash inflow – initial
investment) -8564.8
Internal rate of return 9.94%
Net present value is negative and return is not appropriate in nature. Thus management
have to drop this project and work on it for making positive outcome.
CONCLUSION
It has been concluded by the above report that business decision making is very important
for a business in order to have its expansion in new market. The appropriate knowledge of the
market and relevant sources have to be obtained in case of planning to grow in a new city like
London UK. Also there are various financial tools and software's which can be used to get
statistics for the data which have to be ascertained by the company. Also it is the result of this
report that company can make questionnaires for researching the market completely.
24
1 out of 26
Related Documents


Your All-in-One AI-Powered Toolkit for Academic Success.
+13062052269
info@desklib.com
Available 24*7 on WhatsApp / Email
![[object Object]](/_next/static/media/star-bottom.7253800d.svg)
Unlock your academic potential
© 2024 | Zucol Services PVT LTD | All rights reserved.