Business Decision Making: Analyzing Technology's Impact on Retail
VerifiedAdded on 2024/05/30
|25
|3658
|402
Report
AI Summary
This assignment explores the impact of technological advancements and multi-channel shopping on traditional street shops and shopping malls. It employs primary and secondary research methods, with a focus on questionnaire techniques to gather data on changing consumer preferences. The survey, conducted across four student campuses, analyzes how technological innovations influence shopping habits and affect the performance of physical retail spaces. Furthermore, the assignment delves into capital budgeting techniques, including payback period, IRR, and NPV, using practical examples to assess investment viability. The research aims to provide a comprehensive understanding of the evolving retail landscape and the strategic decisions businesses must make to adapt to technological disruptions. Desklib offers more resources for students seeking solved assignments and past papers.

Business decision making
Paraphrase This Document
Need a fresh take? Get an instant paraphrase of this document with our AI Paraphraser
Contents
Introduction......................................................................................................................................3
Task 1...............................................................................................................................................4
Introduction..................................................................................................................................4
a) Create a plan............................................................................................................................4
b) present survey methodology and sampling frame...................................................................4
c) Design questionnaire...............................................................................................................5
Conclusion...................................................................................................................................8
Task 2...............................................................................................................................................9
a) Summarise data........................................................................................................................9
b) Draw conclusions....................................................................................................................9
c) Analyse through the measure of dispersion...........................................................................10
d) Analyse usefulness of quartiles, percentiles and correlation coefficient...............................10
Task 3.............................................................................................................................................12
a) Produce graphs and draw conclusion....................................................................................12
b) Create trend lines...................................................................................................................16
c) Prepare presentation..............................................................................................................17
d) Present formal report.............................................................................................................18
Task 4.............................................................................................................................................19
a) Define various information processing tools.........................................................................19
b) Network diagram..................................................................................................................19
c) Use financial tools.................................................................................................................20
d) Calculate NPV.......................................................................................................................21
e) Calculate IRR........................................................................................................................22
Conclusion:....................................................................................................................................23
References......................................................................................................................................24
Introduction:
This assignment depicts about the adverse impact placed over the street shops and shopping
malls due to innovation arrived due to technology and the change brought in by multi-channel
shopping. In order to analyse the change, research is conducted through two research methods
namely, primary and secondary method. The questionnaire technique is the main tool to analyse
the change impact over malls and shops. The assignment also conducts a segment for analysing
the capital budgeting techniques and techniques like payback period, IRR and NPV are further
analysed through practical example. Overall, the research would aid in concluding the end
result of a research topic.
⊘ This is a preview!⊘
Do you want full access?
Subscribe today to unlock all pages.
Trusted by 1+ million students worldwide
Task 1:
Introduction:
This is a survey planning about statistical techniques, data methodologies etc. for assessing the
impact of technology changes and evolution over shops and malls. The survey would be
conducted over student campuses using primary and secondary methods.
a) Create a plan
Survey plan:
Objective: The objective of the survey is to collect data of technology impact over regular
shopping malls and shops.
Research method: There is two research method which will be used namely, primary and
secondary research method. Primary method includes the collection of direct information
through one's own research while secondary method involves assessment of data which already
exist. Thus, both the methods are somewhat directed for making an analysis of the research
topic (Bernard, 2017).
Data collection method: In the primary method, the data collection method which will be used
in questionnaire technique. A questionnaire is a research method instrument which contains
series of questions along with varied options. Respondents are the persons who are served with
the questions provide their views and helps in deriving conclusion (Bernard, 2017).
Questionnaire technique: In this technique, mainly closed-ended questions will be
implemented, different pattern of questions like Likert type; multiple scale questions will be
used. Questions will be mainly related to the likely impact of technological innovation and
changes over shopping habits and the adverse impact over the shopping malls and high street
shops (Bernard, 2017).
Paraphrase This Document
Need a fresh take? Get an instant paraphrase of this document with our AI Paraphraser
b) present survey methodology and sampling frame
Sampling methodology:
In this survey planning, a survey would be conducted over all the students of 4 campuses. The
survey would be conducted over 100 students for analysing their changing shopping
preferences and the benefits which they are availing from such a change.
Sampling frame:
A sampling frame can be understood as a collection of people, known as the population over
which the research would be conducted. For specific research analysis, the population must
have some common characteristics for relevant and accurate analysis. In this research analysis,
young students from different campuses would be taken as population. A larger sampling frame
is better as it provides precise and accurate analysis while small frame does not provide much
relevant but the bug sampling frame analysis is a much more time consuming and requires high
efforts (Bryman, and Bell, 2015).
Sampling types: there are varied types of sampling methods such as quota sampling, random
sampling cluster sampling and stratified sampling. In this survey, random sampling will be used
and a sample would be taken out over 100 students and results and interpretations would be
done (Bryman, and Bell, 2015).
c) Design questionnaire
Questionnaire:
Q1. Do you think shopping habits have largely shifted from face to face to digital?
a) Strongly agree
b) Agree
c) Neutral
d) Strongly disagree
e) Disagree
Q2. Do you find e-commerce trading is more trustful and ease than shopping with high street
and malls?
a) Strongly agree
b) Agree
c) Neutral
d) Strongly disagree
e) Disagree
Q3. Do you still go to high street shops for a specific brand product?
a) Yes
b) Often
c) Seldom
d) No
d) Never
Q4. Do you think that e-commerce trading provides high-quality product?
a) Yes
b) Often
c) Seldom
d) Strongly disagree
e) Disagree
Q2. Do you find e-commerce trading is more trustful and ease than shopping with high street
and malls?
a) Strongly agree
b) Agree
c) Neutral
d) Strongly disagree
e) Disagree
Q3. Do you still go to high street shops for a specific brand product?
a) Yes
b) Often
c) Seldom
d) No
d) Never
Q4. Do you think that e-commerce trading provides high-quality product?
a) Yes
b) Often
c) Seldom
⊘ This is a preview!⊘
Do you want full access?
Subscribe today to unlock all pages.
Trusted by 1+ million students worldwide
d) No
e) Never
Q5. What is the major attraction finds over e-commerce shopping?
a) Price
b) Heavy discounts and offers
c) Cashback offers
d) Easy delivery and return back options
e) Same quality
Q6. Do you think street shops and malls would not exist much in coming future?
a) Yes
b) Maybe
c) Not sure
d) No
e) Never
Q7. What is the most likely thing you like about shopping at shopping malls and street shops?
a) Personal experience
b) Customer satisfaction
c) Good discounts and offers
d) No issue with colour or material requirement
e) Easy availability
e) Never
Q5. What is the major attraction finds over e-commerce shopping?
a) Price
b) Heavy discounts and offers
c) Cashback offers
d) Easy delivery and return back options
e) Same quality
Q6. Do you think street shops and malls would not exist much in coming future?
a) Yes
b) Maybe
c) Not sure
d) No
e) Never
Q7. What is the most likely thing you like about shopping at shopping malls and street shops?
a) Personal experience
b) Customer satisfaction
c) Good discounts and offers
d) No issue with colour or material requirement
e) Easy availability
Paraphrase This Document
Need a fresh take? Get an instant paraphrase of this document with our AI Paraphraser
Q8. What do you think has put adversely affected malls and shops?
a) High technological advancement
b) Ease availability of e-commerce trading
c) Good customer services
d) Multi-channel shopping
e) In sync with high tech lifestyle
Conclusion:
The above survey plan has depicted that in primary method, questionnaire technique will be
used for surveying purpose and survey would done over 100 persons through random sampling
method to derive at a precise and relevant analysis.
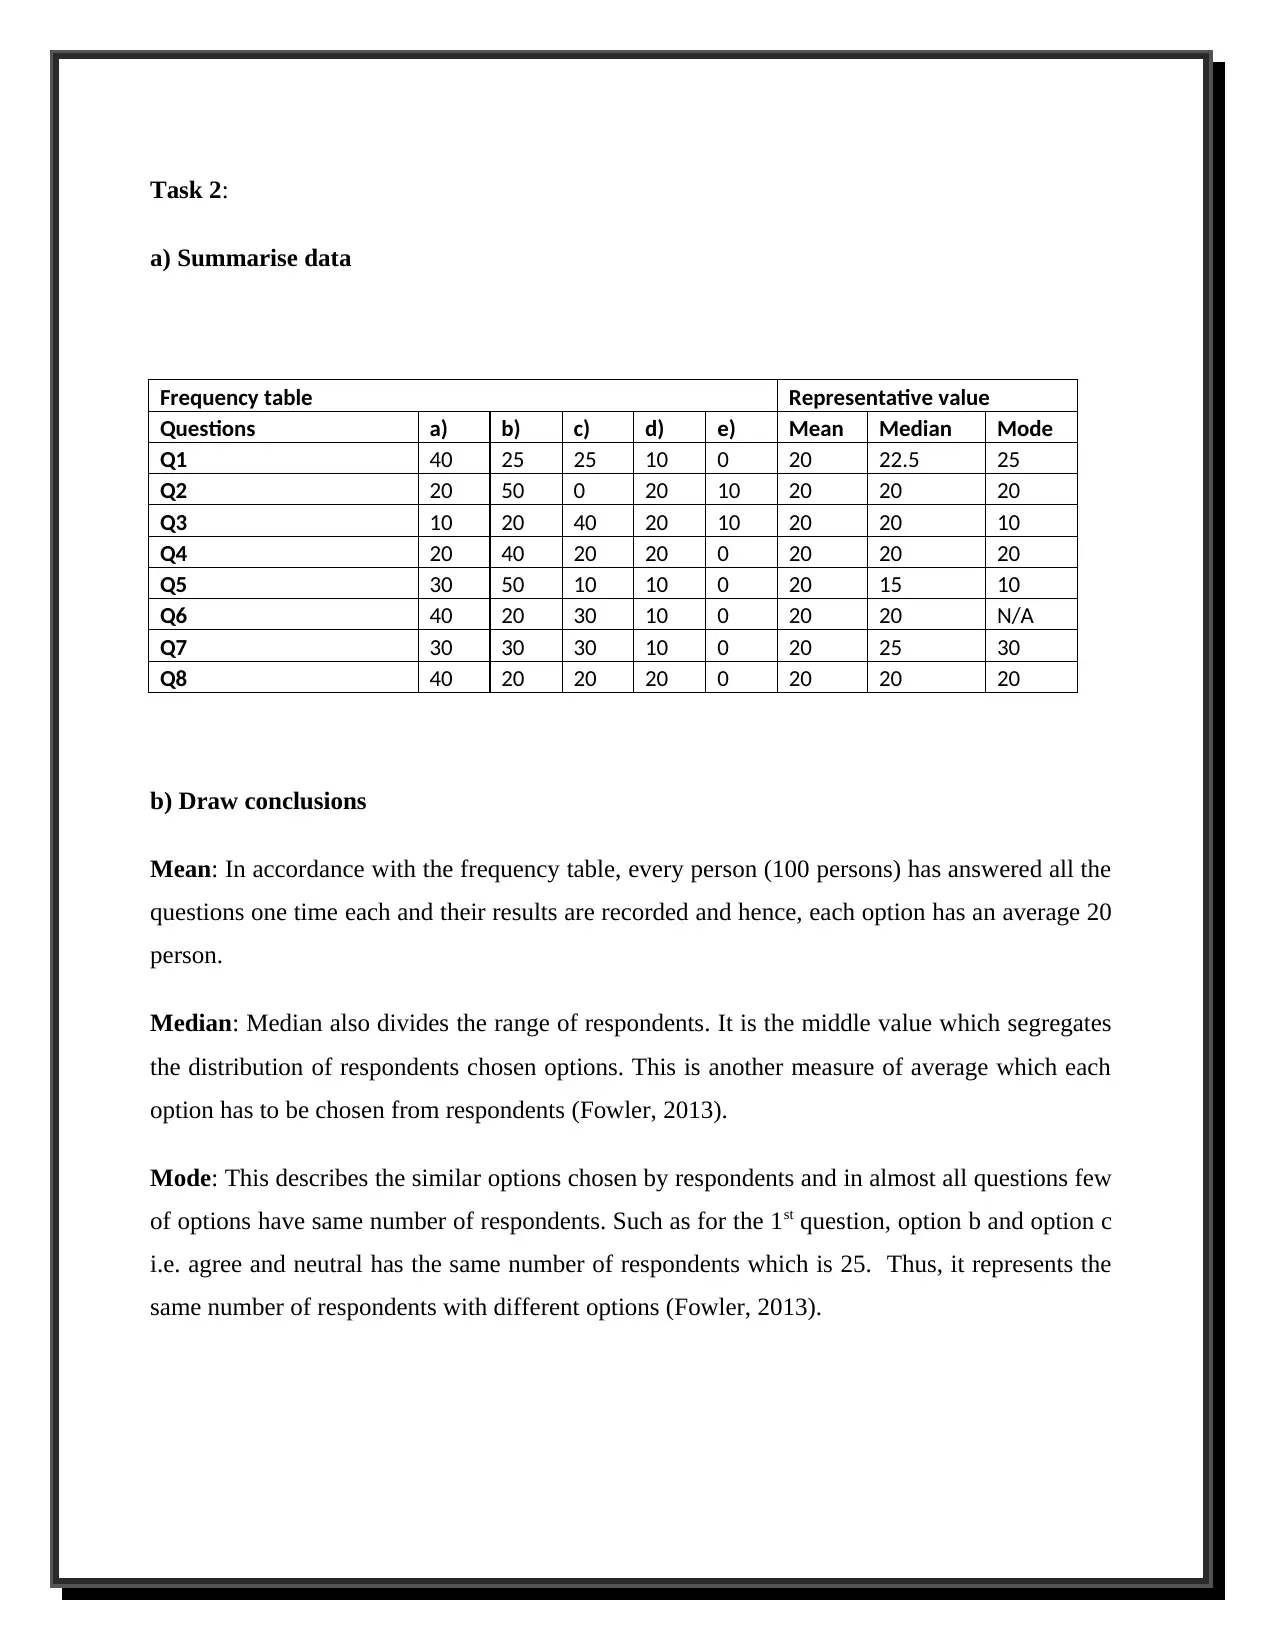
Task 2:
a) Summarise data
Frequency table Representative value
Questions a) b) c) d) e) Mean Median Mode
Q1 40 25 25 10 0 20 22.5 25
Q2 20 50 0 20 10 20 20 20
Q3 10 20 40 20 10 20 20 10
Q4 20 40 20 20 0 20 20 20
Q5 30 50 10 10 0 20 15 10
Q6 40 20 30 10 0 20 20 N/A
Q7 30 30 30 10 0 20 25 30
Q8 40 20 20 20 0 20 20 20
b) Draw conclusions
Mean: In accordance with the frequency table, every person (100 persons) has answered all the
questions one time each and their results are recorded and hence, each option has an average 20
person.
Median: Median also divides the range of respondents. It is the middle value which segregates
the distribution of respondents chosen options. This is another measure of average which each
option has to be chosen from respondents (Fowler, 2013).
Mode: This describes the similar options chosen by respondents and in almost all questions few
of options have same number of respondents. Such as for the 1st question, option b and option c
i.e. agree and neutral has the same number of respondents which is 25. Thus, it represents the
same number of respondents with different options (Fowler, 2013).
⊘ This is a preview!⊘
Do you want full access?
Subscribe today to unlock all pages.
Trusted by 1+ million students worldwide
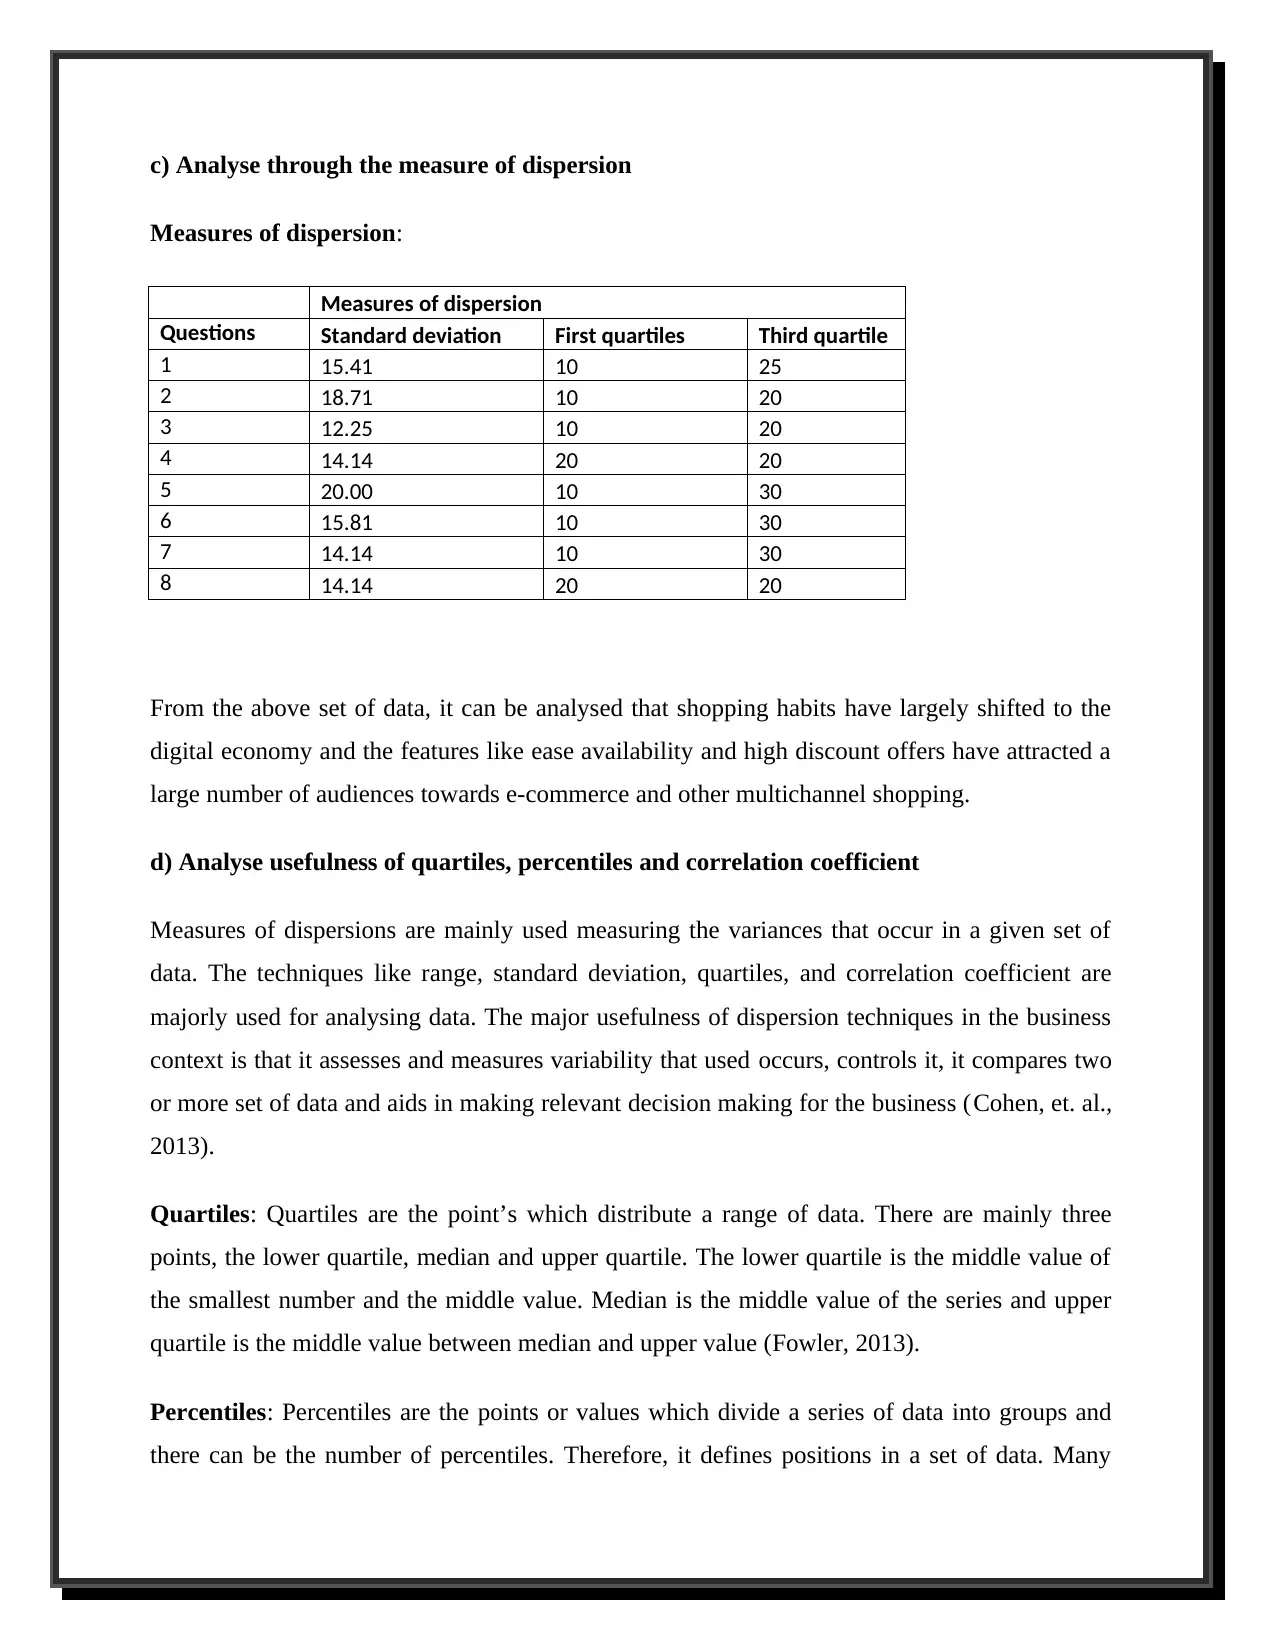
c) Analyse through the measure of dispersion
Measures of dispersion:
Measures of dispersion
Questions Standard deviation First quartiles Third quartile
1 15.41 10 25
2 18.71 10 20
3 12.25 10 20
4 14.14 20 20
5 20.00 10 30
6 15.81 10 30
7 14.14 10 30
8 14.14 20 20
From the above set of data, it can be analysed that shopping habits have largely shifted to the
digital economy and the features like ease availability and high discount offers have attracted a
large number of audiences towards e-commerce and other multichannel shopping.
d) Analyse usefulness of quartiles, percentiles and correlation coefficient
Measures of dispersions are mainly used measuring the variances that occur in a given set of
data. The techniques like range, standard deviation, quartiles, and correlation coefficient are
majorly used for analysing data. The major usefulness of dispersion techniques in the business
context is that it assesses and measures variability that used occurs, controls it, it compares two
or more set of data and aids in making relevant decision making for the business (Cohen, et. al.,
2013).
Quartiles: Quartiles are the point’s which distribute a range of data. There are mainly three
points, the lower quartile, median and upper quartile. The lower quartile is the middle value of
the smallest number and the middle value. Median is the middle value of the series and upper
quartile is the middle value between median and upper value (Fowler, 2013).
Percentiles: Percentiles are the points or values which divide a series of data into groups and
there can be the number of percentiles. Therefore, it defines positions in a set of data. Many
Paraphrase This Document
Need a fresh take? Get an instant paraphrase of this document with our AI Paraphraser

organisations use this technique for setting position in the data for customer requirement and
satisfaction (Cohen, et. al., 2013).
Correlation coefficient: This technique is used for setting a relationship between two
variables (one dependent and independent). It records and measures the effect over one due to
movement on other and helps business person to analyse the manner in which one variable
would react when any change occurs in the independent one (Omotayo, 2015).
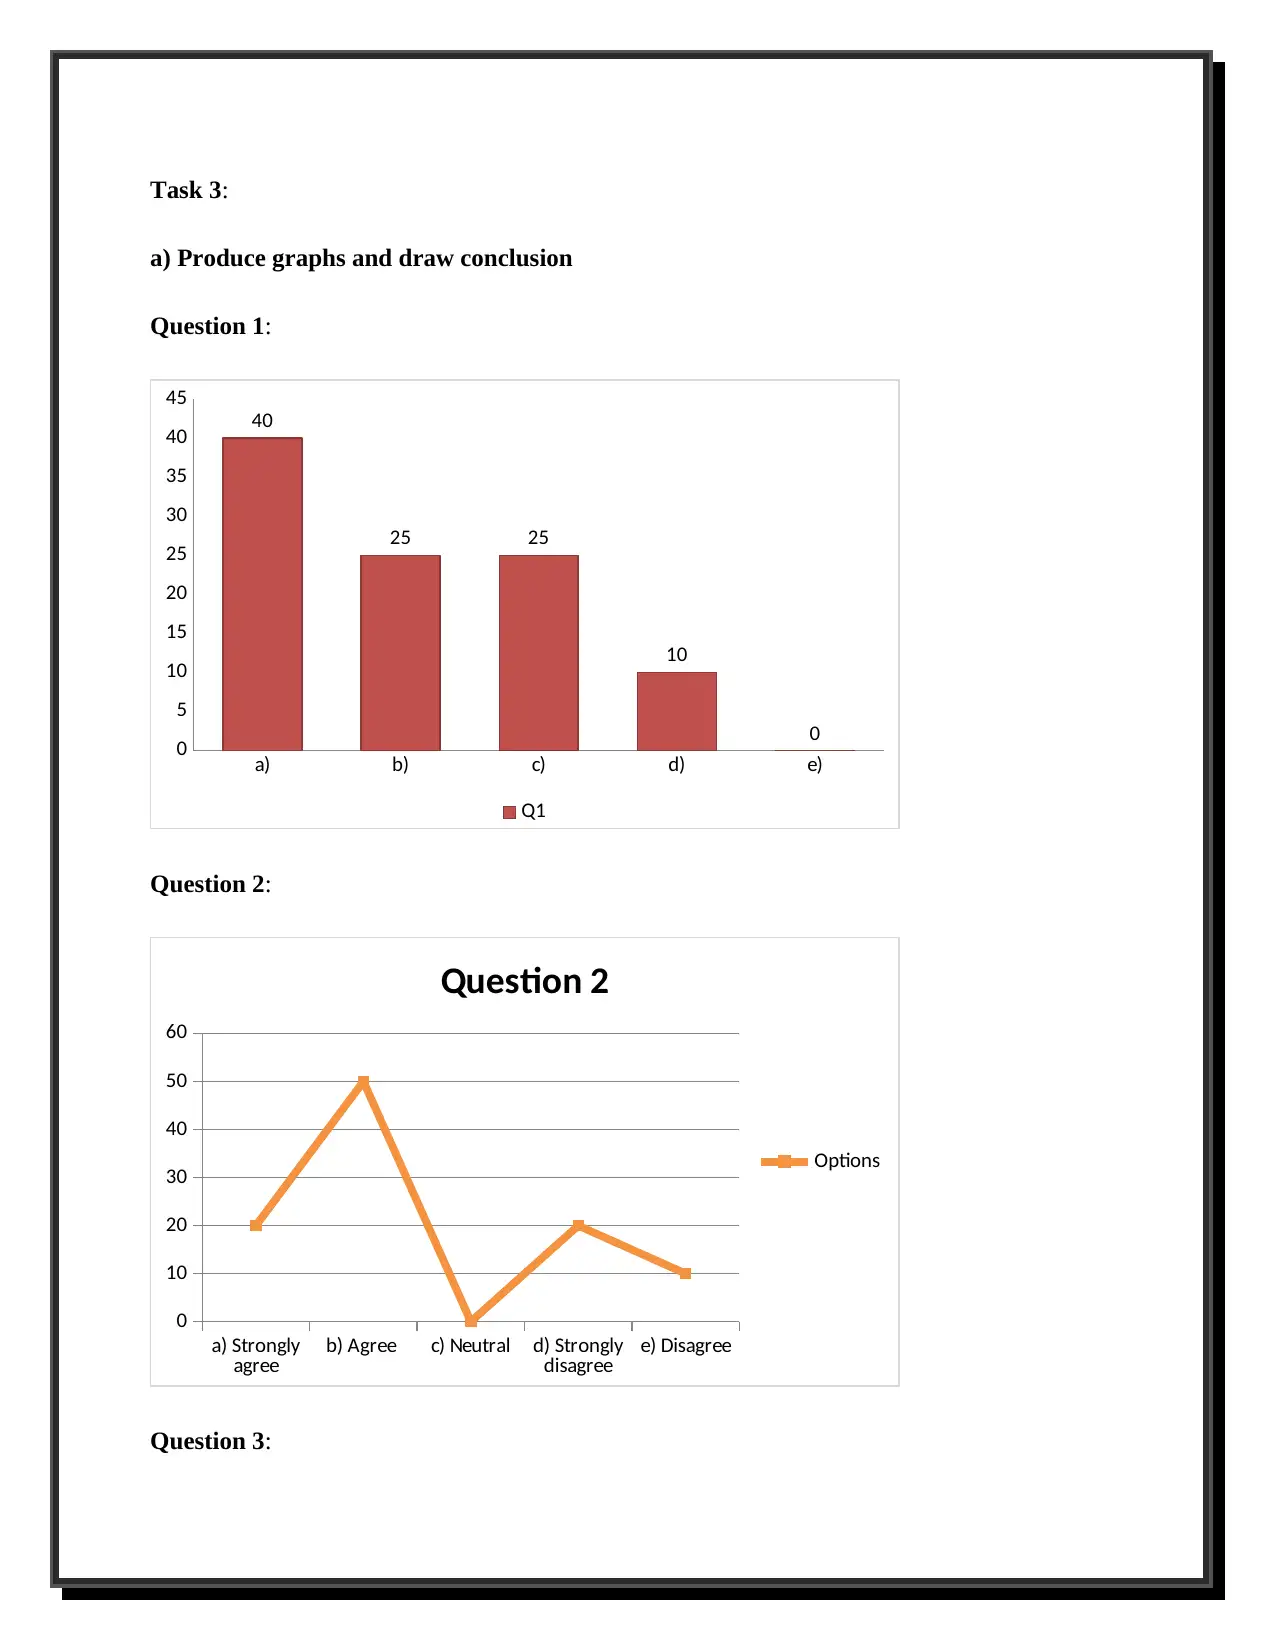
Task 3:
a) Produce graphs and draw conclusion
Question 1:
a) b) c) d) e)
0
5
10
15
20
25
30
35
40
45
40
25 25
10
0
Q1
Question 2:
a) Strongly
agree b) Agree c) Neutral d) Strongly
disagree e) Disagree
0
10
20
30
40
50
60
Question 2
Options
Question 3:
a) Produce graphs and draw conclusion
Question 1:
a) b) c) d) e)
0
5
10
15
20
25
30
35
40
45
40
25 25
10
0
Q1
Question 2:
a) Strongly
agree b) Agree c) Neutral d) Strongly
disagree e) Disagree
0
10
20
30
40
50
60
Question 2
Options
Question 3:
⊘ This is a preview!⊘
Do you want full access?
Subscribe today to unlock all pages.
Trusted by 1+ million students worldwide
1 out of 25
Related Documents


Your All-in-One AI-Powered Toolkit for Academic Success.
+13062052269
info@desklib.com
Available 24*7 on WhatsApp / Email
![[object Object]](/_next/static/media/star-bottom.7253800d.svg)
Unlock your academic potential
Copyright © 2020–2026 A2Z Services. All Rights Reserved. Developed and managed by ZUCOL.