Analyzing Retail Trends and Business Decisions: A Survey Report
VerifiedAdded on 2024/04/26

1
Paraphrase This Document
Introduction....................................................................................................................................4
Task 1..............................................................................................................................................5
a)..................................................................................................................................................5
b)..................................................................................................................................................6
c)..................................................................................................................................................7
Task 2............................................................................................................................................11
a)................................................................................................................................................11
b)................................................................................................................................................12
c)................................................................................................................................................13
d)................................................................................................................................................14
Task 3............................................................................................................................................15
a)................................................................................................................................................15
b)................................................................................................................................................18
c)................................................................................................................................................19
d)................................................................................................................................................20
Task 4............................................................................................................................................21
a)................................................................................................................................................21
b)................................................................................................................................................23
2
Conclusion....................................................................................................................................27
References.....................................................................................................................................28
3
⊘ This is a preview!⊘
Do you want full access?
Subscribe today to unlock all pages.
Trusted by 1+ million students worldwide
The assignment consists of the plans used for the collection of data on the basis of the
questionnaire designed for the change in habit of the customers and the shopping platforms for
the purchasing of the products. There is also the inclusion of the survey methodology and
sampling frame. There is the calculation of mean, median mode of the data collection and
analysis of them. The measure of dispersion and conclusions from them are also stated in the
assignment. There are valid graphs depending upon the results that were achieved by the
collection of data from the questionnaire. It also includes the trend line over the 3 years with
respect to the impact that is there on the habits. There is also the inclusion of the Transaction
processing system, Management information system, Decision support system. The assignment
also includes the critical path evaluation based on the case study provided along with the
calculation of the IRR depending upon the cash flows stated.
4
Paraphrase This Document
a)
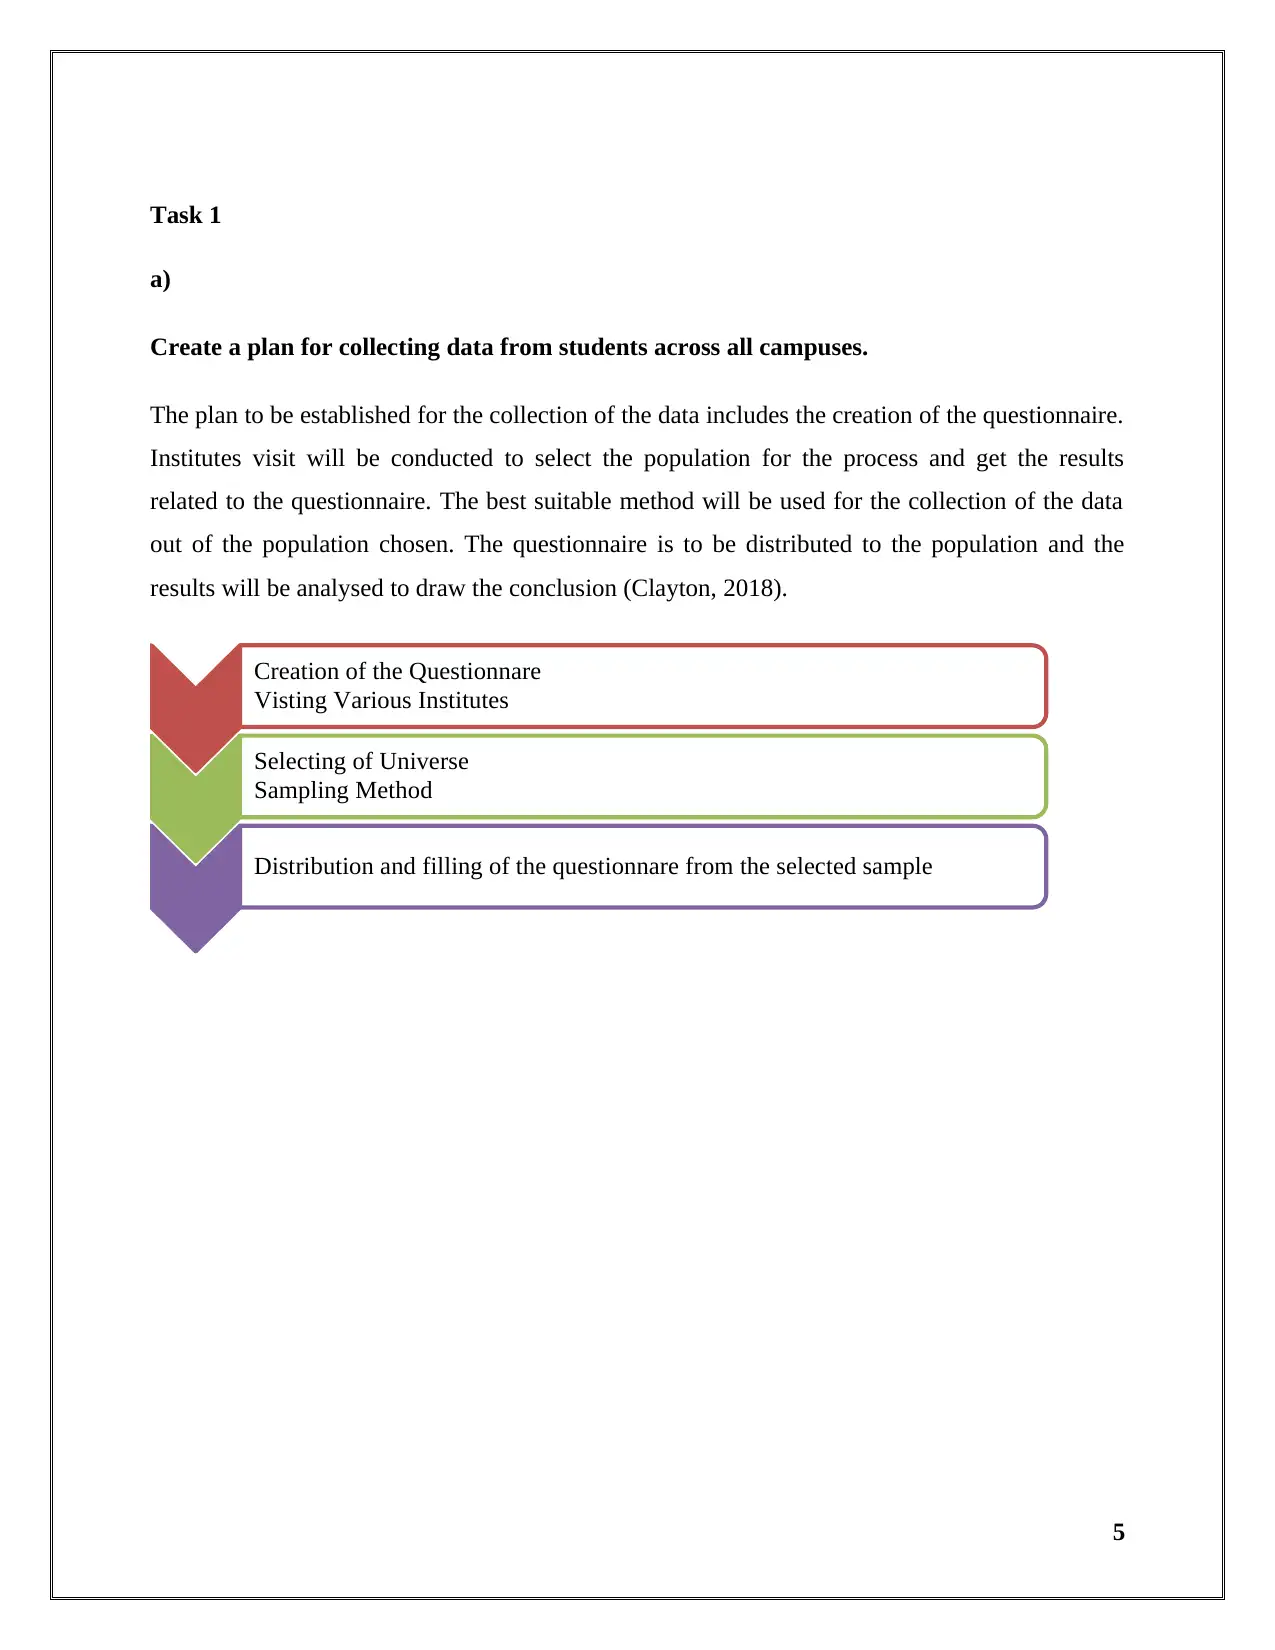
Create a plan for collecting data from students across all campuses.
The plan to be established for the collection of the data includes the creation of the questionnaire.
Institutes visit will be conducted to select the population for the process and get the results
related to the questionnaire. The best suitable method will be used for the collection of the data
out of the population chosen. The questionnaire is to be distributed to the population and the
results will be analysed to draw the conclusion (Clayton, 2018).
5
Creation of the Questionnare
Visting Various Institutes
Selecting of Universe
Sampling Method
Distribution and filling of the questionnare from the selected sample

Present the survey methodology and sampling frame used
There are various methods that can be used for the purpose of the sampling such as Mail Survey,
Telephone survey, and Personal Interview (Research Methodology, 2017). Mail survey refers to
is a self-administrated written survey conducted in case there is large population. The telephone
survey is conducted in a way that the questions are being narrated to the population and instant
feedback is taken. A personal interview is taken face to face in the respondent and series of
questions are asked to the population. The personal interview is considered for the collection of
the data.
The sampling method used by for the determination of the result is a random sampling. Samples
are taken out of the universe instead of conducting it on whole of the universe to generate the
data (Etikan, et. al., 2016). The universe taken for the calculation of the current scenario is of 60
and the population selected was of 40. The conclusions are being determined on the basis of the
results that are being availed from this population size (Singh, and Masuku, 2014).
6
⊘ This is a preview!⊘
Do you want full access?
Subscribe today to unlock all pages.
Trusted by 1+ million students worldwide
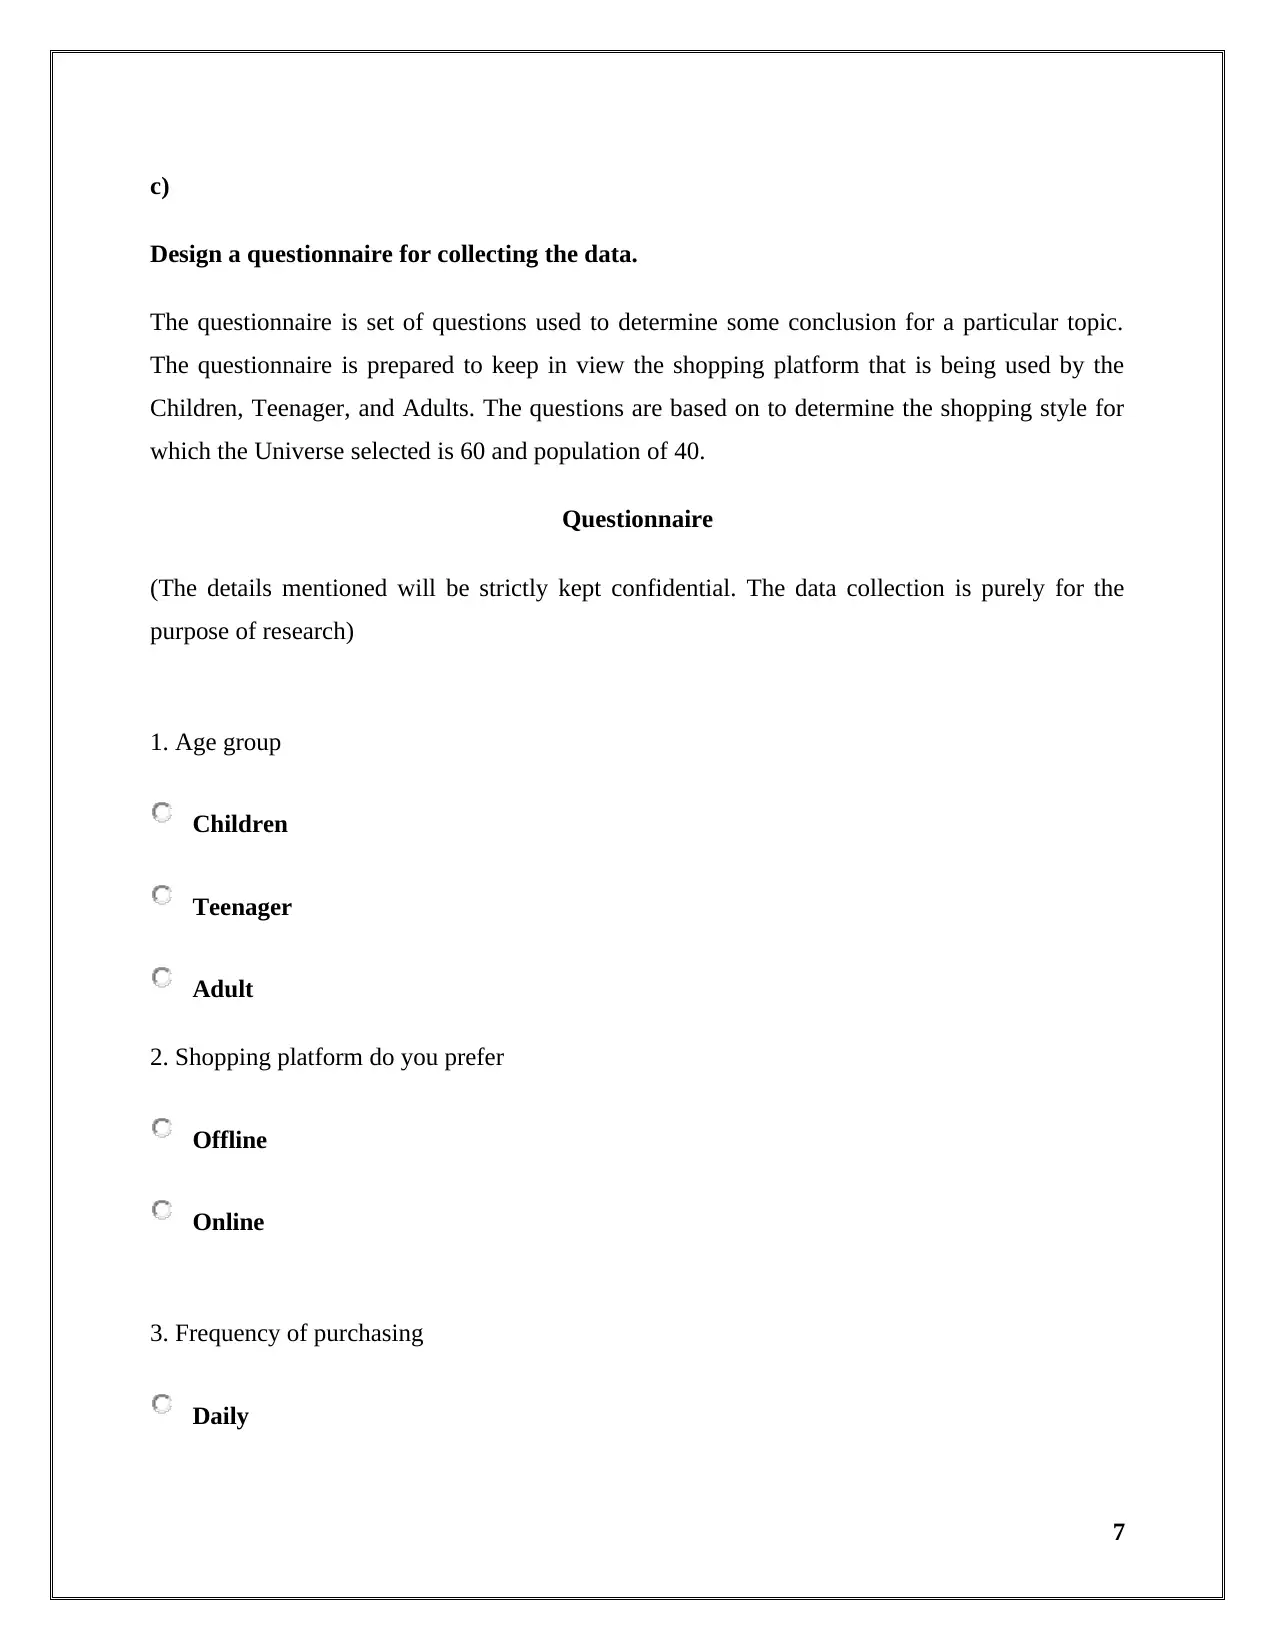
Design a questionnaire for collecting the data.
The questionnaire is set of questions used to determine some conclusion for a particular topic.
The questionnaire is prepared to keep in view the shopping platform that is being used by the
Children, Teenager, and Adults. The questions are based on to determine the shopping style for
which the Universe selected is 60 and population of 40.
Questionnaire
(The details mentioned will be strictly kept confidential. The data collection is purely for the
purpose of research)
1. Age group
Children
Teenager
Adult
2. Shopping platform do you prefer
Offline
Online
3. Frequency of purchasing
Daily
7
Paraphrase This Document
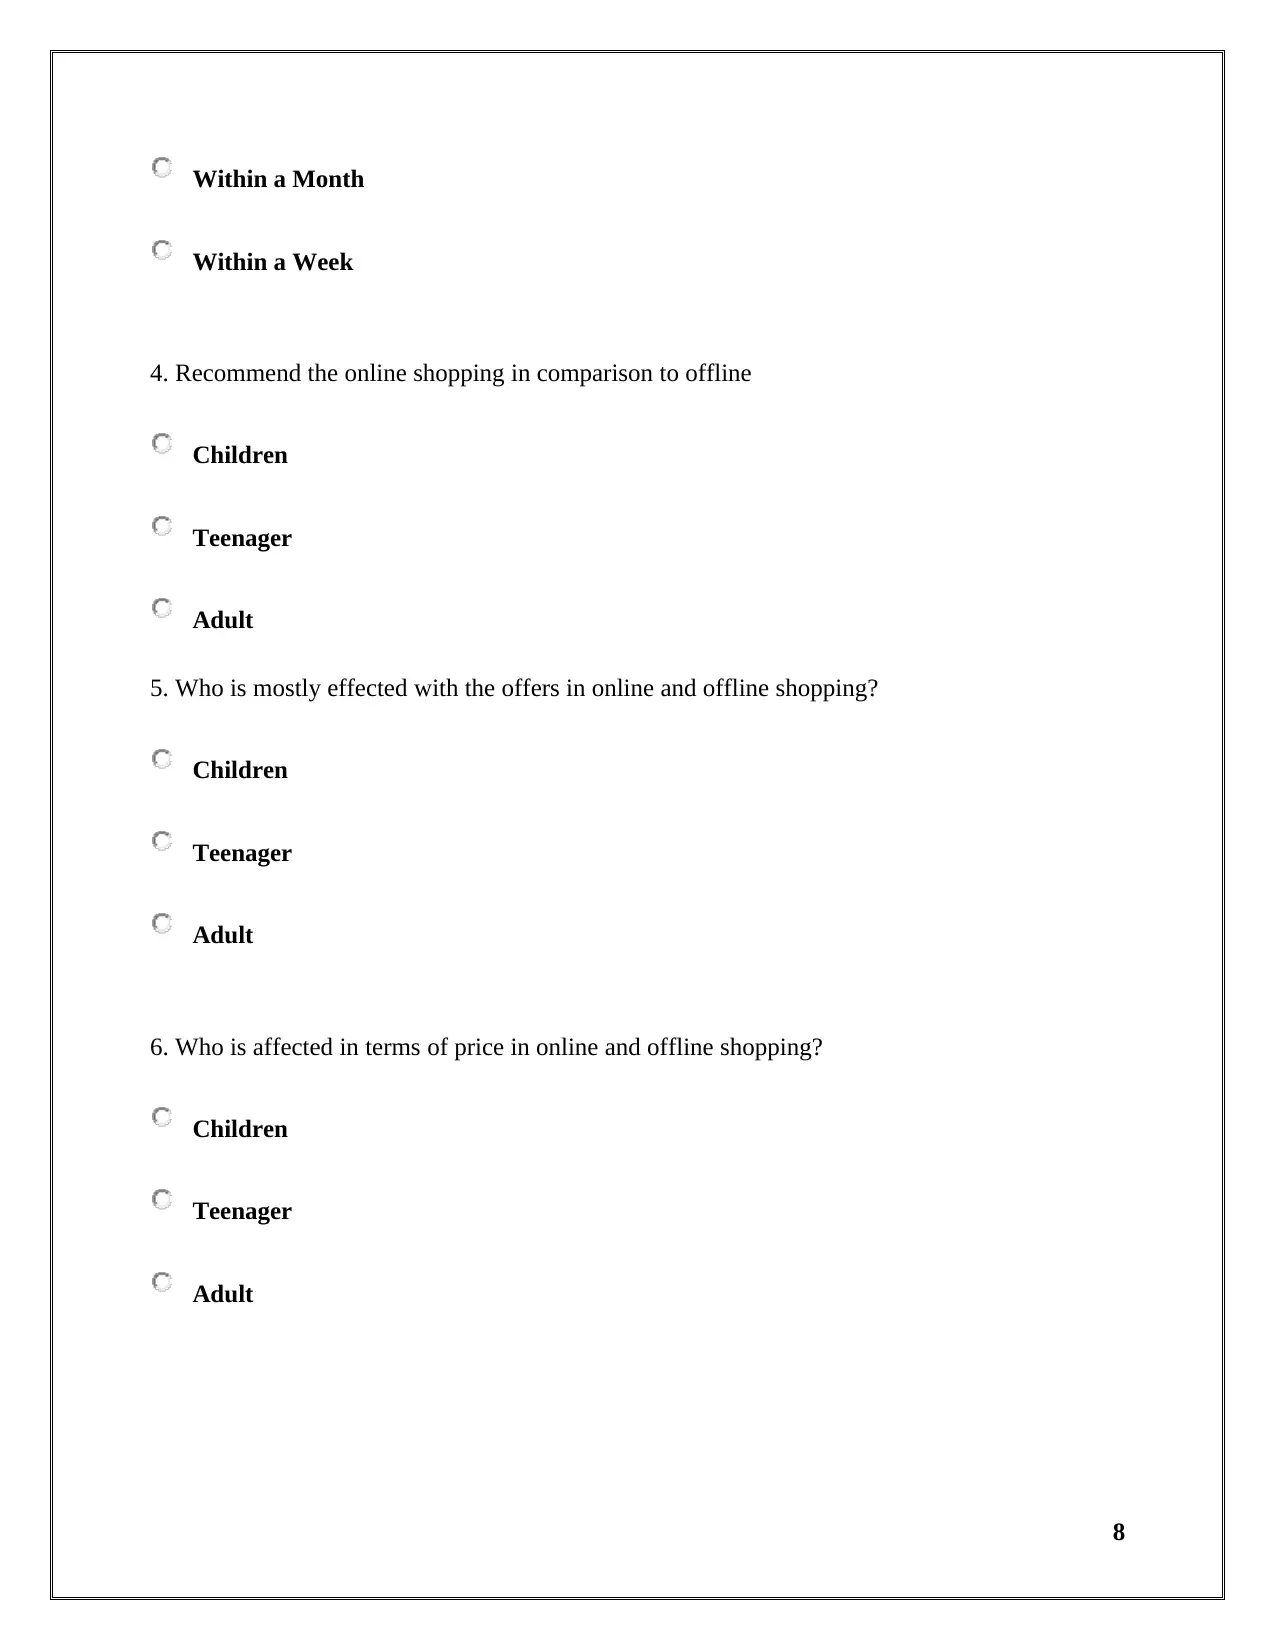
Within a Week
4. Recommend the online shopping in comparison to offline
Children
Teenager
Adult
5. Who is mostly effected with the offers in online and offline shopping?
Children
Teenager
Adult
6. Who is affected in terms of price in online and offline shopping?
Children
Teenager
Adult
8
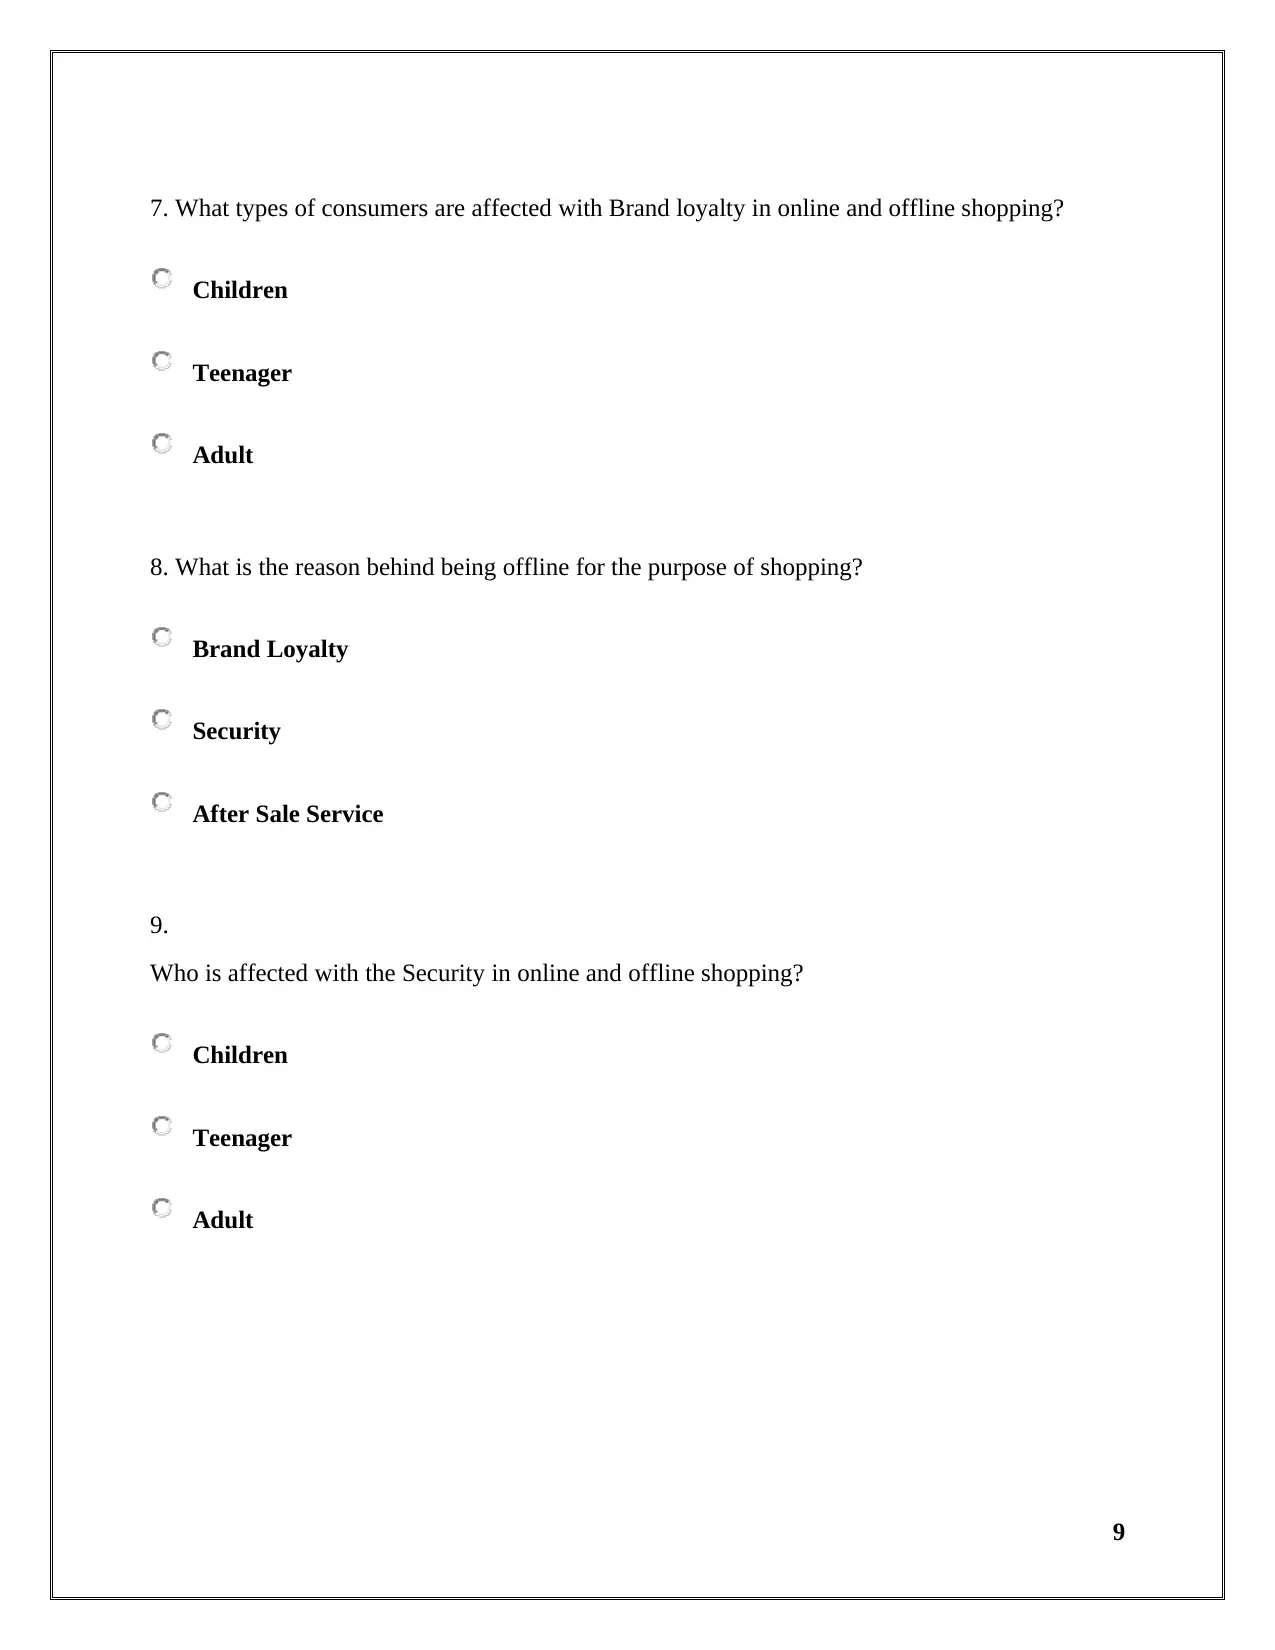
Children
Teenager
Adult
8. What is the reason behind being offline for the purpose of shopping?
Brand Loyalty
Security
After Sale Service
9.
Who is affected with the Security in online and offline shopping?
Children
Teenager
Adult
9
⊘ This is a preview!⊘
Do you want full access?
Subscribe today to unlock all pages.
Trusted by 1+ million students worldwide

Children
Teenager
Adult
11. Online Payment mode used while purchasing on online platform
Children
Teenager
Adult
12. How is your Online shopping experience?
Good
Average
Bad
10
Paraphrase This Document

a)
Summarise the data collected from the survey using representative values
Representative value 1 2 3 4 5 6 7 8
Mean 13.3333 15 10.6667 8 8 8.66667
7.6666
7 13.3333
Median 10 15 14 6 6 8 8 14
Mode 10 0 0 0 6 0 0 0
11
9 10 11 12
8.66667 8.66667 4 11.6667
8 6 3 10
Analyse the results of the survey and draw conclusions
The mean is the average of all the values of the survey taken. The survey is taken from the
universe of 60 and the survey is taken from the 40 persons who include 10 children, 20
teenagers, and 10 adults. Median is the amount which lies in the middle of the questions of the
survey. Median represents the mid values which have occurred in the questions of the survey.
The mode is the amount of frequency that how many times the person responds to the survey.
12
⊘ This is a preview!⊘
Do you want full access?
Subscribe today to unlock all pages.
Trusted by 1+ million students worldwide
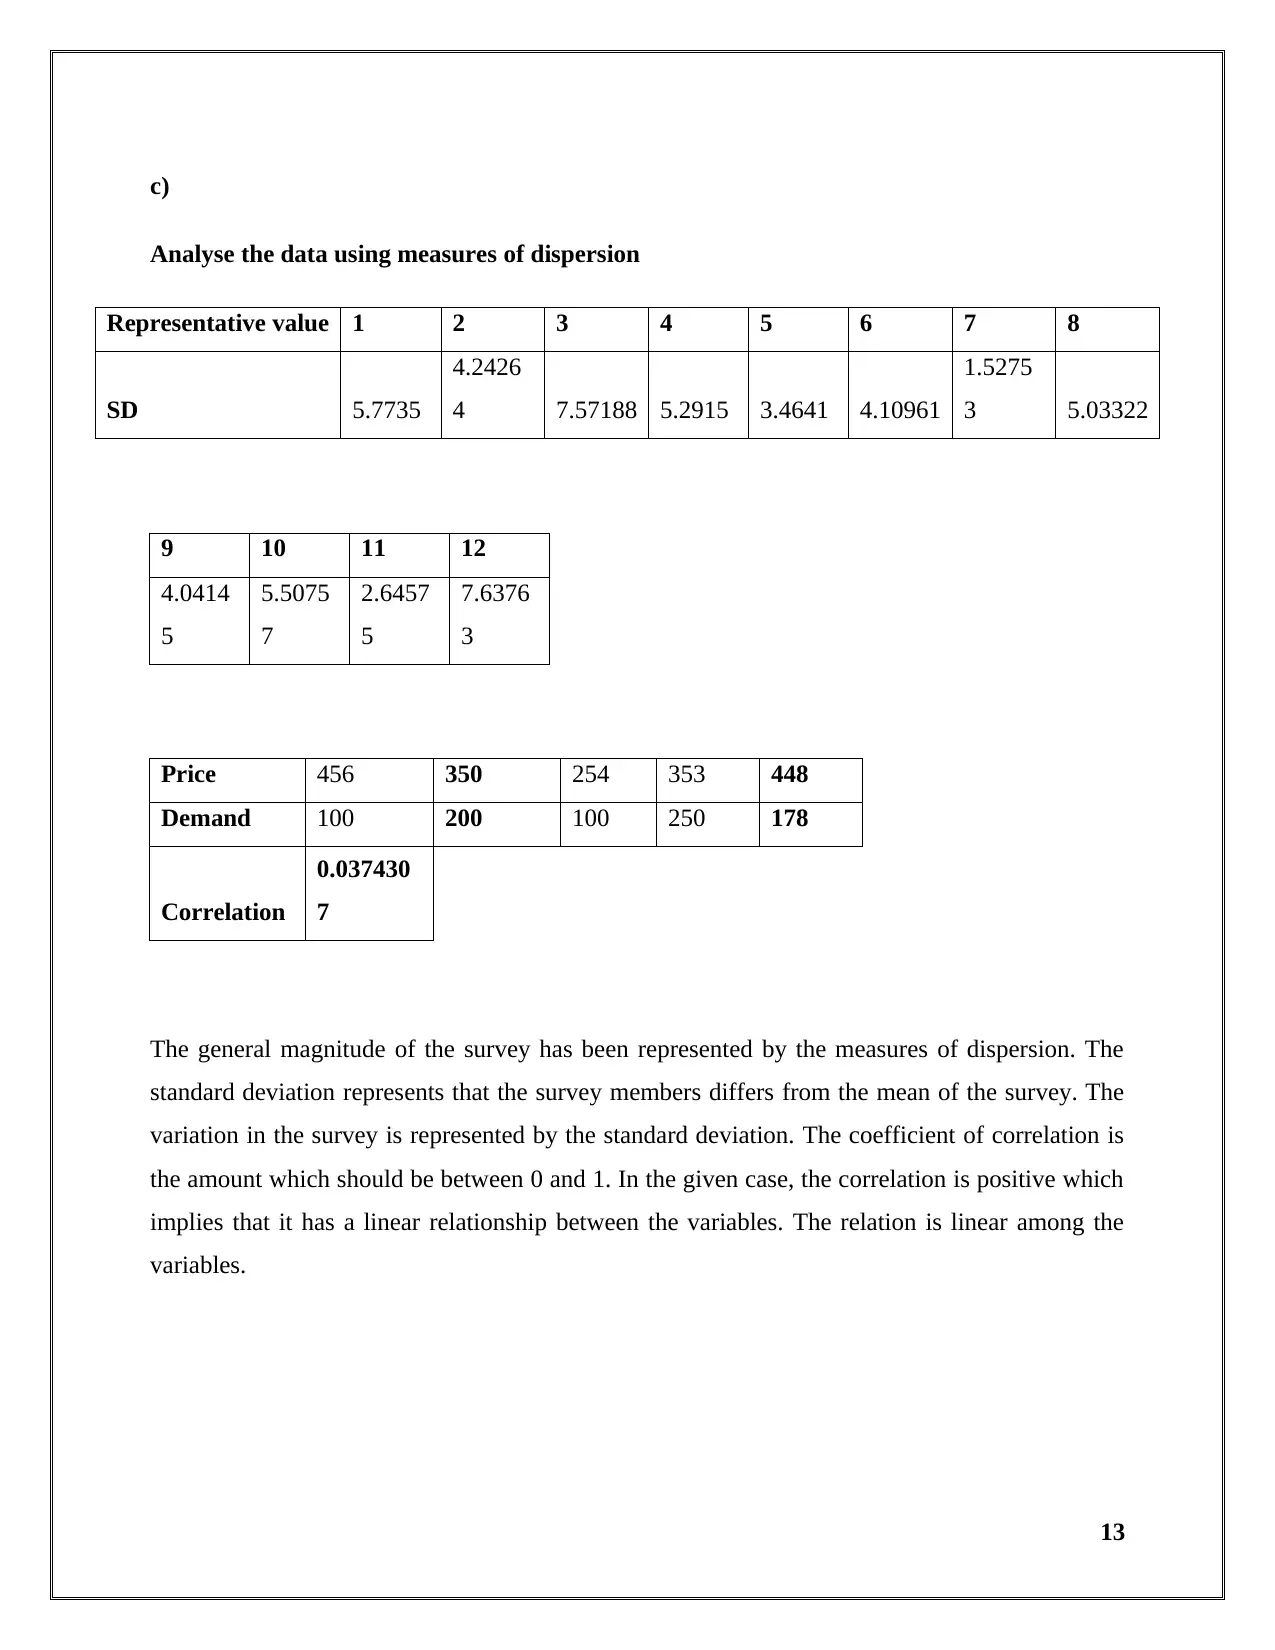
Analyse the data using measures of dispersion
Representative value 1 2 3 4 5 6 7 8
SD 5.7735
4.2426
4 7.57188 5.2915 3.4641 4.10961
1.5275
3 5.03322
9 10 11 12
4.0414
5
5.5075
7
2.6457
5
7.6376
3
Price 456 350 254 353 448
Demand 100 200 100 250 178
Correlation
0.037430
7
The general magnitude of the survey has been represented by the measures of dispersion. The
standard deviation represents that the survey members differs from the mean of the survey. The
variation in the survey is represented by the standard deviation. The coefficient of correlation is
the amount which should be between 0 and 1. In the given case, the correlation is positive which
implies that it has a linear relationship between the variables. The relation is linear among the
variables.
13
Paraphrase This Document

Explain how you can use quartiles, percentiles and the correlation coefficient to draw
useful conclusions
Representative value 1 2 3 4 5 6 7 8
Percentile 15 16.5 15 14 9 11 8.5 16
Quartile 25 % 10 13.5 8 5 6 6 7 11
Quartile 75 % 15 16.5 15 10 9 11 8.5 16
9 10 11 12
10.5 10.5 5 15
6.5 5.5 2.5 7.5
10.5 10.5 5 15
The survey has been divided into four equal parts to calculate the quartiles whose variation
differs. In case of quartile 25% means the ¼ portion of the survey or the population whereas the
quartile 75% is the ¾ portion of the survey or the population represented for the universe.
Percentile is the amount of the survey represented in the form of percentage which is three-
fourths of the survey or the population. Correlation coefficient represents the relation between
the variables which has been shown above in the table.
14

a)
With the aid of spreadsheets produce graphs to help draw valid conclusions on the survey
Q. Which Shopping platform is being preferred?
The offline platform is being preferred but there has been increasing interest in the online
platform for the teenager and youth. Though it shows that the offline is still popular but the
online platform is soon going to cross it.
15
⊘ This is a preview!⊘
Do you want full access?
Subscribe today to unlock all pages.
Trusted by 1+ million students worldwide
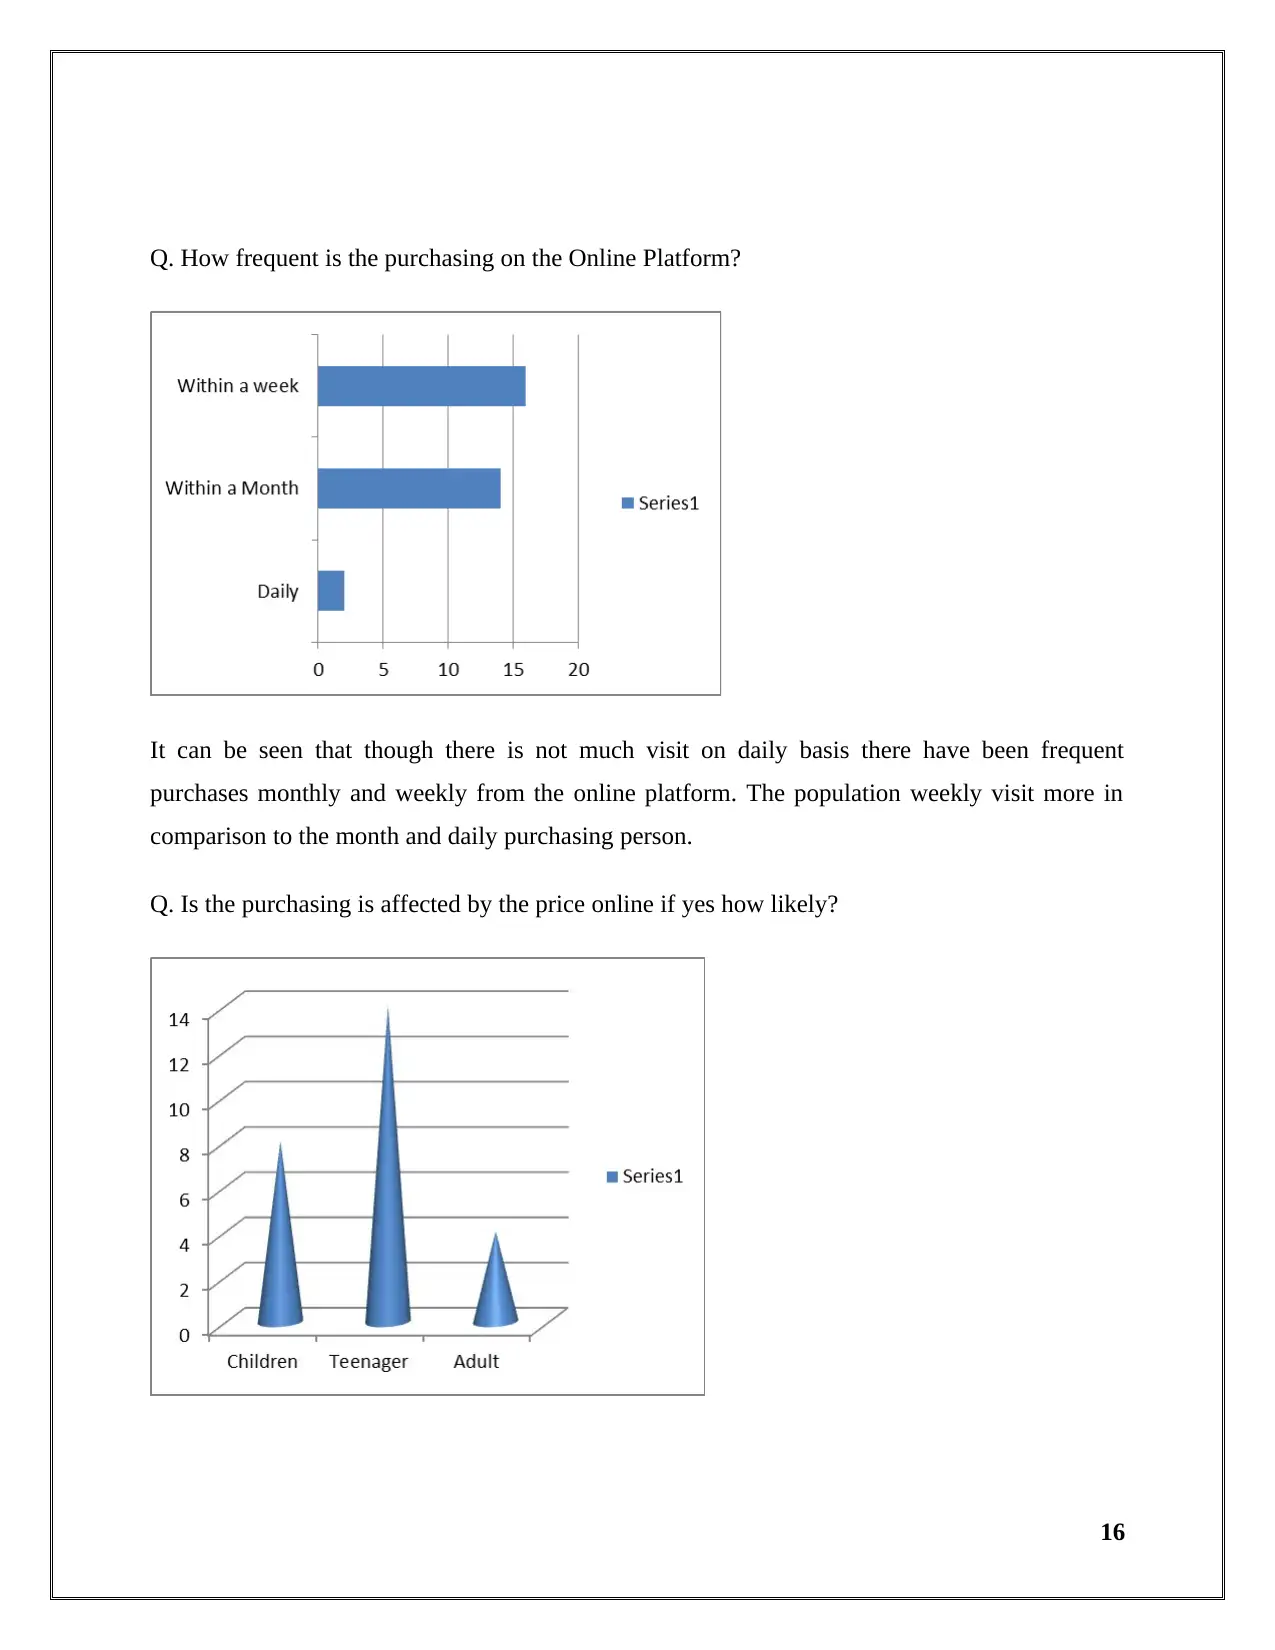
It can be seen that though there is not much visit on daily basis there have been frequent
purchases monthly and weekly from the online platform. The population weekly visit more in
comparison to the month and daily purchasing person.
Q. Is the purchasing is affected by the price online if yes how likely?
16
Paraphrase This Document
the teenager a lot to shift to the online platform purchases. The children are also influenced by
the price variation but there is not much impact on the Adult section. Adult category is not much
attracted towards the price variation in comparison to the children and teenager group.
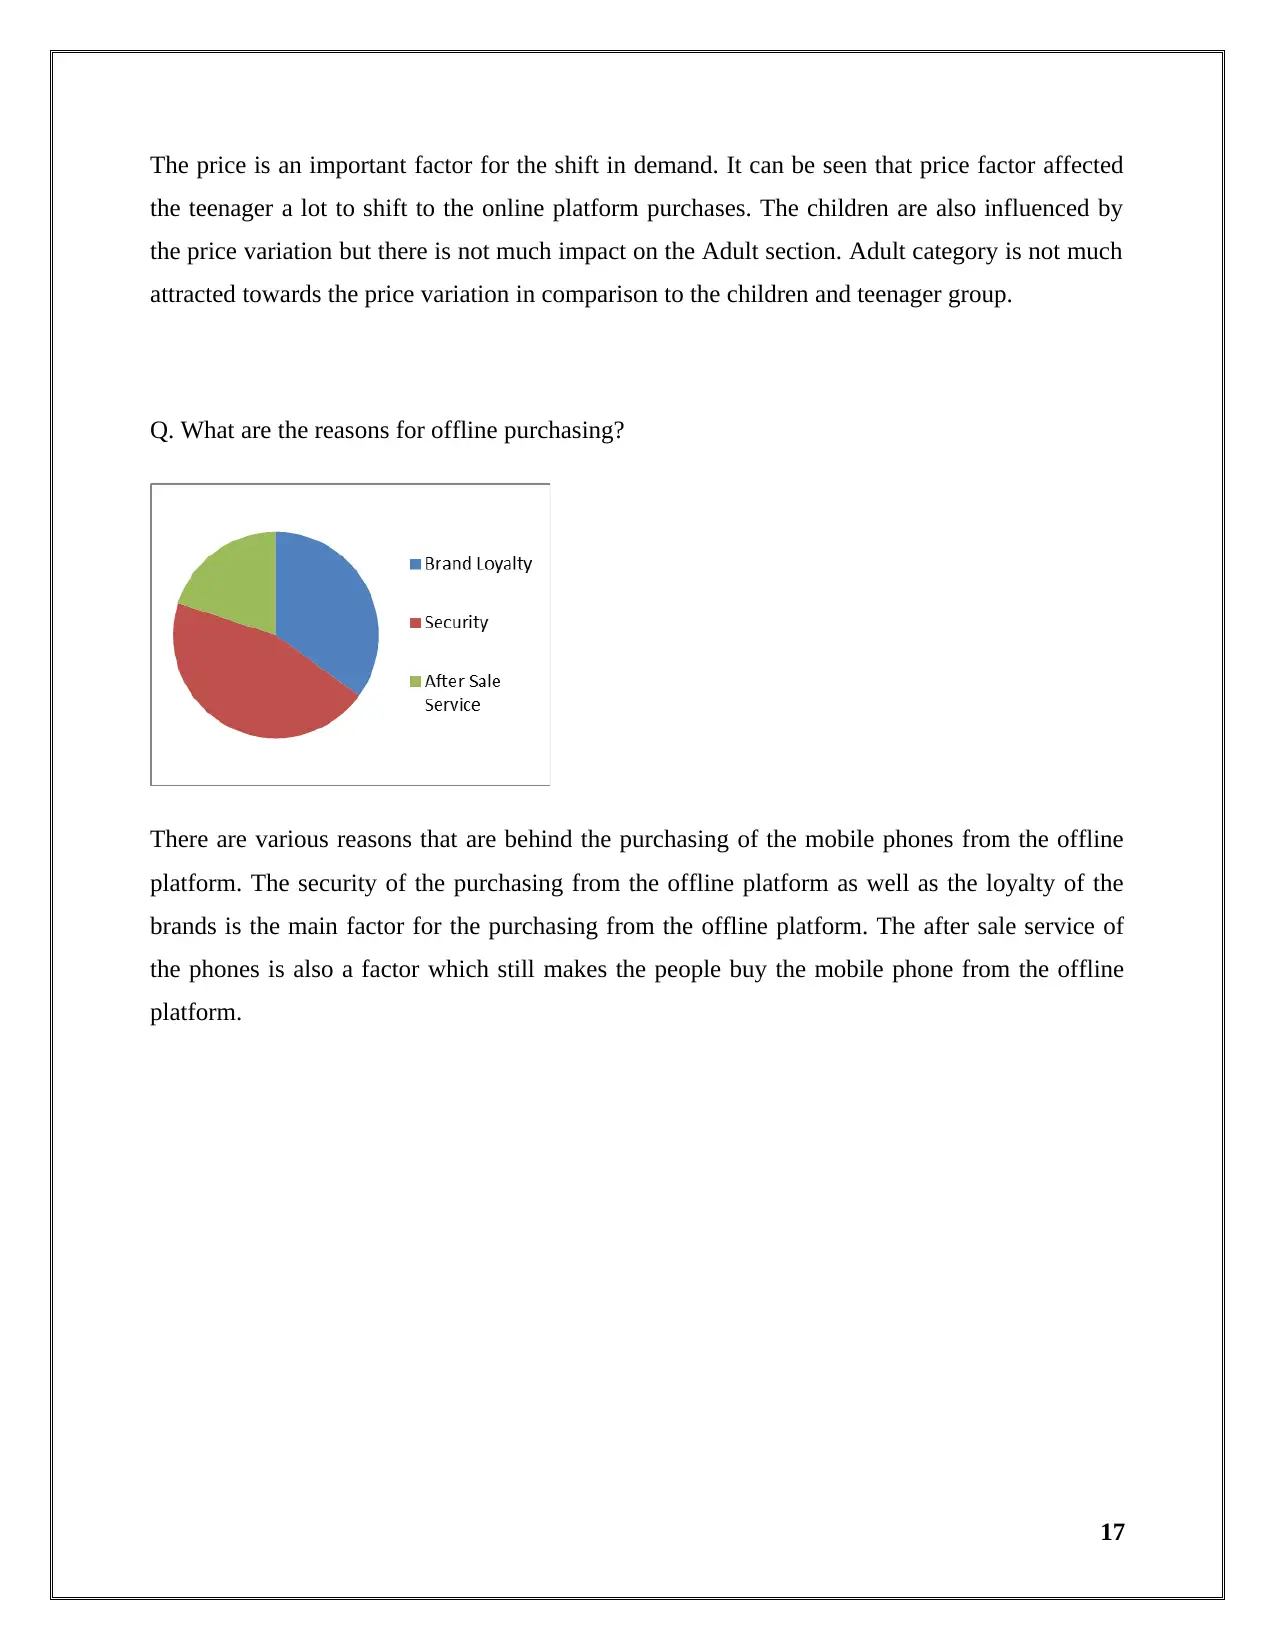
Q. What are the reasons for offline purchasing?
There are various reasons that are behind the purchasing of the mobile phones from the offline
platform. The security of the purchasing from the offline platform as well as the loyalty of the
brands is the main factor for the purchasing from the offline platform. The after sale service of
the phones is also a factor which still makes the people buy the mobile phone from the offline
platform.
17
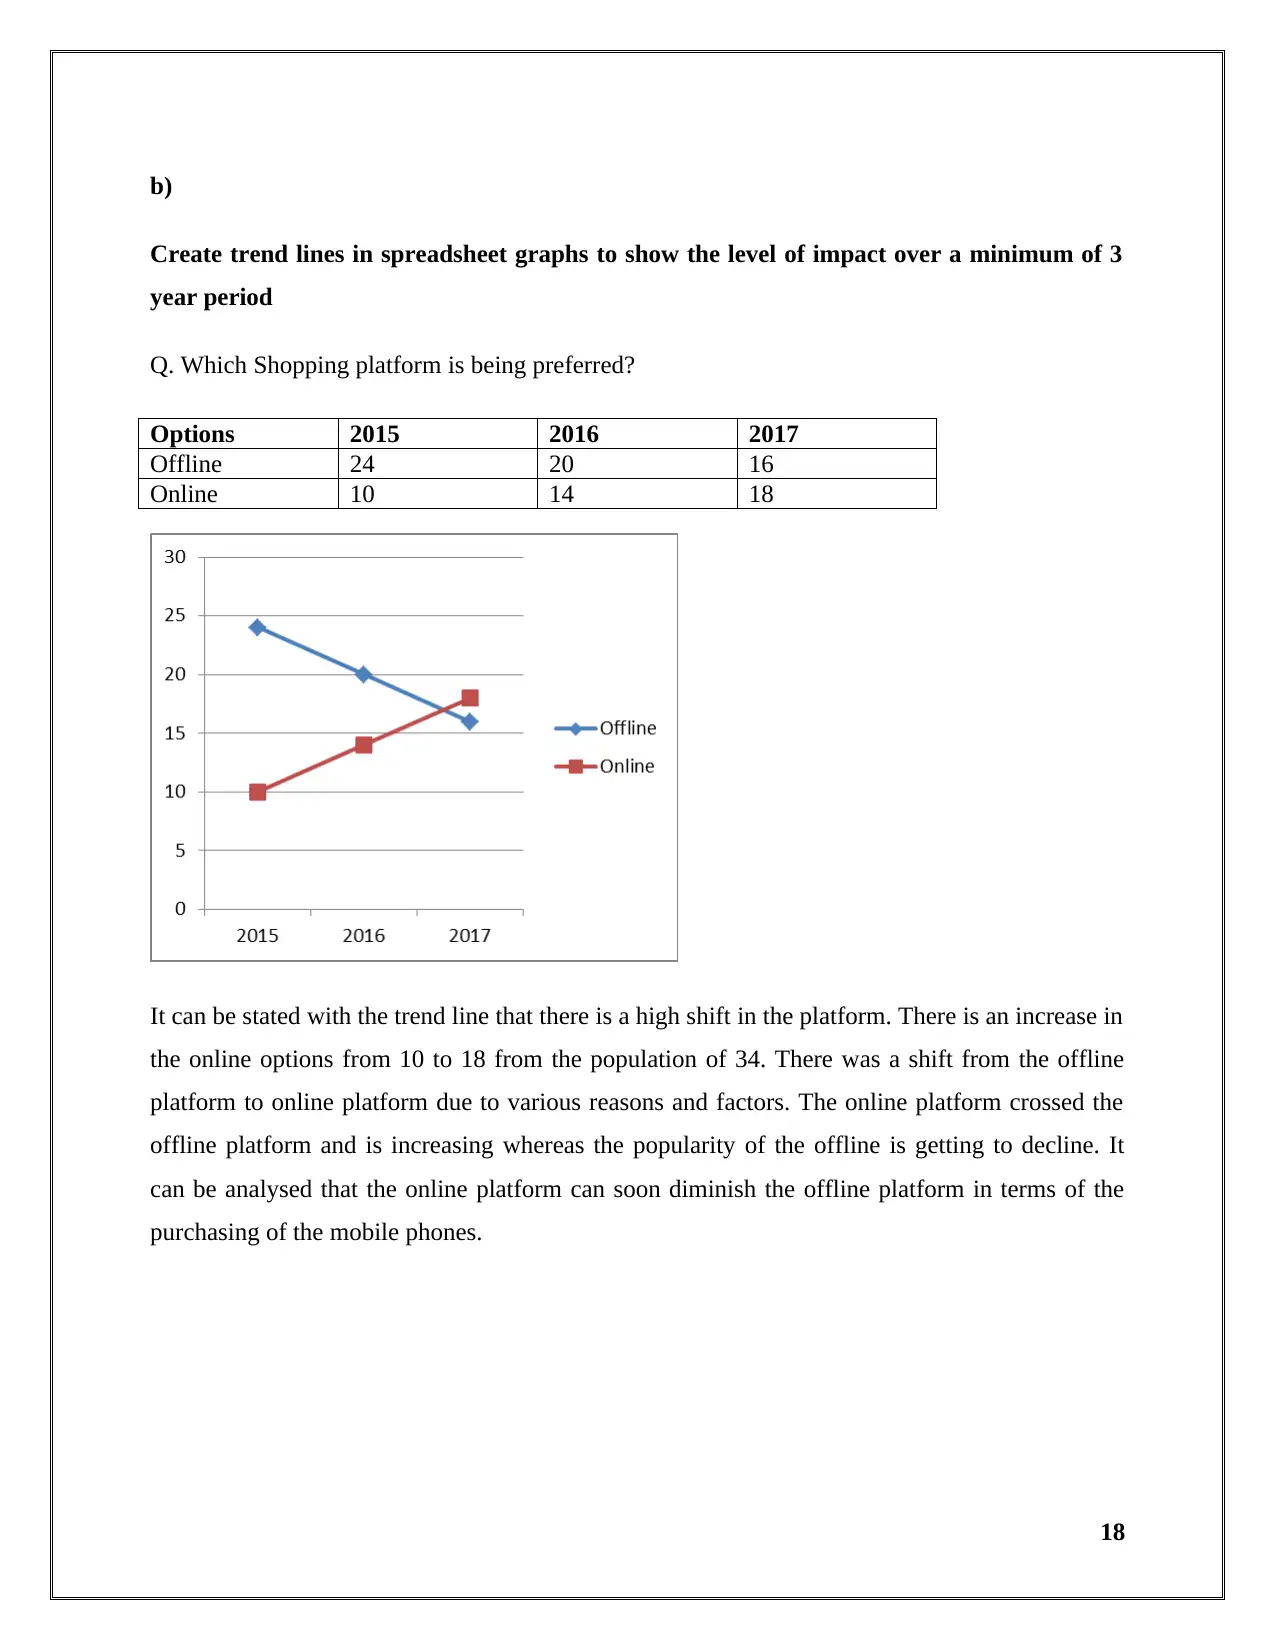
Create trend lines in spreadsheet graphs to show the level of impact over a minimum of 3
year period
Q. Which Shopping platform is being preferred?
Options 2015 2016 2017
Offline 24 20 16
Online 10 14 18
It can be stated with the trend line that there is a high shift in the platform. There is an increase in
the online options from 10 to 18 from the population of 34. There was a shift from the offline
platform to online platform due to various reasons and factors. The online platform crossed the
offline platform and is increasing whereas the popularity of the offline is getting to decline. It
can be analysed that the online platform can soon diminish the offline platform in terms of the
purchasing of the mobile phones.
18
⊘ This is a preview!⊘
Do you want full access?
Subscribe today to unlock all pages.
Trusted by 1+ million students worldwide
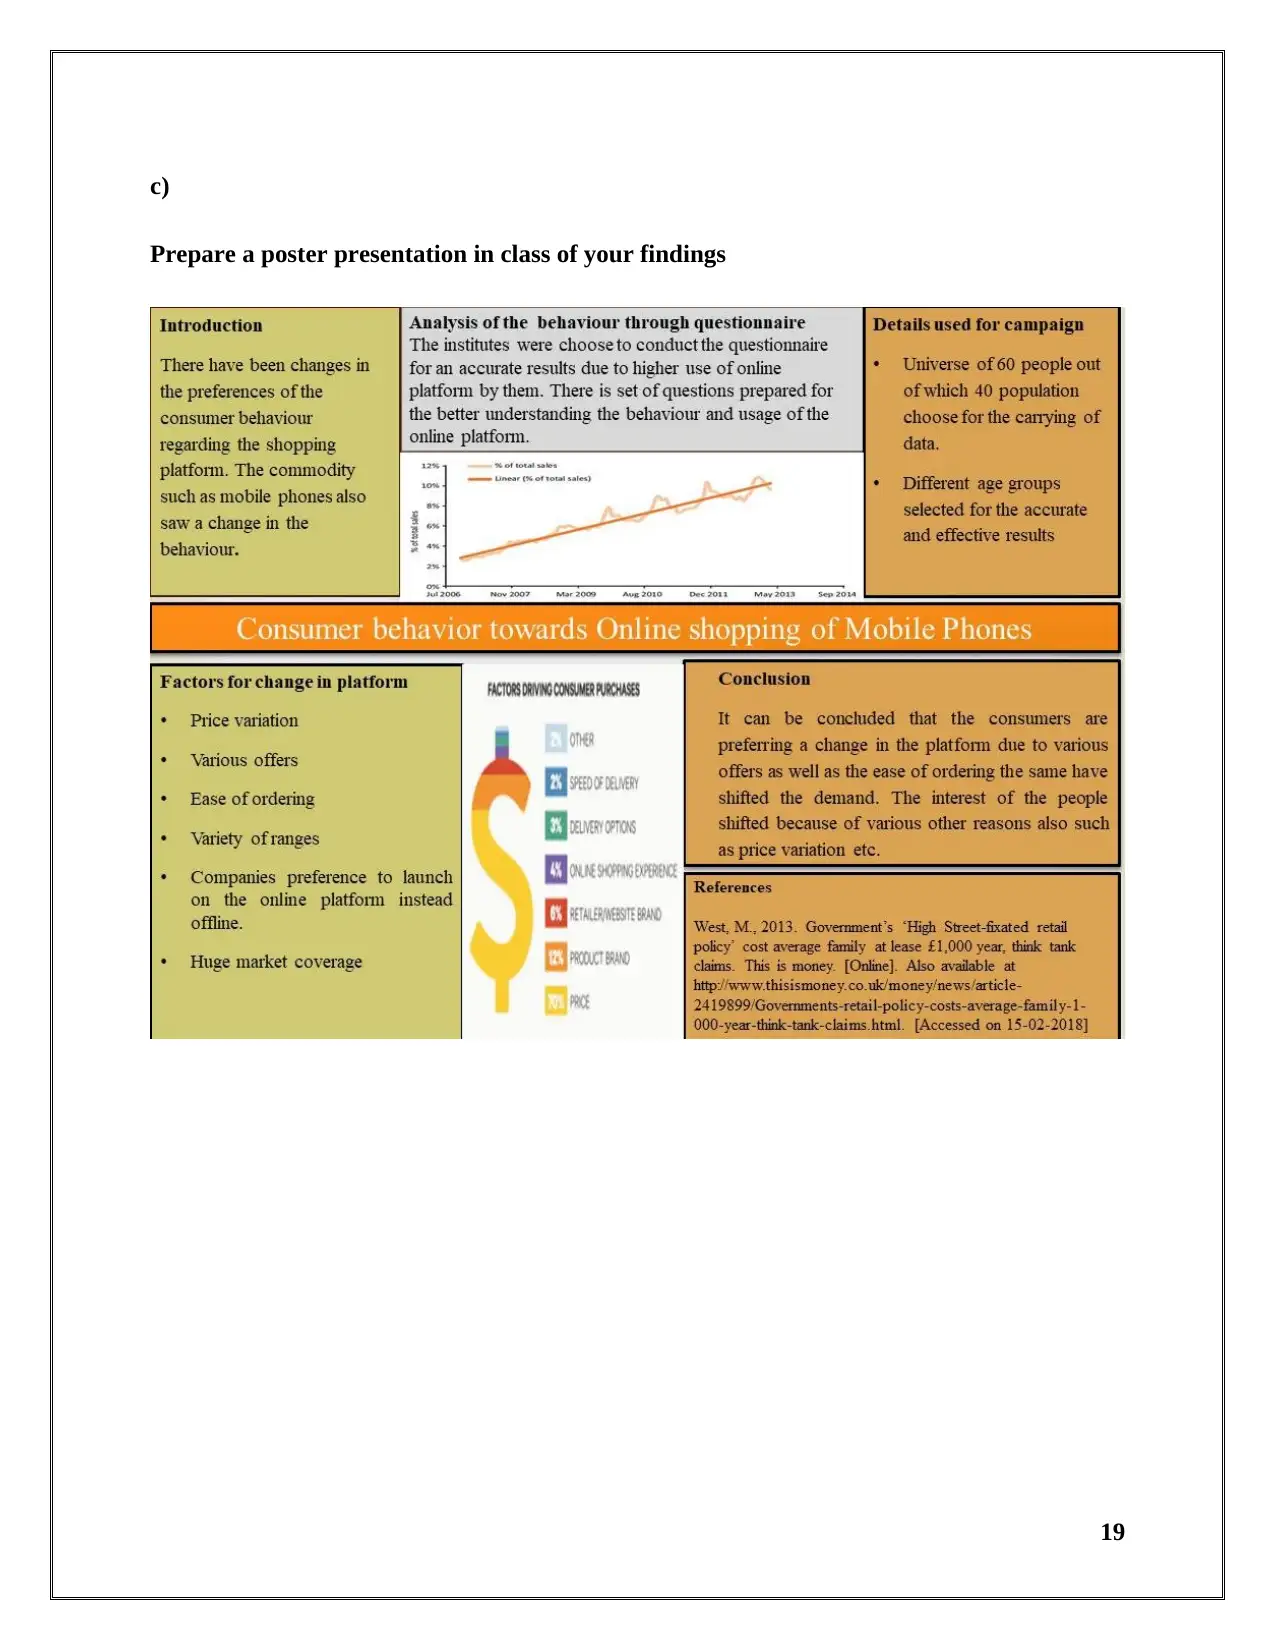
Prepare a poster presentation in class of your findings
19
Paraphrase This Document

Write a formal report for publication in the Retail Times magazine.
Introduction
The report consists of the change in the behaviour of the people of purchasing the mobile phone
from various platforms. There is the inclusion of the factors that have affected the change in the
preference of the buying platform among the people.
Content
It can be seen that the people are intended to buy the phones from an online portal through
various sites rather than purchasing them from offline platform especially by the teenagers. It can
be seen that there have been various factors that led to this change in which the offers and price
that is offered by the online platform have been major factor factors. The people which are still
tending to purchase from offline sector do so due to the distrust among the people on purchasing
the item from an offline platform. The after sale service has also been a factor for not shifting to
the online platform even though there is saving the money. The security of the payment is still
being not trusted by the payment. It can also be seen that the companies also prefer the online
portal for the launch of the new mobiles which attract the people towards the online platforms. It
can be seen that the reviews provided by the online platform by real customers also help them in
deciding which phone is better for them thus making them shift to an online platform. The
variety and comparison of the various available option help them to better decide the product.
Conclusion
It can be concluded with the help of the report that there is a shift in the purchasing from the
online platform as compare to the offline factor. It can be stated that the price has been a major
factor and people are willing to trust on online platforms along with the price and offers that are
being provided.
20

⊘ This is a preview!⊘
Do you want full access?
Subscribe today to unlock all pages.
Trusted by 1+ million students worldwide

a)
The systems which are used to serve at different levels of management and their role and
characteristics are as follows:
I. Transaction Processing Systems- The system which supports the processing of the
transaction which is a combination of the hardware and software. The transactions of the
organization in this system are collected, stored, retrieved and modified. The main characteristics
of this system are that the data or the information can be predicted, the data or the information
which is provided is reliable and it is consistent as well. The transaction processing system helps
in managing the inventory, accounts payable, order entry, purchasing, etc.
II. Management Information Systems- The managers are able to run the business or the
department effectively and efficiently with the help of the management information systems (Al-
Mamary, et. al., 2013). The information is combined with various departments, the members or
the employees contribute to the system and the system helps in decision making. The issues are
identified, the departments are coordinated with each other and the performance of the business
can be compared.
22
Paraphrase This Document

(Source: By Management Study Online)
III. Decision Support System- The system which helps in taking decisions which are non-
programmed. The main components of the system are a database, model base, and user interface.
The Enterprise information system and the group decision support system are the kinds of the
decision support system (Power, et. al., 2015). A large amount of data can be interpreted and
collected easily with this system. By using this system better and effective decisions can be taken
for the company as well as the customers. Various reports can be generated in this system which
is easy to understand which can be a graphical presentation
23
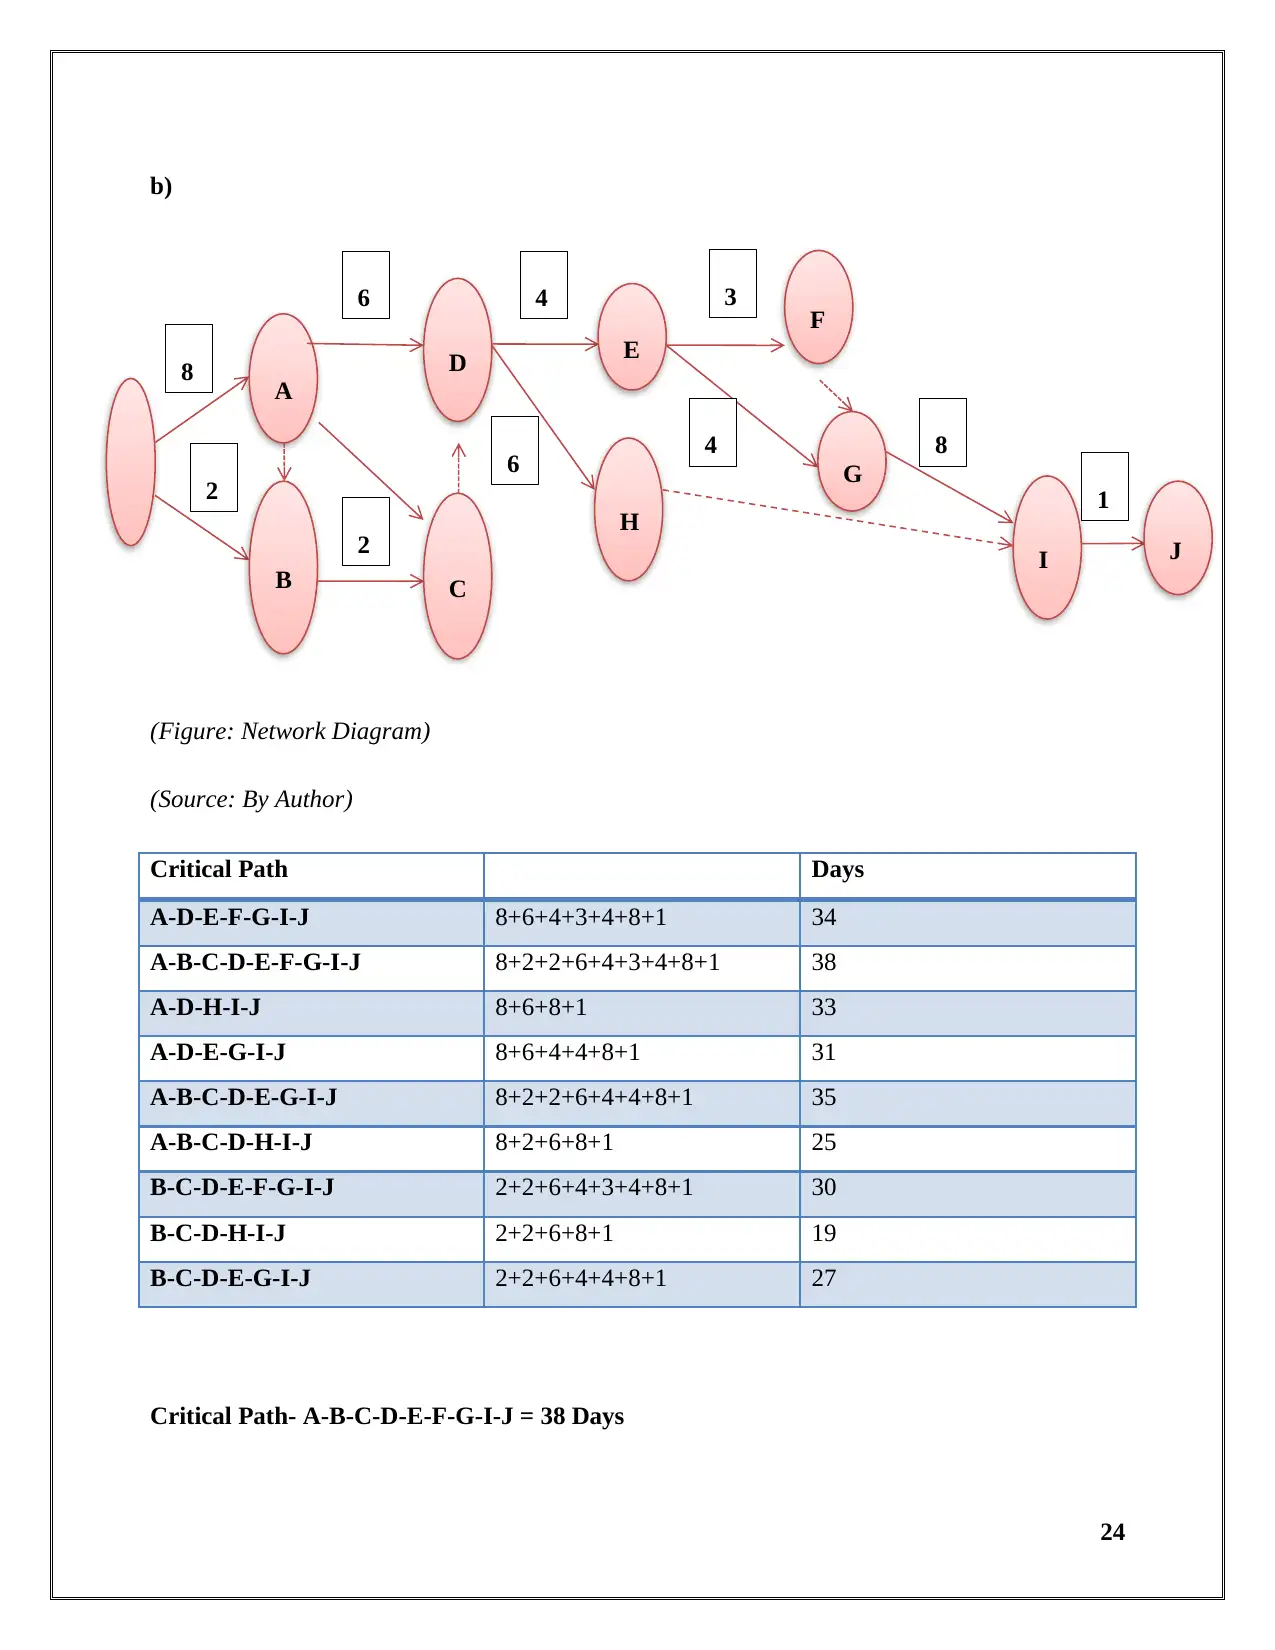
(Figure: Network Diagram)
(Source: By Author)
Critical Path Days
A-D-E-F-G-I-J 8+6+4+3+4+8+1 34
A-B-C-D-E-F-G-I-J 8+2+2+6+4+3+4+8+1 38
A-D-H-I-J 8+6+8+1 33
A-D-E-G-I-J 8+6+4+4+8+1 31
A-B-C-D-E-G-I-J 8+2+2+6+4+4+8+1 35
A-B-C-D-H-I-J 8+2+6+8+1 25
B-C-D-E-F-G-I-J 2+2+6+4+3+4+8+1 30
B-C-D-H-I-J 2+2+6+8+1 19
B-C-D-E-G-I-J 2+2+6+4+4+8+1 27
Critical Path- A-B-C-D-E-F-G-I-J = 38 Days
24
A
B
D
C
E
H
F
G
I J
8
2
6
2
4
3
6
4
8
1
⊘ This is a preview!⊘
Do you want full access?
Subscribe today to unlock all pages.
Trusted by 1+ million students worldwide
2015). The time will depend on the predecessor activity where if it is delayed the whole project
will be delayed and the next activity will not be started. In the given case, the critical path is 38
days.
25
Paraphrase This Document

Using financial tools for decision making advice a business planning on investing in a
projects
The calculation of NPV with the help of the cash flows of four years is as follows:
Year Cash
Flows
PV
10%
0 (15000) (15000)
1 8000 7273
2 10000 8264
3 5000 3757
4 5000 3415
Total
NPV
7709
The NPV of the project is positive which implies that the project will be beneficial for the
company (Creemers, 2017). The company should invest in the project.
The calculation of IRR is based on the interpolation method where the two rates will be assumed
and then the rates will be interpolated and IRR will be calculated. The calculation is as follows:
Year Cash
Flows
0 (15000)
1 8000
2 10000
3 5000
4 5000
IRR 35%
26
inflows should be the value where it can cover the cash outflow. On the basis of IRR, the
profitability of the project is to be considered (Magni, and Martin, 2017). The positive NPV
implies that the project should be accepted (Bell, P., 2017). The IRR implies that the project will
be beneficial and will be able to cover the cost of the project.
27
⊘ This is a preview!⊘
Do you want full access?
Subscribe today to unlock all pages.
Trusted by 1+ million students worldwide
It can be concluded with the help of the assignment that there is a shift in the consumer
preference on the basis of the platform used by them. It can be seen that the price is an important
factor for the change. It can be stated with the help of the questionnaire conducted that their
teenagers are having high trust on the online platform as compare to the children and adults.
They are more interested in getting the product which has a lower price. The online payment
term is still not much trusted by the people. It can also be stated that the TPS, MIS, and DPS are
essential for the various levels of the management and are effective in the decision making of the
organisation. It can help in better controlling and analysis of the data recorded and presentation
of the same. It can also be concluded that there is an increase in the demand for mobile phones
from the online platform as compare to the offline platform.
28
Paraphrase This Document
Al-Mamary, Y.H., Shamsuddin, A. and Abdul Hamid, N.A., 2013. The impact of
management information systems adoption in managerial decision making: A review.
Management Information Systems, 8(4), pp.010-017.
Bell, P., 2017. Introducing the Net Present Value Profile. Munich Personal RePEc
Archive
Clayton, J., 2018. The Five Stages of the Strategic Management Process. Chron.
[Online]. Also available at http://smallbusiness.chron.com/five-stages-strategic-
management-process-18785.html. [Accessed on 15-02-2018]
Creemers, S., 2017. Maximizing the expected net present value of a project with phase-
type distributed activity durations: an efficient globally optimal solution procedure.
European Journal of Operational Research.
Daramola, M.O., 2015. Application of Critical Path Method scheduling to research plan
and management of graduate students' research project in engineering education.
QScience Proceedings, p.20.
Etikan, I., Musa, S.A. and Alkassim, R.S., 2016. Comparison of convenience sampling
and purposive sampling. American Journal of Theoretical and Applied Statistics, 5(1),
pp.1-4.
Magni, C.A. and Martin, J.D., 2017. The Reinvestment Rate Assumption Fallacy for IRR
and NPV: A Pedagogical Note. Munich Personal RePEc Archive.
Power, D.J., Sharda, R. and Burstein, F., 2015. Decision support systems. John Wiley &
Sons, Ltd.
Research Methodology, 2017. Survey Method. Research Methodology. [Online]. Also
available at https://research-methodology.net/research-methods/survey-method/.
[Accessed on 14-02-2018]
Singh, A.S. and Masuku, M.B., 2014. Sampling techniques & determination of sample
size in applied statistics research: An overview. International Journal of Economics,
Commerce and Management, 2(11), pp.1-22.
29
Related Documents


Your All-in-One AI-Powered Toolkit for Academic Success.
+13062052269
info@desklib.com
Available 24*7 on WhatsApp / Email
![[object Object]](/_next/static/media/star-bottom.7253800d.svg)
© 2024 | Zucol Services PVT LTD | All rights reserved.