Business Decision Making Assignment
Added on 2019-12-03
26 Pages4294 Words162 Views
Business Decision Making

TABLE OF CONTENTSintroduction......................................................................................................................................4task 1................................................................................................................................................41. 1 Research plan for collecting primary and secondary data....................................................41. 2 Survey methodology and Sampling frame for research.......................................................41.3 Sample of questionnaire........................................................................................................5Task 2...............................................................................................................................................62.1 Calculation of mean mode median........................................................................................62. 2 Analysis of the calculation and advise Karen on the most popular price for orders over thelast month.....................................................................................................................................72.3 Calculation of Range, standard deviation, quartile, percentile and interquartile range.........72.4 Calculation of correlation coefficient....................................................................................8Task 3...............................................................................................................................................93.1 & 4.1 Line/ Bar graphs of showing sales profitability and cost with valid conclusion.........93. 2 Trend line graph for sales, costs and profit.........................................................................103. 3 Power Point Presentation....................................................................................................123.4 Business report.....................................................................................................................15Task 4.............................................................................................................................................174.2 Calculation of the project duration and critical path...........................................................17Task 5.............................................................................................................................................194. 3 Calculation of the Payback, NPV and IRR for Project Super & Project Sonic andappropriate recommendations for project selection with justification......................................19Conclusion.....................................................................................................................................21References......................................................................................................................................22
TABLE OF FIGURESFigure 1: Line graph showing sales, cost and profitability..............................................................9Figure 2: Bar graph showing sales, cost and profitability.............................................................10Figure 3: Trend line graph for sales, cost and profit......................................................................11Figure 4: Gantt chart for new project of Ace.................................................................................18Figure 5: Network Diagram for new project of Ace......................................................................18LIST OF TABLESTable 1: Calculation of range, quartile and interquartile range.......................................................7Table 2: Correlation coefficient.......................................................................................................8Table 3: Calculation of the critical path........................................................................................17Table 4: Calculation of Payback period.........................................................................................19Table 5: Calculation of Net Present...............................................................................................19Table 6: Calculation of Internal Rate of Return............................................................................20
INTRODUCTIONFinancial and operational decisions are considered as major important decisions of anorganization. Every business needs to focus on these decisions and should apply appropriatetechniques at the time of decision making process (Hobbs, 2009). The current research study isbased on business decision making and regarding this it will focus on different business scenarioand case studies. This research shed lights on the use of research plan, statistical analysis of dataand graphical presentation in business decisions. Along with this, it includes critical pathmethod, Gantt chart and PERT for operational decision making. Including this, it will alsodescribe how an organization can use investment appraisal methods for financial decisionmaking of an organization. TASK 11. 1 Research plan for collecting primary and secondary dataAs per the given business scenario client wants to launch a new brand of trainers inLondon. Regarding this, he/she wants to conduct market research for understanding needs andrequirements of customers and market dynamics. Research plan for primary and secondary data collection:According to this research plan, consultant will collect relevant facts and figures usingboth primary and secondary data collection methods. Primary data helps in collectinginformation about the present and fresh situation of market. On the other hand, secondary datawill help in collecting historical facts of this market. Primary data will be collected by surveymethodology and regarding this researcher will develop an appropriate questionnaire (Lind,Marchal and Wathen, 2005). In contrast, secondary data collection will be done by using varioussources such as websites and annual reports of different companies, journals, books, literatures,etc. All these data will help in getting suitable information for organization. 1. 2 Survey methodology and Sampling frame for researchSurvey methodology:Author will conduct online survey of customers of trainers because it will help inreducing time and cost for whole market research. Including this, author will formulate aquestionnaire for this survey which will include various open and close ended questions relevant4| P a g e
to needs and requirements of customers. Therefore, online survey of customers will help incollecting and recording appropriate information (Newbold and et. al., 2009). Sampling Frame:Author needs to select appropriate sample of customers for collecting primaryinformation. Regarding this, researcher will use random number sampling method because willbe significant for the current market research because it will reduce sampling error by providingequal chance to each and every customer to select in a sample. Author will select 20 customersof trainers which will represent the whole research universe. Therefore, sample size for thecurrent investigation will be 20 (Kathy and Deborah, 2007). 1.3 Sample of questionnaireDemographic information of students and college staff of FSBName (Optional):Age:1.Do you use trainers for your daily life?YesNo2.As per your experience, please provide information weather Design of trainers affect yourpurchase decisions or not?YesNo3.Do you think comfort is most important attribute of trainers as compare to design?YesNo4.Are you completely satisfied with your current trainers?YesNo5.Do you wants to purchase any new trainers which focuses on designs as well as comfortalso?YesNo5| P a g e
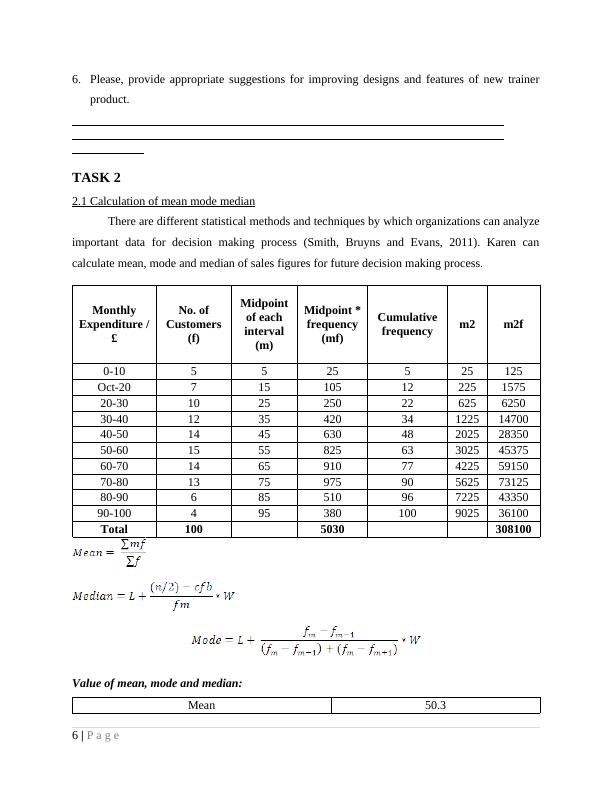
6.Please, provide appropriate suggestions for improving designs and features of new trainerproduct.TASK 22.1 Calculation of mean mode medianThere are different statistical methods and techniques by which organizations can analyzeimportant data for decision making process (Smith, Bruyns and Evans, 2011). Karen cancalculate mean, mode and median of sales figures for future decision making process. MonthlyExpenditure /£No. ofCustomers(f)Midpointof eachinterval(m)Midpoint *frequency(mf)Cumulativefrequencym2m2f0-105525525125Oct-2071510512225157520-30102525022625625030-4012354203412251470040-5014456304820252835050-6015558256330254537560-7014659107742255915070-8013759759056257312580-906855109672254335090-100495380100902536100Total1005030308100Value of mean, mode and median:Mean50.36| P a g e
End of preview
Want to access all the pages? Upload your documents or become a member.
Related Documents
Business Decision Making: Research Plan, Statistical Analysis, and Graphical Presentationlg...
|23
|4480
|344
Sources of Business Decision Makinglg...
|18
|4014
|97
Business Decision Makinglg...
|20
|4578
|299
Business Decision Making Assignment - Restaurant Chainlg...
|23
|4751
|147
Business Decision Making Techniques Assignmentlg...
|24
|5242
|25
Marketing Research Report for World Wide Tobacco (WWT)lg...
|21
|4451
|481