Descriptive Statistics
VerifiedAdded on 2023/02/03
|10
|605
|42
PowerPoint Presentation
AI Summary
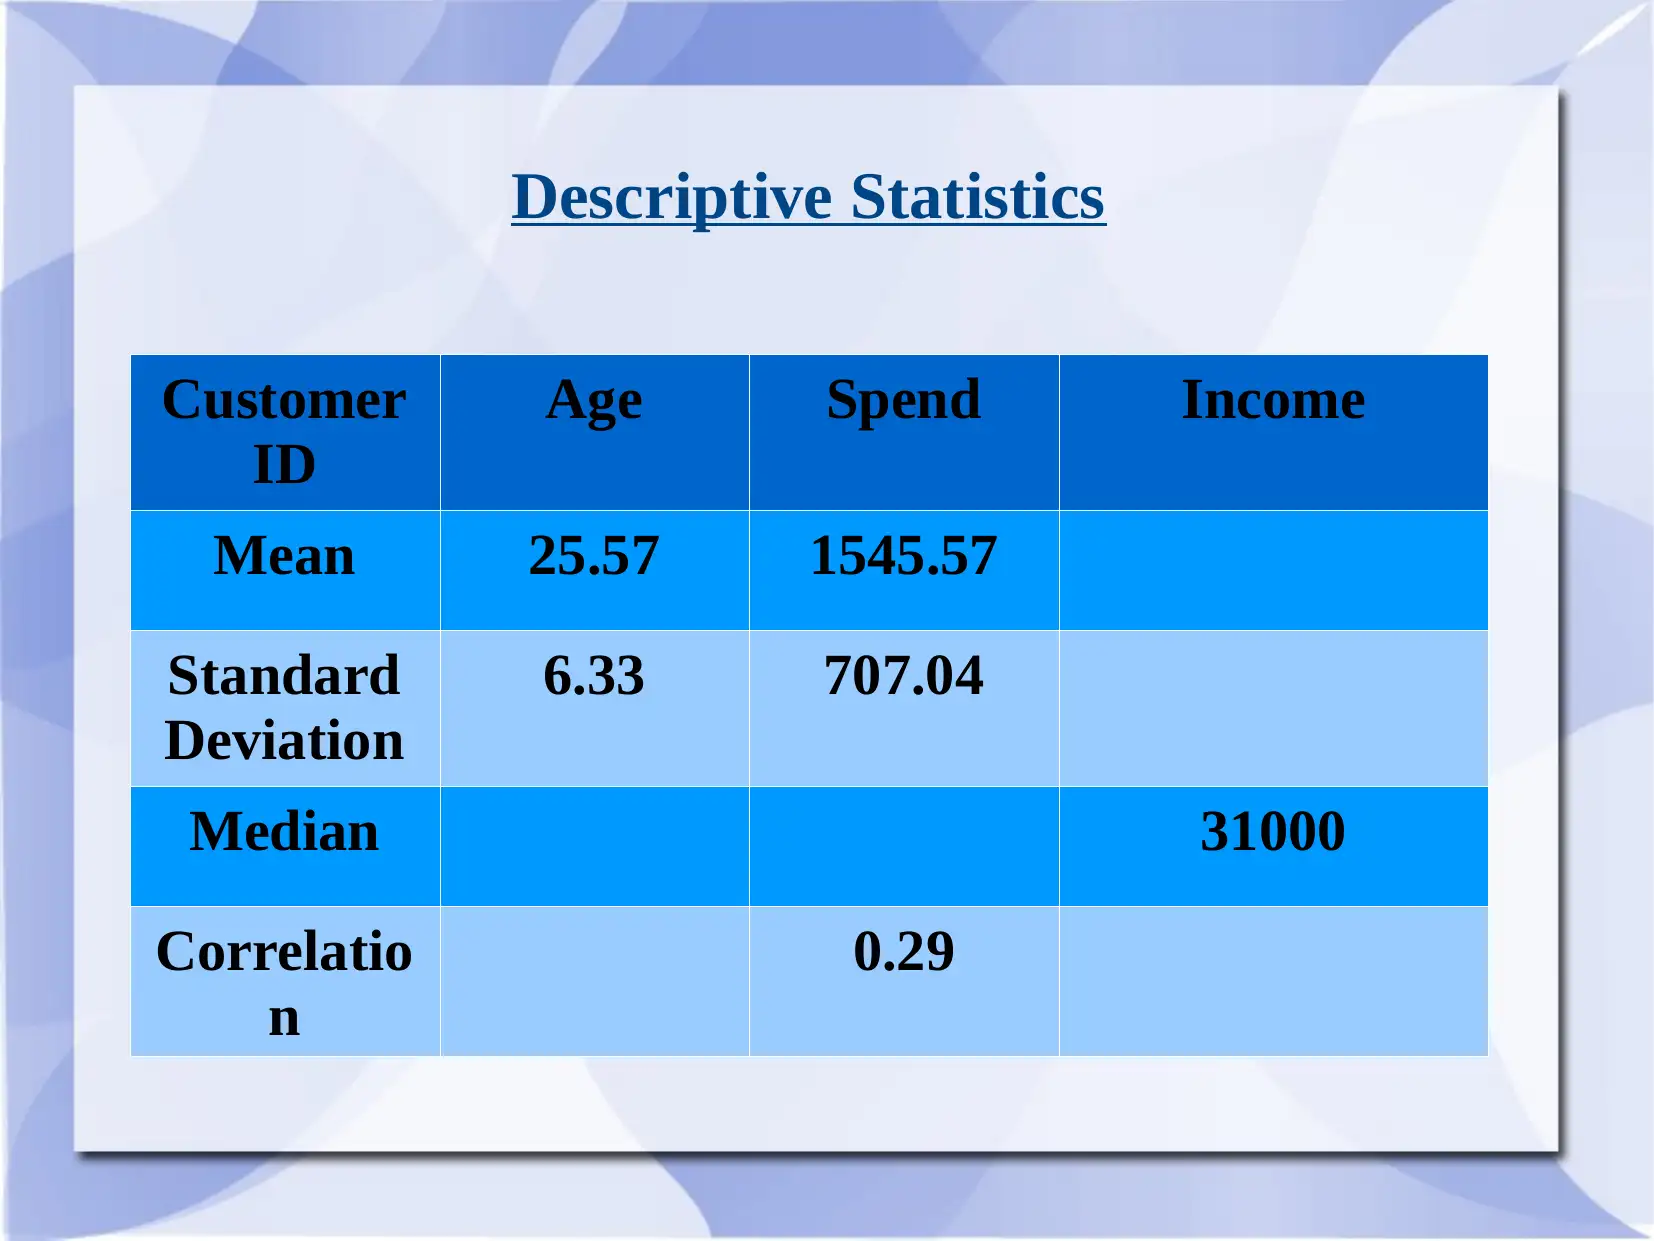
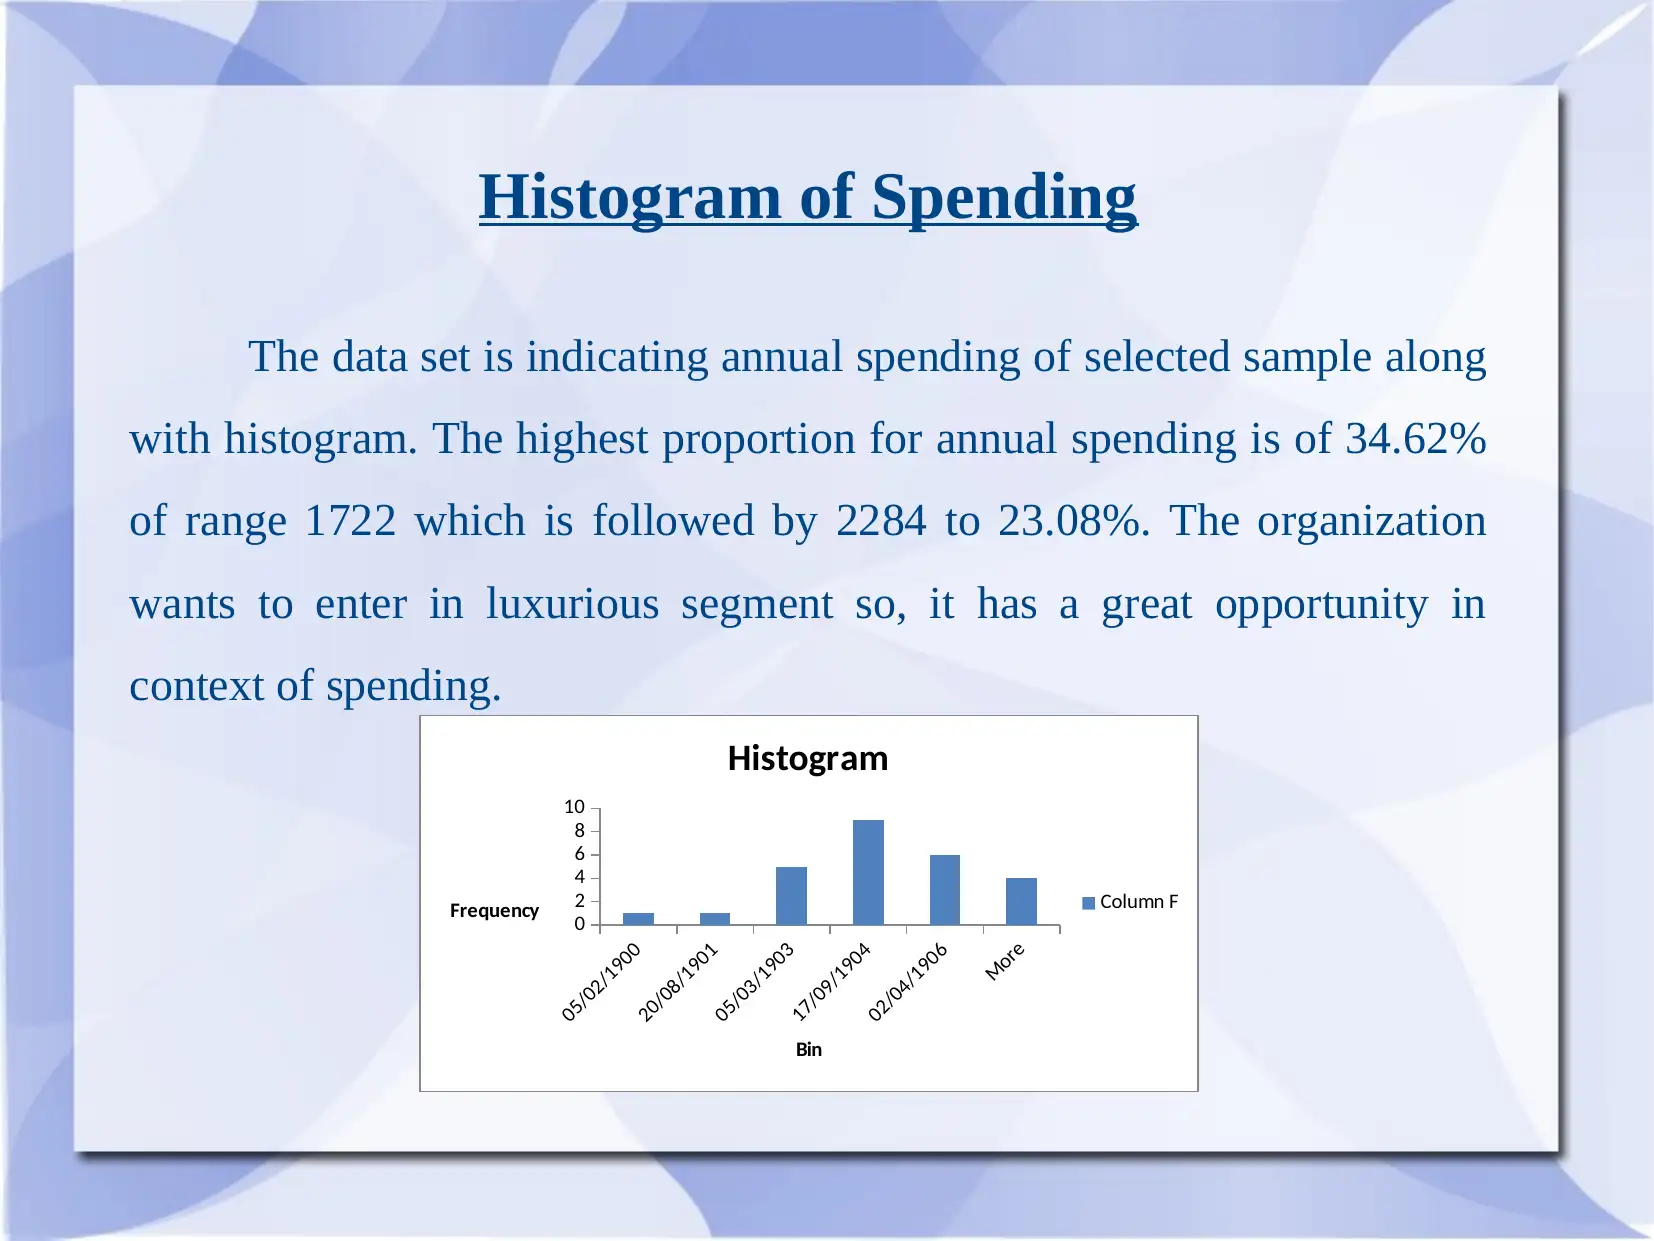
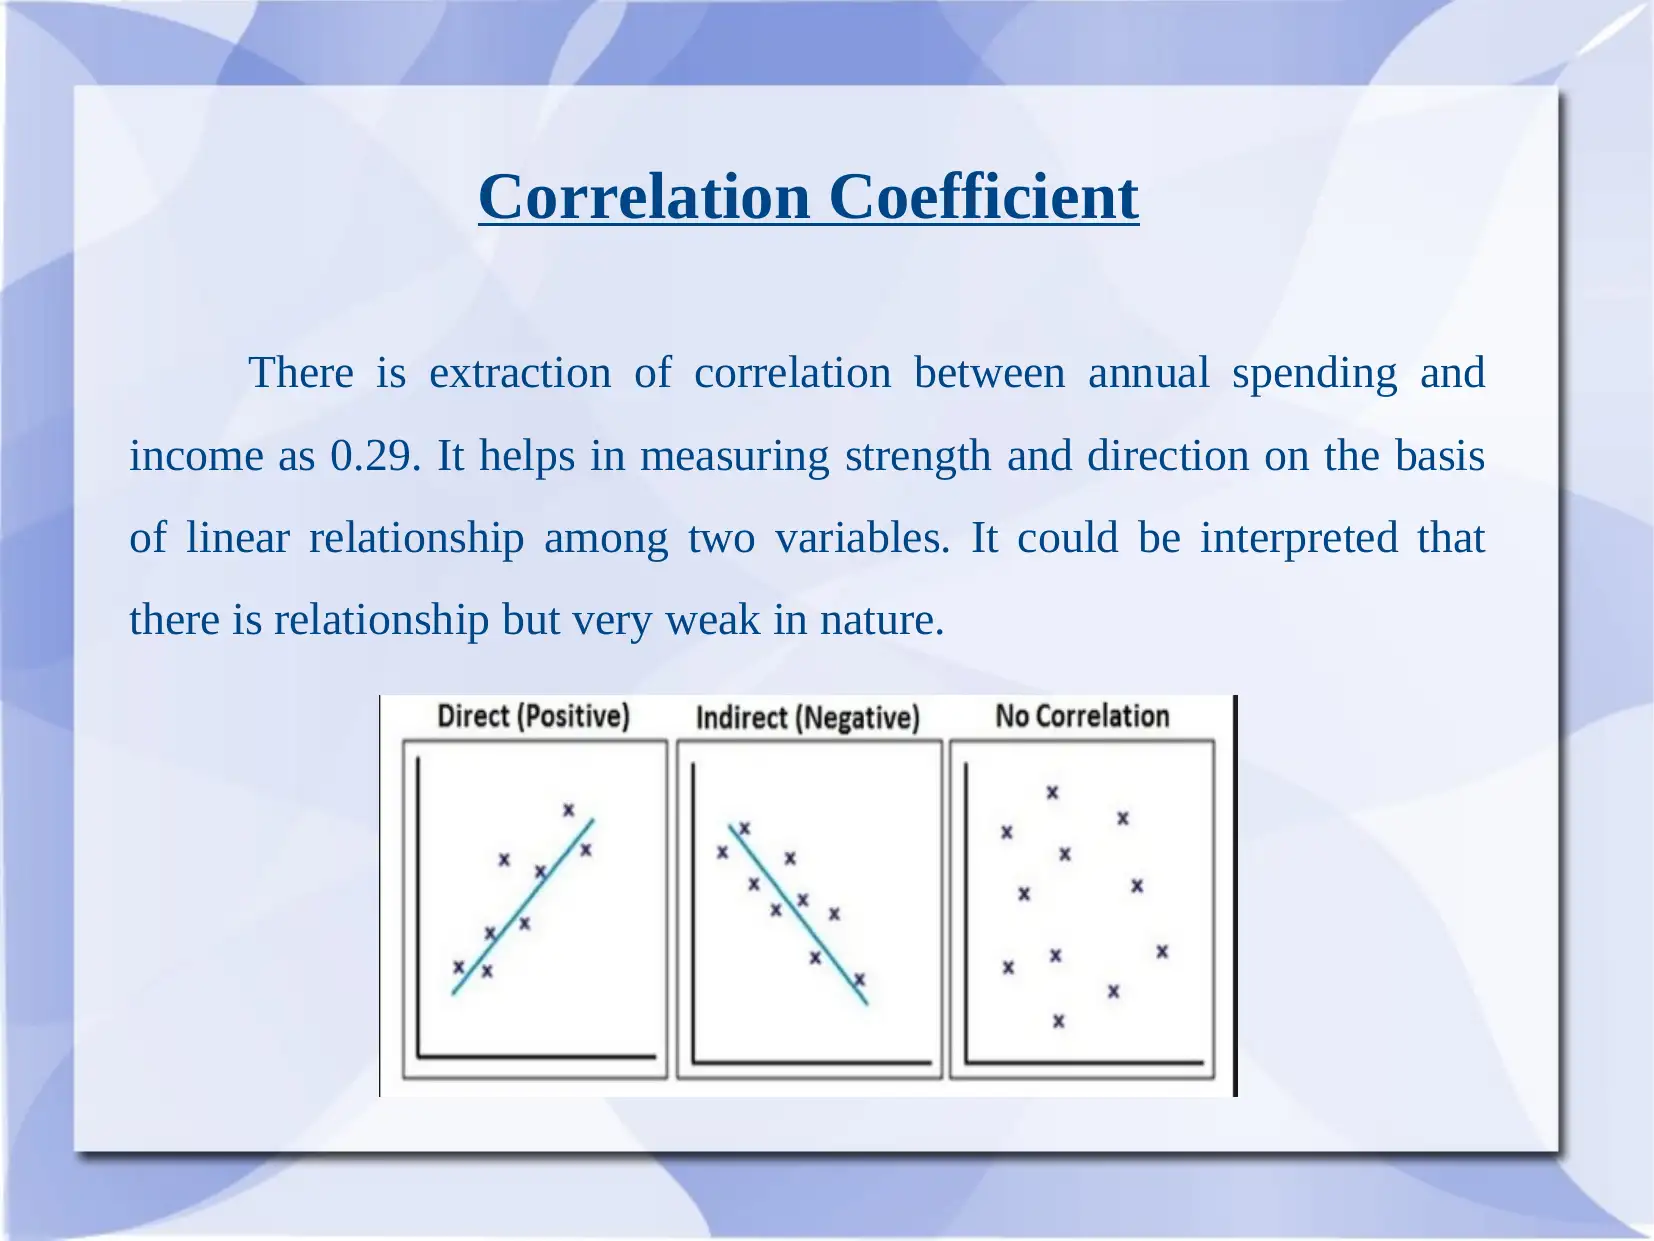
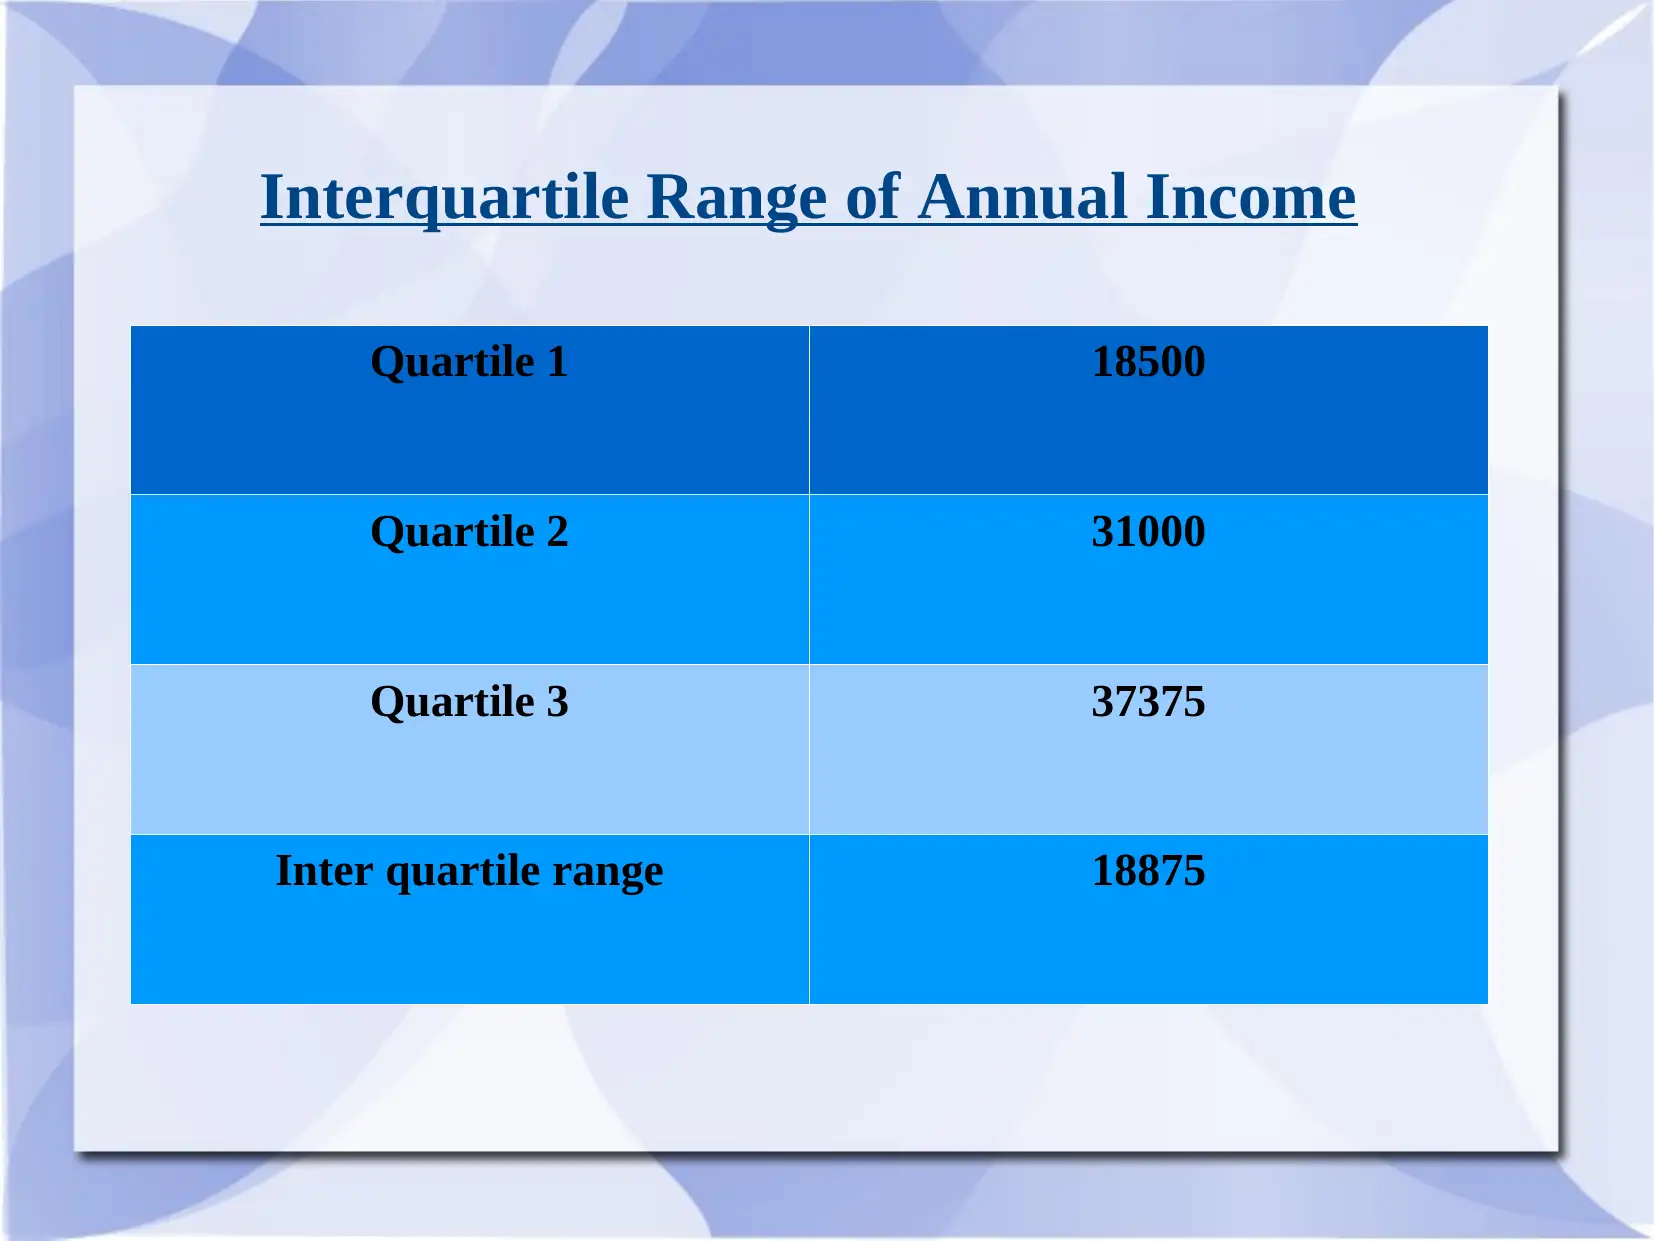
This presentation provides insights on descriptive statistics including mean, standard deviation, histogram, correlation coefficient, and interquartile range. It discusses the analysis of age and spending data, their relationship with income, and the distribution of age and spending. The presentation aims to help improve business decision making.
Contribute Materials
Your contribution can guide someone’s learning journey. Share your
documents today.


1 out of 10


Your All-in-One AI-Powered Toolkit for Academic Success.
+13062052269
info@desklib.com
Available 24*7 on WhatsApp / Email
![[object Object]](/_next/static/media/star-bottom.7253800d.svg)
© 2024 | Zucol Services PVT LTD | All rights reserved.