Business Decision Making
VerifiedAdded on 2022/12/26
|13
|3246
|60
AI Summary
This report explores the tools and techniques used in business decision making, such as cash flow analysis, current ratio, net profit margin, and debt-to-equity ratio. It also includes an analysis of data using graphs and charts for Unilever's fortune trading. The report covers primary and secondary sources for data collection, data sampling, mean, median, mode, and standard deviation. The subject is Business Decision Making and the document type is a report.
Contribute Materials
Your contribution can guide someone’s learning journey. Share your
documents today.
BUSINESS DECISION
MAKING
MAKING
Secure Best Marks with AI Grader
Need help grading? Try our AI Grader for instant feedback on your assignments.
TABLE OF CONTENTS
INTRODUCTION...............................................................................................................................3
MAIN BODY.......................................................................................................................................3
Primary and secondary sources for data collection............................................................................3
Data Sampling...................................................................................................................................4
Mean..................................................................................................................................................4
Median...............................................................................................................................................5
Mode.................................................................................................................................................5
Standard deviation.............................................................................................................................5
Tools and techniques for business decision making..........................................................................5
Graphs and charts to analyse information pertaining to Fortune trading............................................7
CONCLUSION..................................................................................................................................10
INTRODUCTION
Business decision making requires the application of various tools and techniques to
be adopted by the management and all the departments of the organization in order to address
multiple problems associated with the business. It requires many kinds of skills to be present
in the managers to such communication and analytical skills in order to effectively and
efficiently solve the business problem by making relevant decision for the same. Along with
these skills the management must be encompasses with the data collection, analysing and
presenting the same make a viable decision (Metcalf, Askay and Rosenberg, 2019). The
present report is based on various data collection sources including both primary and
secondary data sources, analysis techniques of collected data, tools and techniques for
making business decisions and at last by choosing a UK based organization that is, Unilever
here, and by using spreadsheet tool, the analysis will be done for fortune trading using graphs
and charts to draw reasonable conclusions.
MAIN BODY
Primary and secondary sources for data collection
Sources for collecting data are categorized into two types, that primary and secondary sources
of data collection.
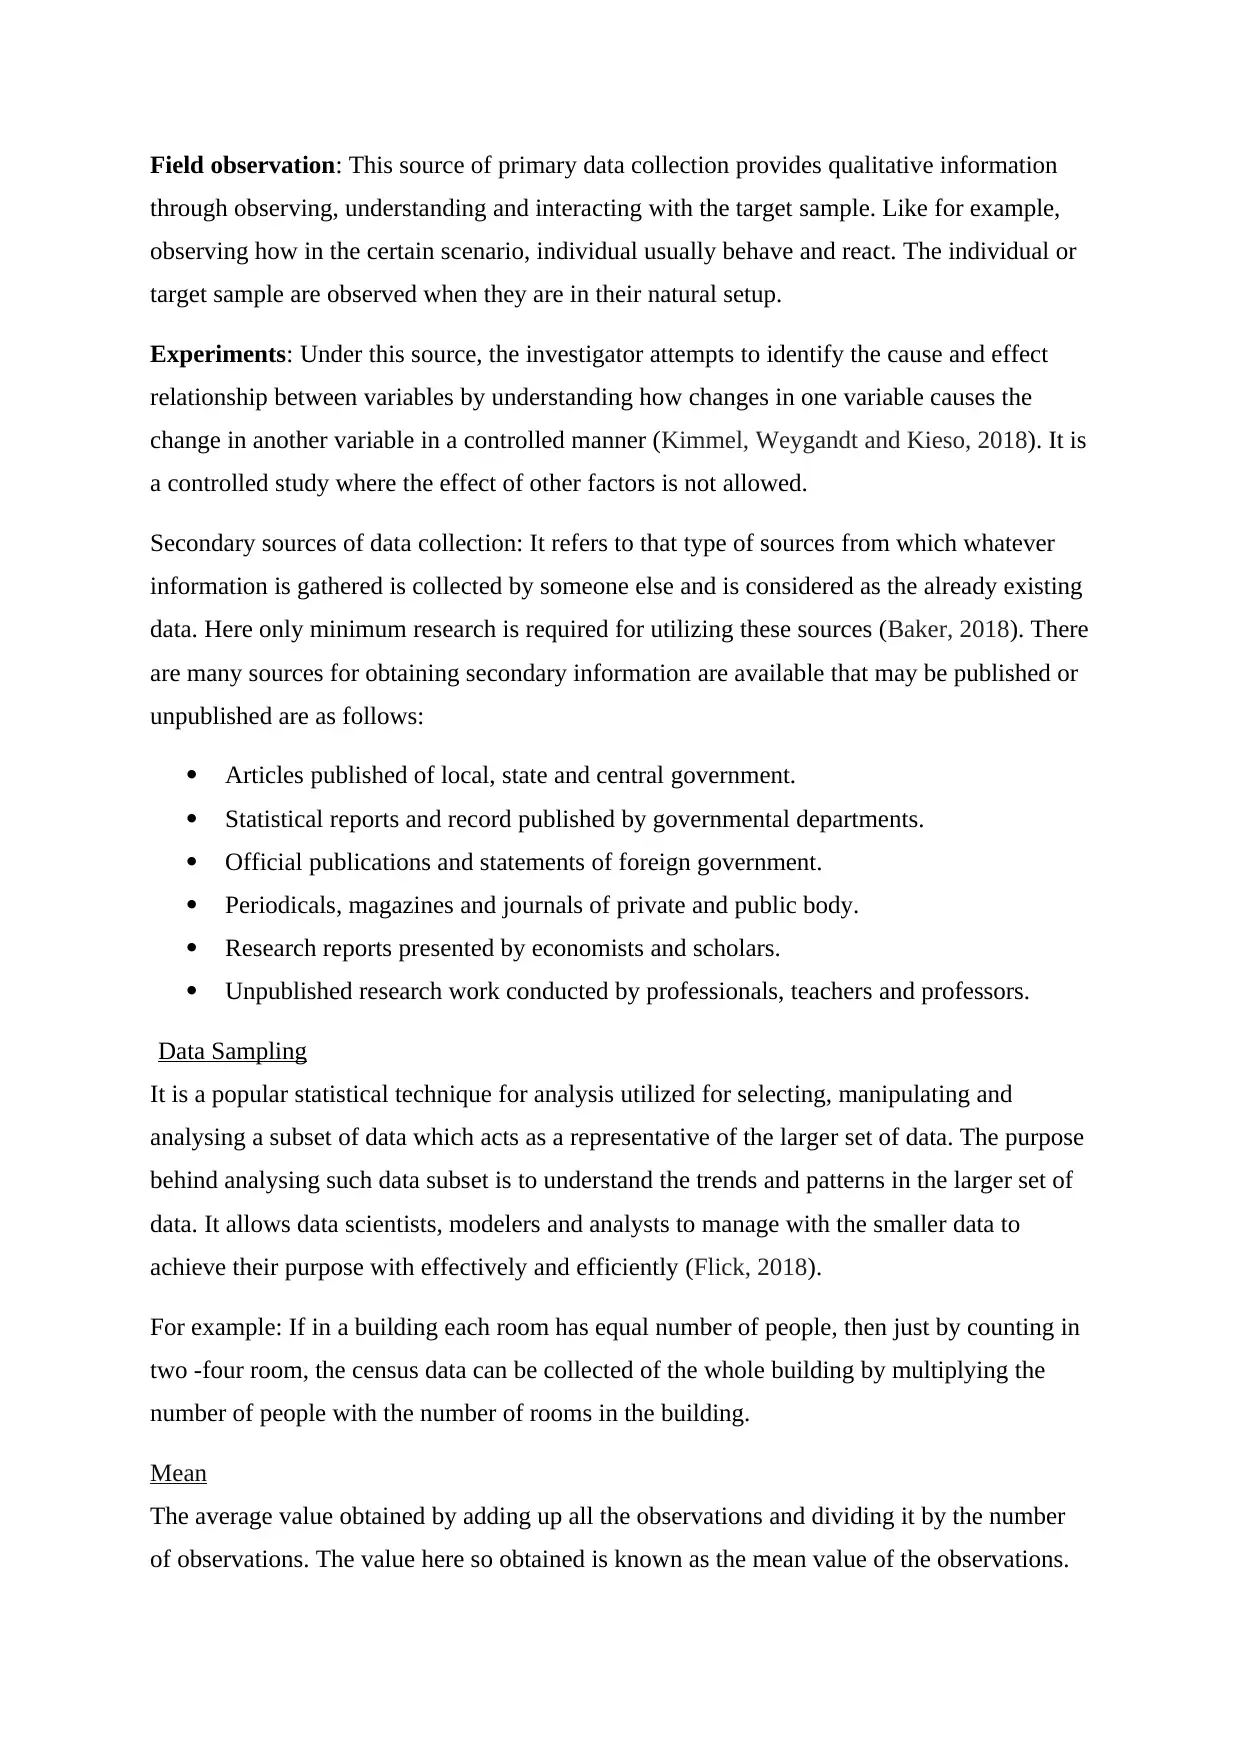
Primary data collection source: The data so collected from this type of source provide first-
hand data as the data is collected for the first time. The data or information is considered as
the more reliable and original. There are many sources available for collecting primary data
as follows:
Surveys: By creating a well-structured questionnaire, data has been collected by the
investigator. Questionnaire acts as an instrument for obtaining information from specific
group of people. It can also be done through phone calls, mails and through internet (Gong
and et.al., 2018).
Interviews: Interviews are considered as the structured questioning by an investigator to
respondents and the unique point here is, it takes place face to face between the investigator
and respondent. The method is more appropriate when there is need to obtain in depth
information related to individual’s thoughts, opinions, feelings and experiences. The
questions so asked in this method is generally open ended.
Business decision making requires the application of various tools and techniques to
be adopted by the management and all the departments of the organization in order to address
multiple problems associated with the business. It requires many kinds of skills to be present
in the managers to such communication and analytical skills in order to effectively and
efficiently solve the business problem by making relevant decision for the same. Along with
these skills the management must be encompasses with the data collection, analysing and
presenting the same make a viable decision (Metcalf, Askay and Rosenberg, 2019). The
present report is based on various data collection sources including both primary and
secondary data sources, analysis techniques of collected data, tools and techniques for
making business decisions and at last by choosing a UK based organization that is, Unilever
here, and by using spreadsheet tool, the analysis will be done for fortune trading using graphs
and charts to draw reasonable conclusions.
MAIN BODY
Primary and secondary sources for data collection
Sources for collecting data are categorized into two types, that primary and secondary sources
of data collection.
Primary data collection source: The data so collected from this type of source provide first-
hand data as the data is collected for the first time. The data or information is considered as
the more reliable and original. There are many sources available for collecting primary data
as follows:
Surveys: By creating a well-structured questionnaire, data has been collected by the
investigator. Questionnaire acts as an instrument for obtaining information from specific
group of people. It can also be done through phone calls, mails and through internet (Gong
and et.al., 2018).
Interviews: Interviews are considered as the structured questioning by an investigator to
respondents and the unique point here is, it takes place face to face between the investigator
and respondent. The method is more appropriate when there is need to obtain in depth
information related to individual’s thoughts, opinions, feelings and experiences. The
questions so asked in this method is generally open ended.
Field observation: This source of primary data collection provides qualitative information
through observing, understanding and interacting with the target sample. Like for example,
observing how in the certain scenario, individual usually behave and react. The individual or
target sample are observed when they are in their natural setup.
Experiments: Under this source, the investigator attempts to identify the cause and effect
relationship between variables by understanding how changes in one variable causes the
change in another variable in a controlled manner (Kimmel, Weygandt and Kieso, 2018). It is
a controlled study where the effect of other factors is not allowed.
Secondary sources of data collection: It refers to that type of sources from which whatever
information is gathered is collected by someone else and is considered as the already existing
data. Here only minimum research is required for utilizing these sources (Baker, 2018). There
are many sources for obtaining secondary information are available that may be published or
unpublished are as follows:
Articles published of local, state and central government.
Statistical reports and record published by governmental departments.
Official publications and statements of foreign government.
Periodicals, magazines and journals of private and public body.
Research reports presented by economists and scholars.
Unpublished research work conducted by professionals, teachers and professors.
Data Sampling
It is a popular statistical technique for analysis utilized for selecting, manipulating and
analysing a subset of data which acts as a representative of the larger set of data. The purpose
behind analysing such data subset is to understand the trends and patterns in the larger set of
data. It allows data scientists, modelers and analysts to manage with the smaller data to
achieve their purpose with effectively and efficiently (Flick, 2018).
For example: If in a building each room has equal number of people, then just by counting in
two -four room, the census data can be collected of the whole building by multiplying the
number of people with the number of rooms in the building.
Mean
The average value obtained by adding up all the observations and dividing it by the number
of observations. The value here so obtained is known as the mean value of the observations.
Secure Best Marks with AI Grader
Need help grading? Try our AI Grader for instant feedback on your assignments.
For example: if weight of 10 people is obtained as 58,65,52,53,56,59,62,60,64,66. Now by
adding up all these value we get 595, and by diving the same with the number of observations
that is 10, the derived mean value is 59.5.
Median
The middle value in the series of data is known as the median of the series. In order to obtain
the median, arrange the series either in ascending or descending order, then the value located
in the middle of the series will be taken the median value.
For example: The series of marks obtained by 5 students are as follows; 65,66,62,63,61. Here
first of all the series will be arranged in ascending order as 61,62,63,65,66 and then the
middle value 63 will be taken as the median of the series. Or if we have even number of
observations like in place of 5 we 6 student’s marks as 61,62,63,64,65,66; then the median
will be the half of sum of 63 and 64 (63+64/2) = 63.5.
Mode
The most frequently occurring value of the series will be taken as the mode of the series. In
order to find mode, the series must be first arranged in ascending or descending order.
For example, if the marks obtained by 10 students are as follows:
78,79,78,77,77,89,77,55,66,53; so to find the mode first the series will be arranged in
ascending order as 53,55,66,77,77,77,78,78,79,89. So the mode of this series is 77, as it
appears most of the time in the given series.
Standard deviation
It is a statistical tool to measure the dispersion in a series of data with reference to the mean
value of the series. It is also determined by doing square root of the variance of the series. It
is calculated by identifying how much deviation exists between each value from the mean
value of the series (Clark, and Vealé, 2018). If the values of the series are far away from the
mean, then there will be higher standard deviation and it is known as more spread out values
in the series.
Tools and techniques for business decision making
Business decision making involves in depth analysis of various aspects associated within the
business and outside the business. Such analysis is done through various financial and non-
financial tools and techniques which are generally acceptable and advisable to be utilized by
the management while making major decision related to the business. Through these
techniques and tools, management can make viable decision both in advance and whenever
required. There are many business decisions making tools and techniques used by the modern
businesses as follows:
Cash flow analysis: The most common technique or financial statement is the cash flow
statement. It is limited to just one page where information from various sources associated
with business are compiled. It indicates the inflows and outflows of cash to and from the
business respectively. It lists out all the cash flow activities and based on which projection of
future cash flows is determined and it is known as cash flow budget (Moser and Korstjens,
2018). It helps in knowing the cash management and cash position within the company to
know how well a company is meeting its debt obligations and operating expenses by
generating cash from its operation. Cash flow from operations itself determines the
performance of company’s operations. Thus, cash flow statement is helpful to the decision
makers in making liquidity related decisions for the businesses to ensure long term liquidity
of the business.
Current ratio: It indicates the business’s liquidity position and its ability to meet short term
obligations that are falling within the duration of one year. The analysts can find out through
this ratio, the need to maximise the current assets in order to make ensure that the payables
and short-term debt will be met on time. The current ratio is the comparison between the
company’s current assets and liabilities (Manu and et.al., 2021). These assets include cash
and cash equivalents that can be converted into cash within a year and liabilities that are
becoming due within one year. The current ratio is also known as working capital ratio.
Weakness of current ratio indicated company’s inability to meet its nearer obligations and
higher current ratio indicates idle cash into the business which can be invested for further
profitability. The generally acceptable ratio is 1.33 and the same is obtained by dividing the
current assets with current liabilities of the business. Current assets include cash and cash
equivalents, marketable securities, accounts receivables, inventory and pre-paid expenses
while the current liability includes short term debts, accounts payables, etc., This ratio is
helpful for decision makers to know the business’s short term liquidity and making decisions
to avoid the risks of short term insolvency.
Net profit margin: This ratio is an indication of a business’s profitability. It is calculated in
terms of percentage indicating a company’s ability to generate profit from its revenue
generating activities. The formula for calculating net profit margin is net profit or net income
of the business divided by the business’s total revenue multiply by 100. Net profit is obtained
after deducting operating expenses, interests and taxes, dividend on preference shares. Total
revenue is obtained by multiplying the quantity sold with the selling price and then direct,
operating and non-operating expenses are deducted to arrive at the net profit of the business
(Fairbanks and Buchko, 2018). For example, a company’s net profit obtained after deducting
all the expenses from the revenue as 5000 and the total revenue of the business is 11000 then
the net profit margin in this case would be 45.45%. This ratio is helpful for the decision
makers in improving their sales and reducing unnecessary expenses to increase the net profit
margin of the business.
Debt-to-equity ratio: This ratio is calculated to know the company’s long-term solvency.
The ratio is obtained by dividing the company’s total liabilities with the equity associated
with the shareholders. The figures of liabilities and shareholder’s equity are obtained from
company’s balance sheet. The ratio is an indicative of financial leverage available to the
business and considered as an important concept of financial management (Ishizaka and
Siraj, 2018). It measures and indicate the proportion of fund invested in the company’s
operations that is being obtained through debt over owned funds and in turn allows for
knowing the business ability to meet long term liabilities through its owned fund in the event
of business failure. Also, the ratio indicates the overall capital structure of the company along
with the financial risk associated with the business. The total liabilities include short term and
long-term debt and fixed obligatory payments, and this then divided by shareholder’s equity
to arrive at the debt-equity ratio. Through this ratio, decision makers can make decisions for
reducing financial risks and ensure that the business will be protected from insolvency in the
future.
Graphs and charts to analyse information pertaining to Fortune trading
In this section of the report, by producing charts and graphs with the help of spreadsheet tool,
various information and data associated with the business that is Unilever will be analysed in
terms of identifying various trends and patterns in the past data in order to forecast the future
position of the business. Graphical representation is very helpful in viewing and analysing
data in a more simplified and realistic manner. And doing such representation through
spreadsheet has proved to be quicker and better visualised data (Unilever PLCULVR. 2021).
In the following section, there are various charts and graphs for Unilever has been produced:
Paraphrase This Document
Need a fresh take? Get an instant paraphrase of this document with our AI Paraphraser
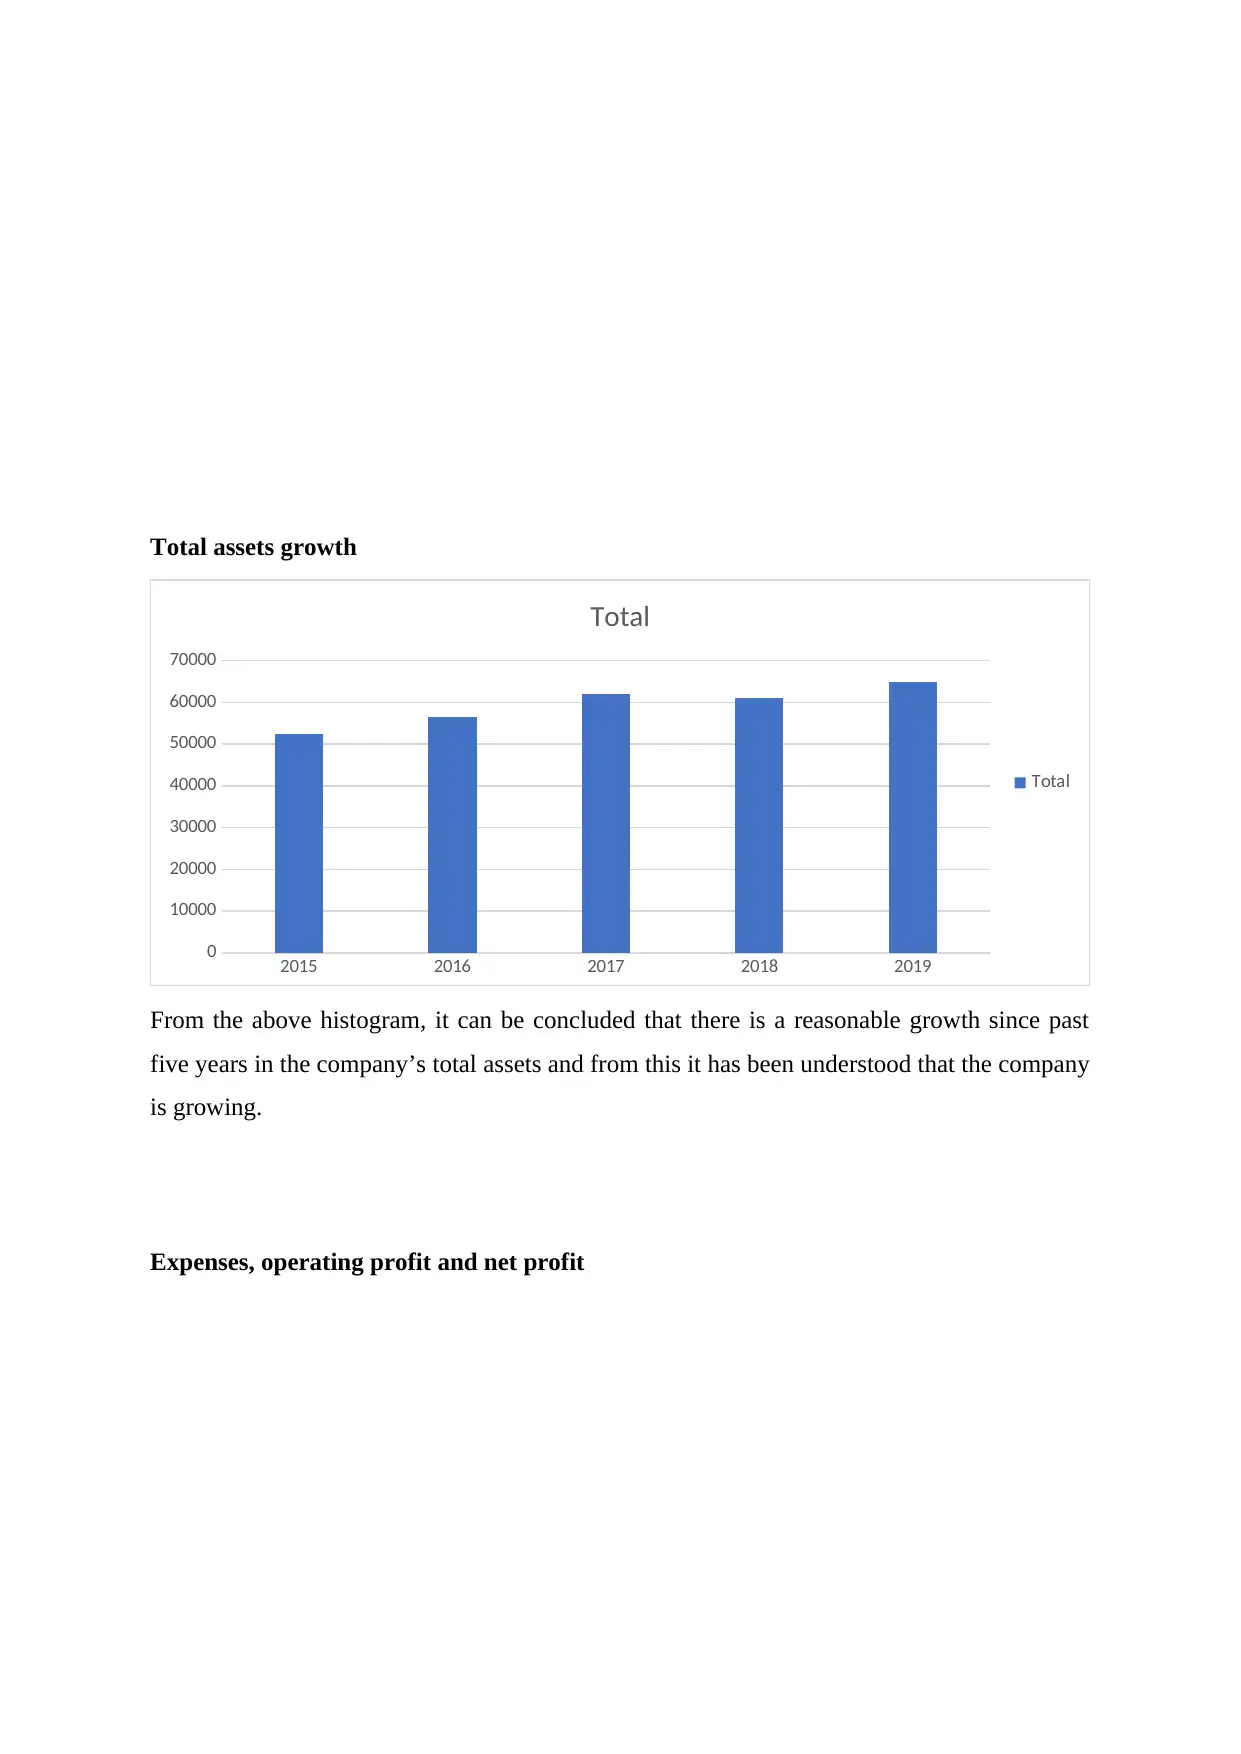
Total assets growth
2015 2016 2017 2018 2019
0
10000
20000
30000
40000
50000
60000
70000
Total
Total
From the above histogram, it can be concluded that there is a reasonable growth since past
five years in the company’s total assets and from this it has been understood that the company
is growing.
Expenses, operating profit and net profit
2015 2016 2017 2018 2019
0
5000
10000
15000
20000
25000
30000
35000
40000
45000
50000
Sum of expenses
Sum of operating profit
Sum of net profit
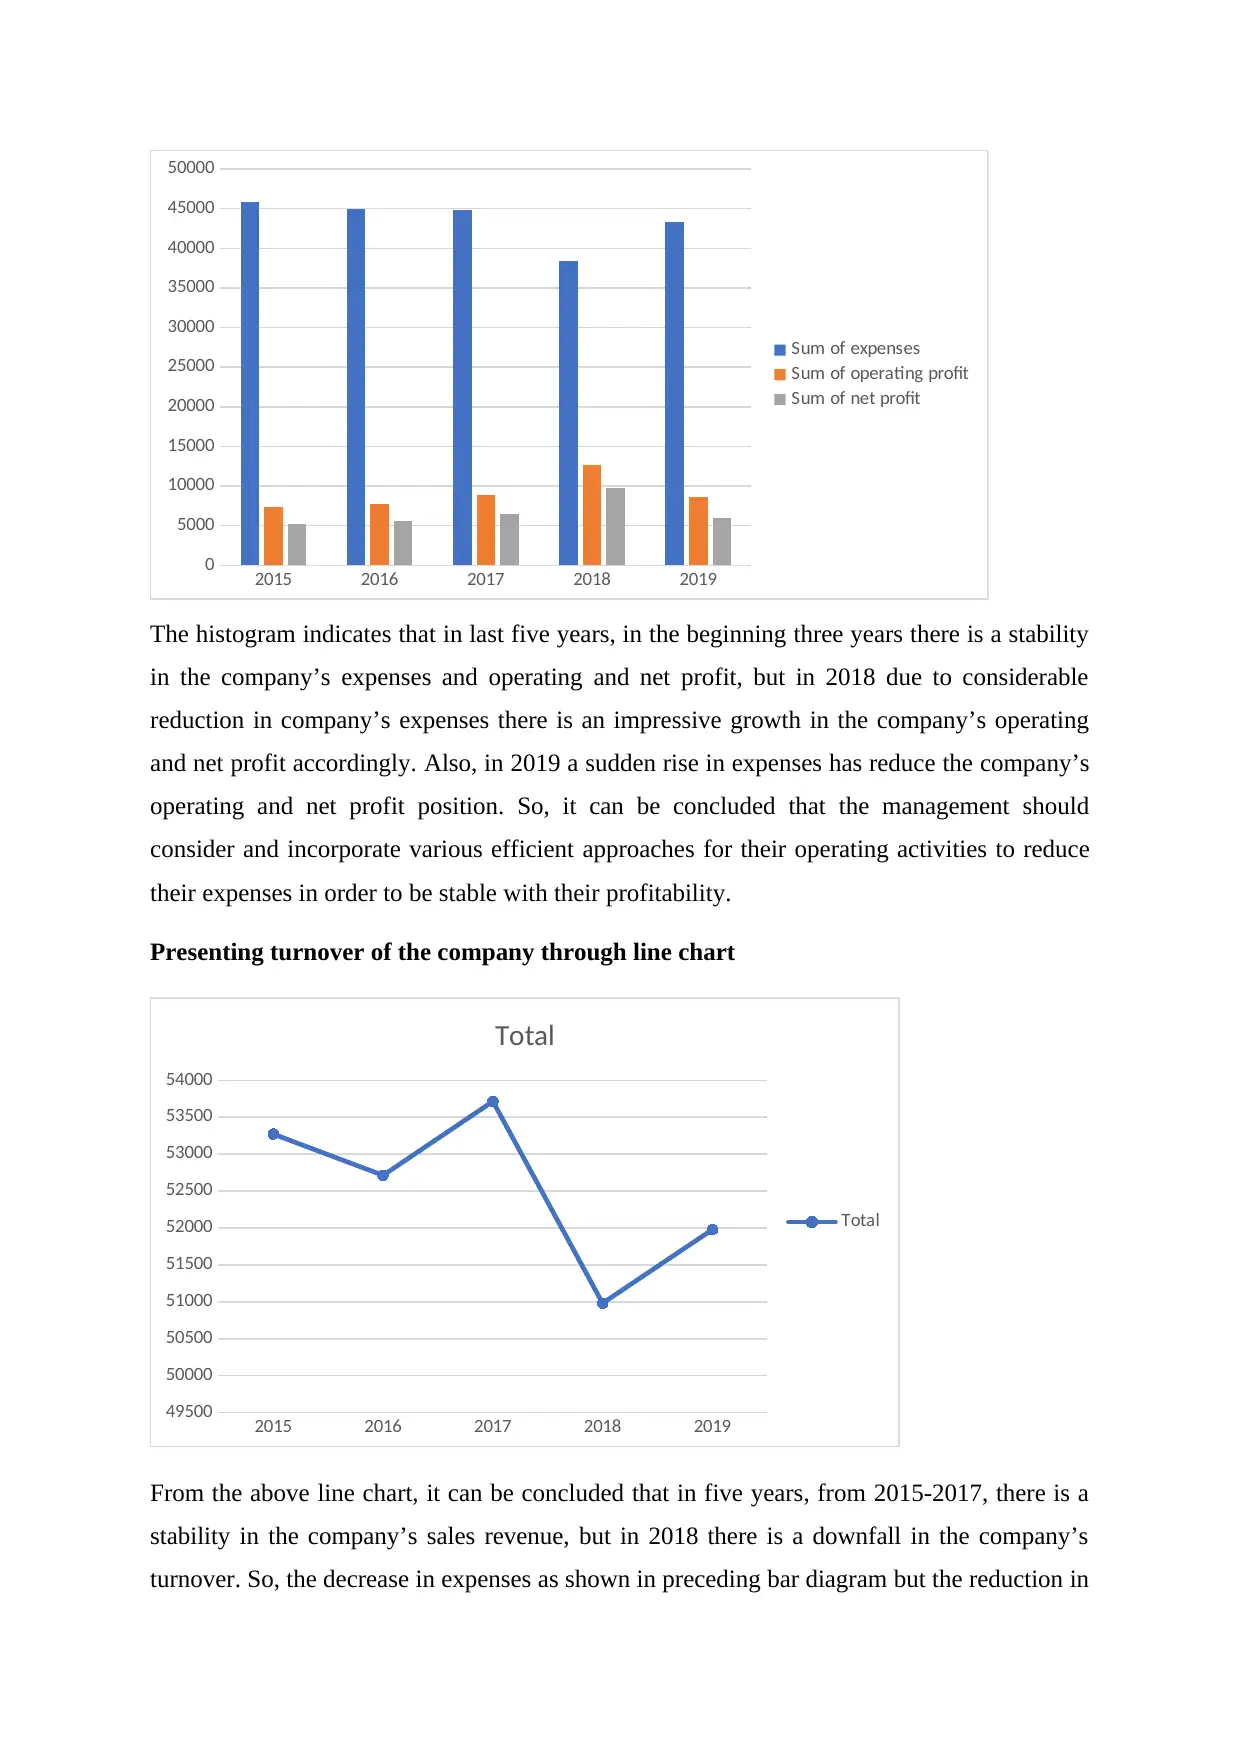
The histogram indicates that in last five years, in the beginning three years there is a stability
in the company’s expenses and operating and net profit, but in 2018 due to considerable
reduction in company’s expenses there is an impressive growth in the company’s operating
and net profit accordingly. Also, in 2019 a sudden rise in expenses has reduce the company’s
operating and net profit position. So, it can be concluded that the management should
consider and incorporate various efficient approaches for their operating activities to reduce
their expenses in order to be stable with their profitability.
Presenting turnover of the company through line chart
2015 2016 2017 2018 2019
49500
50000
50500
51000
51500
52000
52500
53000
53500
54000
Total
Total
From the above line chart, it can be concluded that in five years, from 2015-2017, there is a
stability in the company’s sales revenue, but in 2018 there is a downfall in the company’s
turnover. So, the decrease in expenses as shown in preceding bar diagram but the reduction in
0
5000
10000
15000
20000
25000
30000
35000
40000
45000
50000
Sum of expenses
Sum of operating profit
Sum of net profit
The histogram indicates that in last five years, in the beginning three years there is a stability
in the company’s expenses and operating and net profit, but in 2018 due to considerable
reduction in company’s expenses there is an impressive growth in the company’s operating
and net profit accordingly. Also, in 2019 a sudden rise in expenses has reduce the company’s
operating and net profit position. So, it can be concluded that the management should
consider and incorporate various efficient approaches for their operating activities to reduce
their expenses in order to be stable with their profitability.
Presenting turnover of the company through line chart
2015 2016 2017 2018 2019
49500
50000
50500
51000
51500
52000
52500
53000
53500
54000
Total
Total
From the above line chart, it can be concluded that in five years, from 2015-2017, there is a
stability in the company’s sales revenue, but in 2018 there is a downfall in the company’s
turnover. So, the decrease in expenses as shown in preceding bar diagram but the reduction in
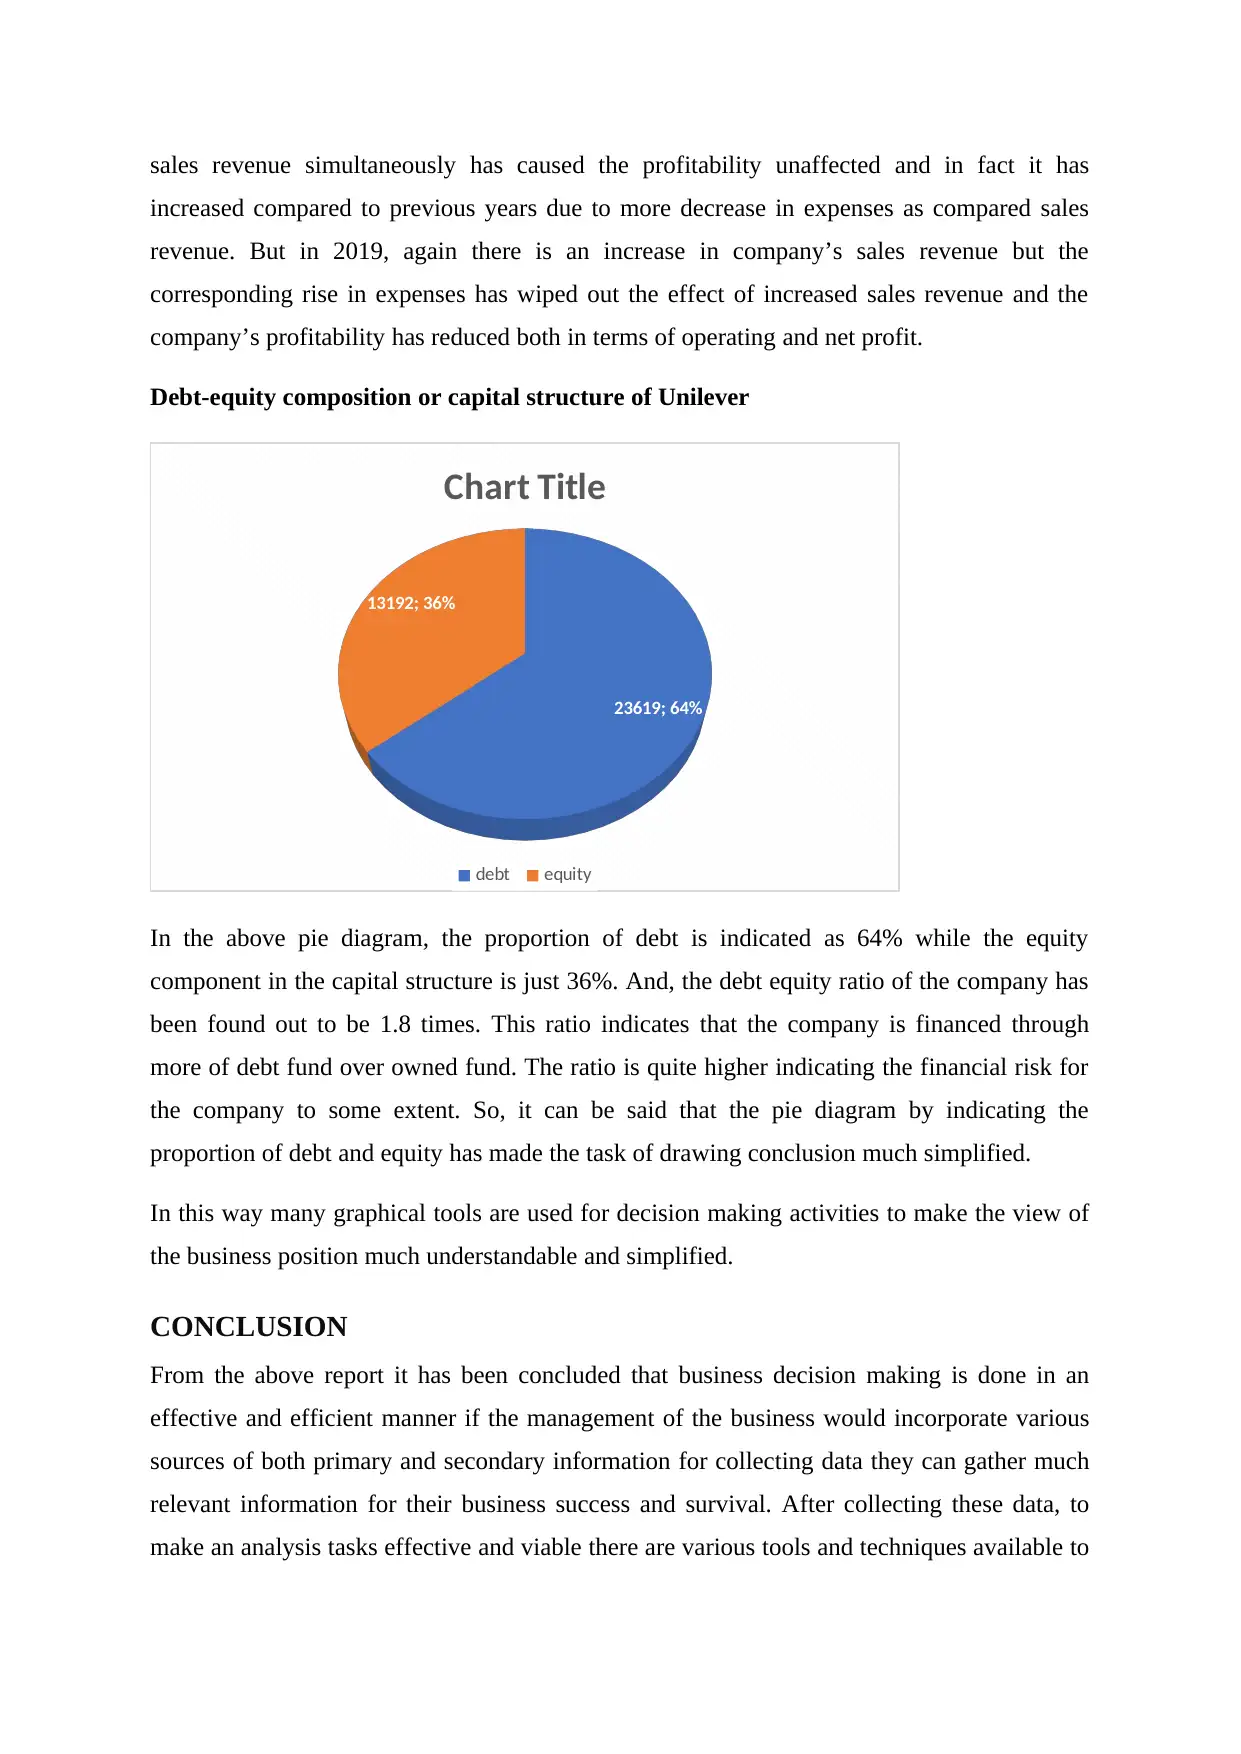
sales revenue simultaneously has caused the profitability unaffected and in fact it has
increased compared to previous years due to more decrease in expenses as compared sales
revenue. But in 2019, again there is an increase in company’s sales revenue but the
corresponding rise in expenses has wiped out the effect of increased sales revenue and the
company’s profitability has reduced both in terms of operating and net profit.
Debt-equity composition or capital structure of Unilever
23619; 64%
13192; 36%
Chart Title
debt equity
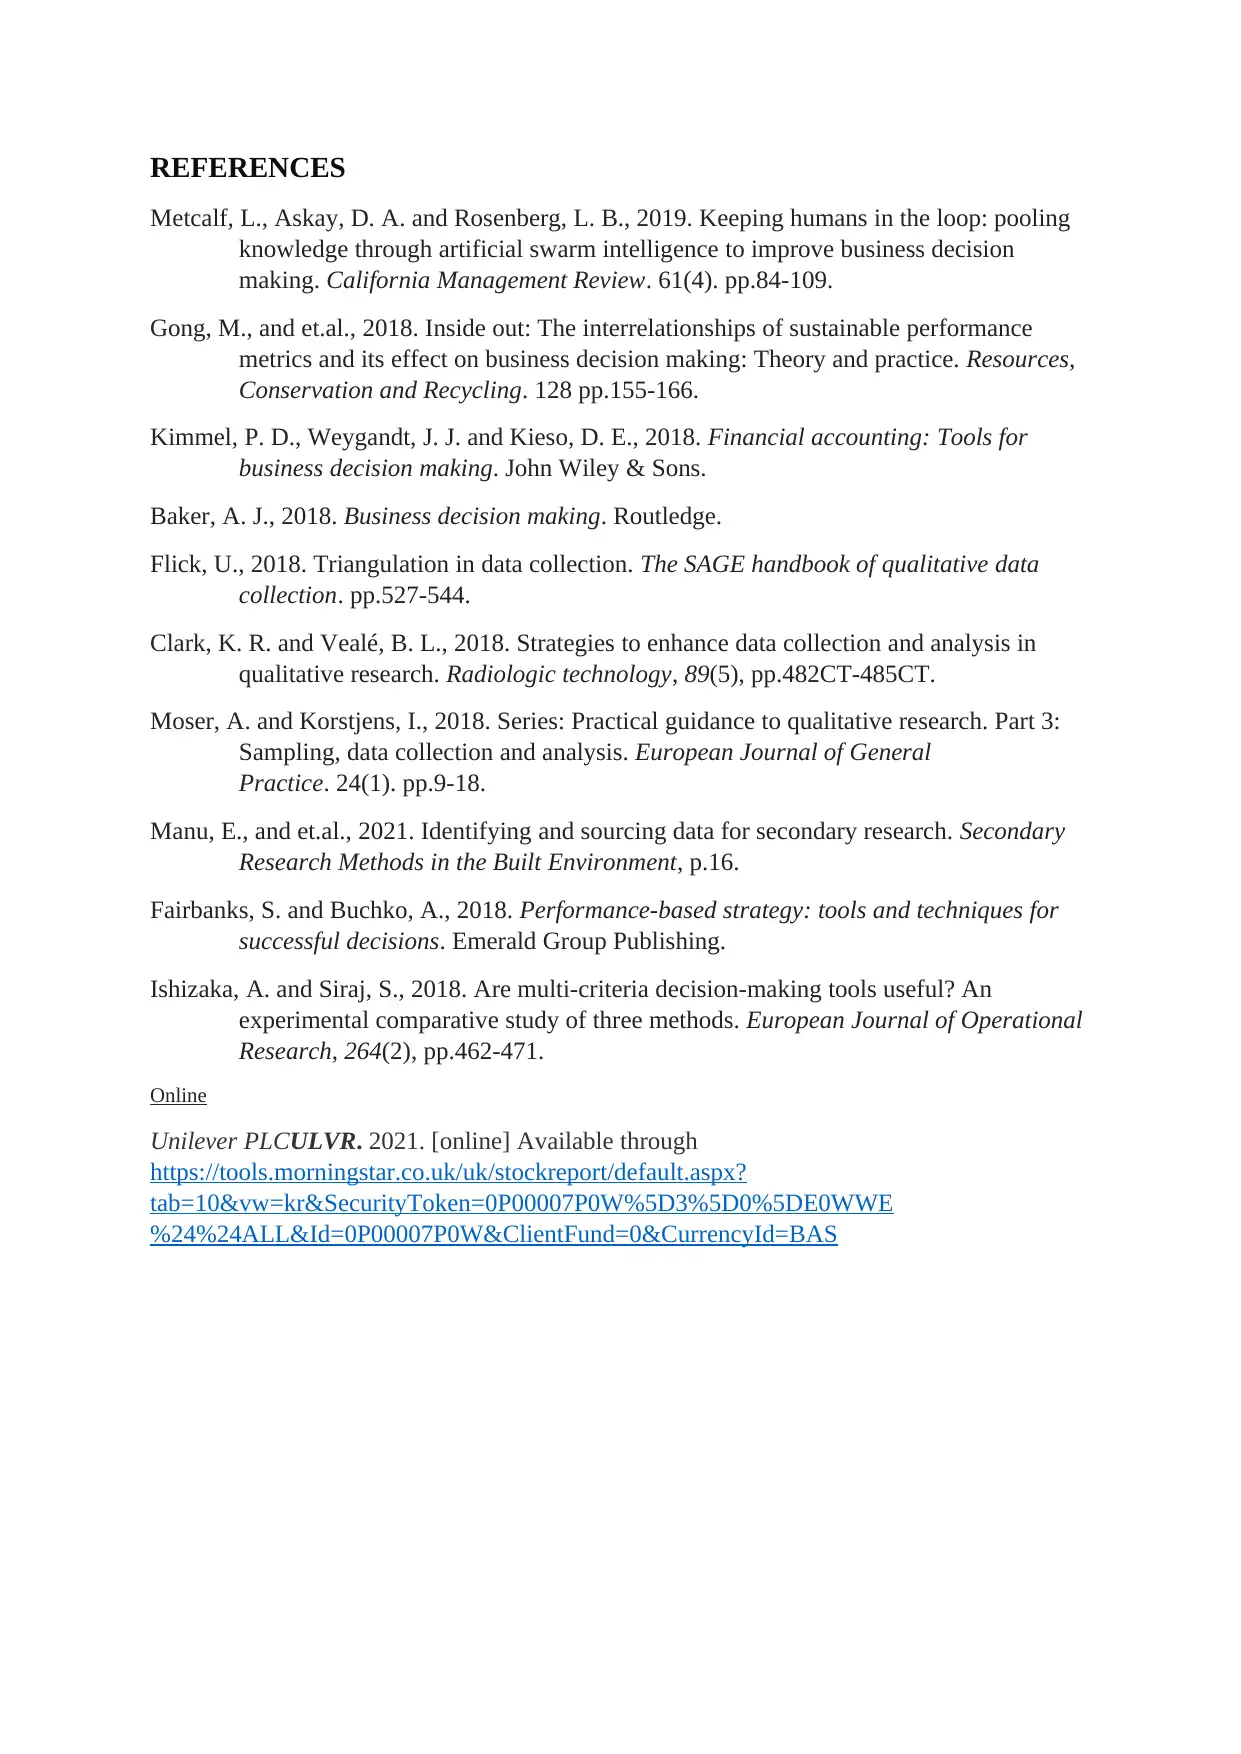
In the above pie diagram, the proportion of debt is indicated as 64% while the equity
component in the capital structure is just 36%. And, the debt equity ratio of the company has
been found out to be 1.8 times. This ratio indicates that the company is financed through
more of debt fund over owned fund. The ratio is quite higher indicating the financial risk for
the company to some extent. So, it can be said that the pie diagram by indicating the
proportion of debt and equity has made the task of drawing conclusion much simplified.
In this way many graphical tools are used for decision making activities to make the view of
the business position much understandable and simplified.
CONCLUSION
From the above report it has been concluded that business decision making is done in an
effective and efficient manner if the management of the business would incorporate various
sources of both primary and secondary information for collecting data they can gather much
relevant information for their business success and survival. After collecting these data, to
make an analysis tasks effective and viable there are various tools and techniques available to
increased compared to previous years due to more decrease in expenses as compared sales
revenue. But in 2019, again there is an increase in company’s sales revenue but the
corresponding rise in expenses has wiped out the effect of increased sales revenue and the
company’s profitability has reduced both in terms of operating and net profit.
Debt-equity composition or capital structure of Unilever
23619; 64%
13192; 36%
Chart Title
debt equity
In the above pie diagram, the proportion of debt is indicated as 64% while the equity
component in the capital structure is just 36%. And, the debt equity ratio of the company has
been found out to be 1.8 times. This ratio indicates that the company is financed through
more of debt fund over owned fund. The ratio is quite higher indicating the financial risk for
the company to some extent. So, it can be said that the pie diagram by indicating the
proportion of debt and equity has made the task of drawing conclusion much simplified.
In this way many graphical tools are used for decision making activities to make the view of
the business position much understandable and simplified.
CONCLUSION
From the above report it has been concluded that business decision making is done in an
effective and efficient manner if the management of the business would incorporate various
sources of both primary and secondary information for collecting data they can gather much
relevant information for their business success and survival. After collecting these data, to
make an analysis tasks effective and viable there are various tools and techniques available to
Secure Best Marks with AI Grader
Need help grading? Try our AI Grader for instant feedback on your assignments.

analyse the data, so that any deficiency prevailing in the business operations can be identified
beforehand and accordingly to remove such deficiency reasonable decision can be made at
the right time. At last, various charts and graphs are produced with the available information
of Unilever and accordingly conclusions are drawn based on what these graphical
representations indicates.
beforehand and accordingly to remove such deficiency reasonable decision can be made at
the right time. At last, various charts and graphs are produced with the available information
of Unilever and accordingly conclusions are drawn based on what these graphical
representations indicates.
REFERENCES
Metcalf, L., Askay, D. A. and Rosenberg, L. B., 2019. Keeping humans in the loop: pooling
knowledge through artificial swarm intelligence to improve business decision
making. California Management Review. 61(4). pp.84-109.
Gong, M., and et.al., 2018. Inside out: The interrelationships of sustainable performance
metrics and its effect on business decision making: Theory and practice. Resources,
Conservation and Recycling. 128 pp.155-166.
Kimmel, P. D., Weygandt, J. J. and Kieso, D. E., 2018. Financial accounting: Tools for
business decision making. John Wiley & Sons.
Baker, A. J., 2018. Business decision making. Routledge.
Flick, U., 2018. Triangulation in data collection. The SAGE handbook of qualitative data
collection. pp.527-544.
Clark, K. R. and Vealé, B. L., 2018. Strategies to enhance data collection and analysis in
qualitative research. Radiologic technology, 89(5), pp.482CT-485CT.
Moser, A. and Korstjens, I., 2018. Series: Practical guidance to qualitative research. Part 3:
Sampling, data collection and analysis. European Journal of General
Practice. 24(1). pp.9-18.
Manu, E., and et.al., 2021. Identifying and sourcing data for secondary research. Secondary
Research Methods in the Built Environment, p.16.
Fairbanks, S. and Buchko, A., 2018. Performance-based strategy: tools and techniques for
successful decisions. Emerald Group Publishing.
Ishizaka, A. and Siraj, S., 2018. Are multi-criteria decision-making tools useful? An
experimental comparative study of three methods. European Journal of Operational
Research, 264(2), pp.462-471.
Online
Unilever PLCULVR. 2021. [online] Available through
https://tools.morningstar.co.uk/uk/stockreport/default.aspx?
tab=10&vw=kr&SecurityToken=0P00007P0W%5D3%5D0%5DE0WWE
%24%24ALL&Id=0P00007P0W&ClientFund=0&CurrencyId=BAS

1 out of 13
Related Documents


Your All-in-One AI-Powered Toolkit for Academic Success.
+13062052269
info@desklib.com
Available 24*7 on WhatsApp / Email
![[object Object]](/_next/static/media/star-bottom.7253800d.svg)
Unlock your academic potential
© 2024 | Zucol Services PVT LTD | All rights reserved.