Decision Making Process in Organisational Context
VerifiedAdded on 2020/07/23
|21
|4283
|25
AI Summary
The report outlines a decision-making process to expand business scale at the next level, involving analysis of financial performance and primary sources of data collection. Various techniques are employed to effectively analyse data for business purposes. The document concludes by referencing relevant literature on decision-making processes.
Contribute Materials
Your contribution can guide someone’s learning journey. Share your
documents today.

BUSINESS DECISION
MAKING
MAKING
Secure Best Marks with AI Grader
Need help grading? Try our AI Grader for instant feedback on your assignments.
Table of Contents
INTRODUTION..............................................................................................................................1
TASK 1 ...........................................................................................................................................1
1.1 Plan for gathering collection of primary and secondary data for given business problem...1
1.2 Survey methodology and sampling frame.............................................................................2
1.3 Questionnaire for a given business problem.........................................................................3
TASK 2............................................................................................................................................4
2.1 Information for decision making by summarising data using representative values............4
2.2 Results to draw valid conclusion in a business context........................................................6
2.3 Data using measures of dispersion to inform a given business scenario..............................8
2.4 Use of quartiles, percentiles and the correlation coefficient subject to draw useful
conclusion...................................................................................................................................8
TASK 3............................................................................................................................................8
3.1 Graphs using spreadsheets and conclusion based on information........................................8
3.2 Trend lines in graphs to assist in forecasting for specified business...................................13
3.3 Business presentation using suitable software and techniques...........................................14
3.4 Business report....................................................................................................................14
TASK 4..........................................................................................................................................15
4.1 Use of proper information as processing tool.....................................................................15
4.2 Project plan for an activity and evaluate the critical path...................................................16
4.3 Financial tools for decision making....................................................................................17
CONCLUSION..............................................................................................................................18
REFERENCES..............................................................................................................................19
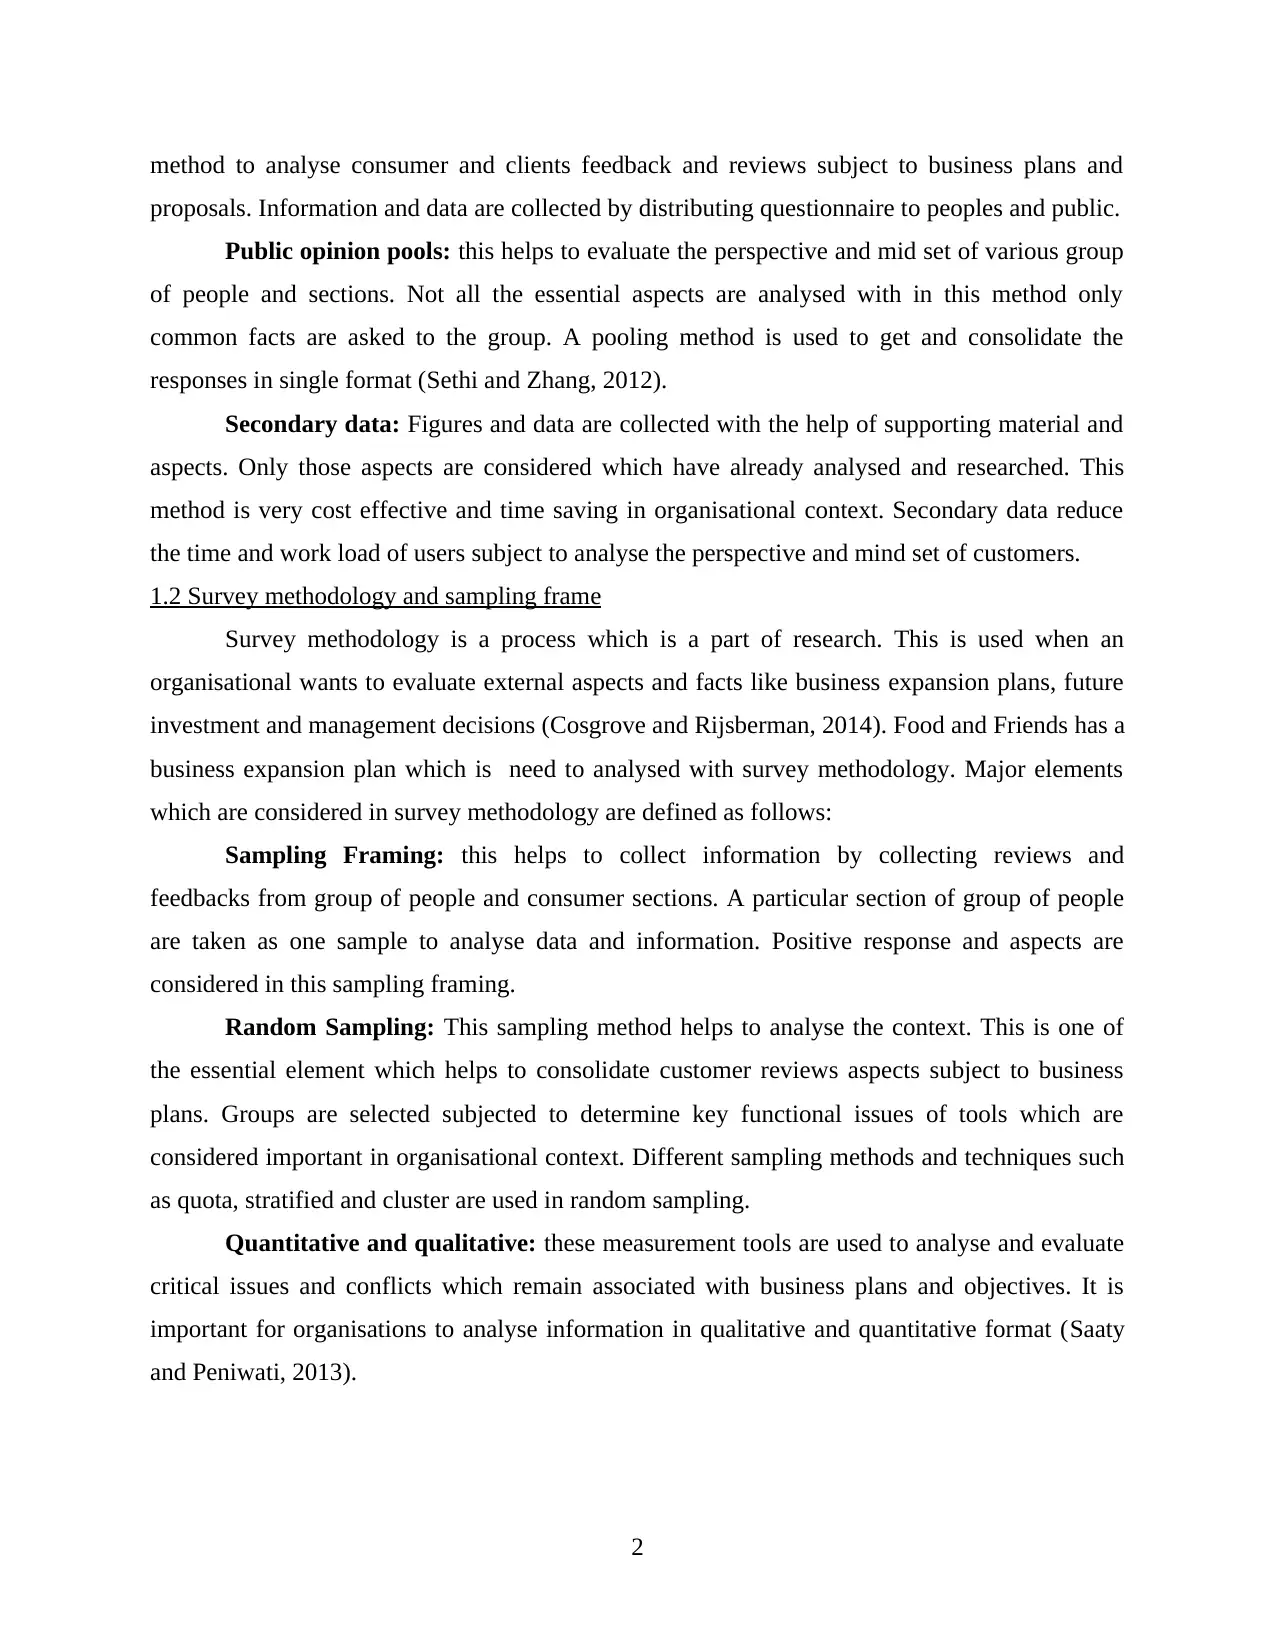
INTRODUTION
Business decision making is a process which helps to analyse the business proposals,
issues and expansion plans. This process assist forecasting and decision making activities in
order to take important decisions and effective management. Success of business remains depend
upon important and big decisions at right time (Yang and et. al., 2011). This report defines that
how good decisions helps to boost the structure of business at next level. Best results can only be
achieved by analysing effective investment decisions. Food and friends restaurant wants to
expand the business size in the UK. Decision making process is carried out subject to analysing
customer preferences and profitable decision.
TASK 1
1.1 Plan for gathering collection of primary and secondary data for given business problem
New project proposals and investment plans are adopted by organisation to analyse
effectiveness of performance of organisation. This basically assist managers to make effective
strategies and plans after analysing customer perspective. Food and friends is one of the popular
restaurant chain in USA. This business deals in delicious food products and dishes across various
places in America. Managers wants to expand the business size of organisation and open new
restaurant chain in the UK. Subject to above business expansion proposal following information
need to analyse by different collecting methods such as:
Primary Data: information and data which are collected by direct interaction with
people and objects are considered in primary data. Primary data which are collected by personal
interaction and direct analysis of proposals, plans and problems. Information and data remain
reliable and credible at initial stage. Users get accurate and relevant information through primary
data. This takes too much time to get customer perspective and reviews from respondents (Tzeng
and Huang, 2011).
Research: this is considered as a brief analysis and study subject to analyse the future
growth possibilities and plans for better analysation of business problems and business plans. It
is considered one of the cost consuming and time consuming process of collecting information.
This method provides accurate and more reliable aspects subject to business plans. This
methodology basically used to analyse in-depth knowledge of subject.
Questionnaire: this method helps to collect the data and information subject to analyse
customer reviews and plans for better effectiveness of tasks and projects. Users adapt this
1
method to analyse consumer and clients feedback and reviews subject to business plans and
proposals. Information and data are collected by distributing questionnaire to peoples and public.
Public opinion pools: this helps to evaluate the perspective and mid set of various group
of people and sections. Not all the essential aspects are analysed with in this method only
common facts are asked to the group. A pooling method is used to get and consolidate the
responses in single format (Sethi and Zhang, 2012).
Secondary data: Figures and data are collected with the help of supporting material and
aspects. Only those aspects are considered which have already analysed and researched. This
method is very cost effective and time saving in organisational context. Secondary data reduce
the time and work load of users subject to analyse the perspective and mind set of customers.
1.2 Survey methodology and sampling frame
Survey methodology is a process which is a part of research. This is used when an
organisational wants to evaluate external aspects and facts like business expansion plans, future
investment and management decisions (Cosgrove and Rijsberman, 2014). Food and Friends has a
business expansion plan which is need to analysed with survey methodology. Major elements
which are considered in survey methodology are defined as follows:
Sampling Framing: this helps to collect information by collecting reviews and
feedbacks from group of people and consumer sections. A particular section of group of people
are taken as one sample to analyse data and information. Positive response and aspects are
considered in this sampling framing.
Random Sampling: This sampling method helps to analyse the context. This is one of
the essential element which helps to consolidate customer reviews aspects subject to business
plans. Groups are selected subjected to determine key functional issues of tools which are
considered important in organisational context. Different sampling methods and techniques such
as quota, stratified and cluster are used in random sampling.
Quantitative and qualitative: these measurement tools are used to analyse and evaluate
critical issues and conflicts which remain associated with business plans and objectives. It is
important for organisations to analyse information in qualitative and quantitative format (Saaty
and Peniwati, 2013).
2
Secure Best Marks with AI Grader
Need help grading? Try our AI Grader for instant feedback on your assignments.
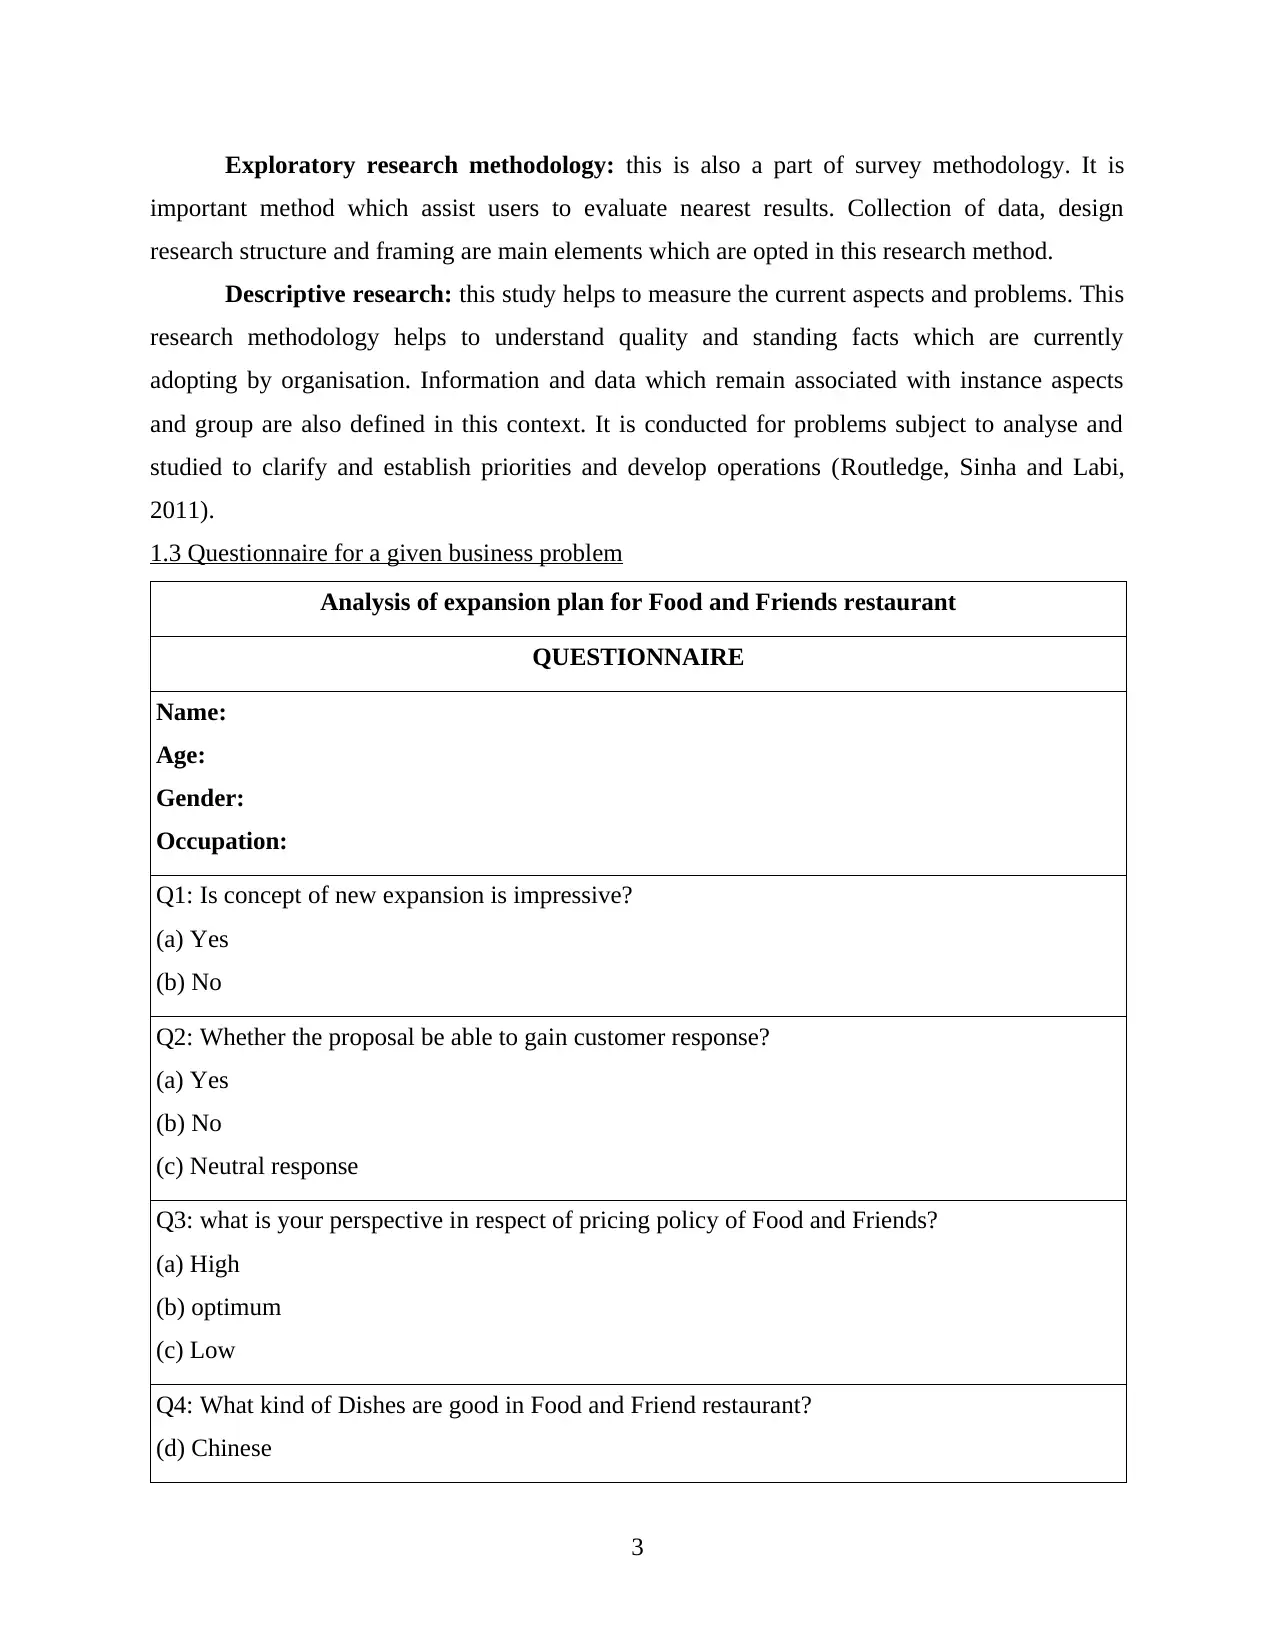
Exploratory research methodology: this is also a part of survey methodology. It is
important method which assist users to evaluate nearest results. Collection of data, design
research structure and framing are main elements which are opted in this research method.
Descriptive research: this study helps to measure the current aspects and problems. This
research methodology helps to understand quality and standing facts which are currently
adopting by organisation. Information and data which remain associated with instance aspects
and group are also defined in this context. It is conducted for problems subject to analyse and
studied to clarify and establish priorities and develop operations (Routledge, Sinha and Labi,
2011).
1.3 Questionnaire for a given business problem
Analysis of expansion plan for Food and Friends restaurant
QUESTIONNAIRE
Name:
Age:
Gender:
Occupation:
Q1: Is concept of new expansion is impressive?
(a) Yes
(b) No
Q2: Whether the proposal be able to gain customer response?
(a) Yes
(b) No
(c) Neutral response
Q3: what is your perspective in respect of pricing policy of Food and Friends?
(a) High
(b) optimum
(c) Low
Q4: What kind of Dishes are good in Food and Friend restaurant?
(d) Chinese
3
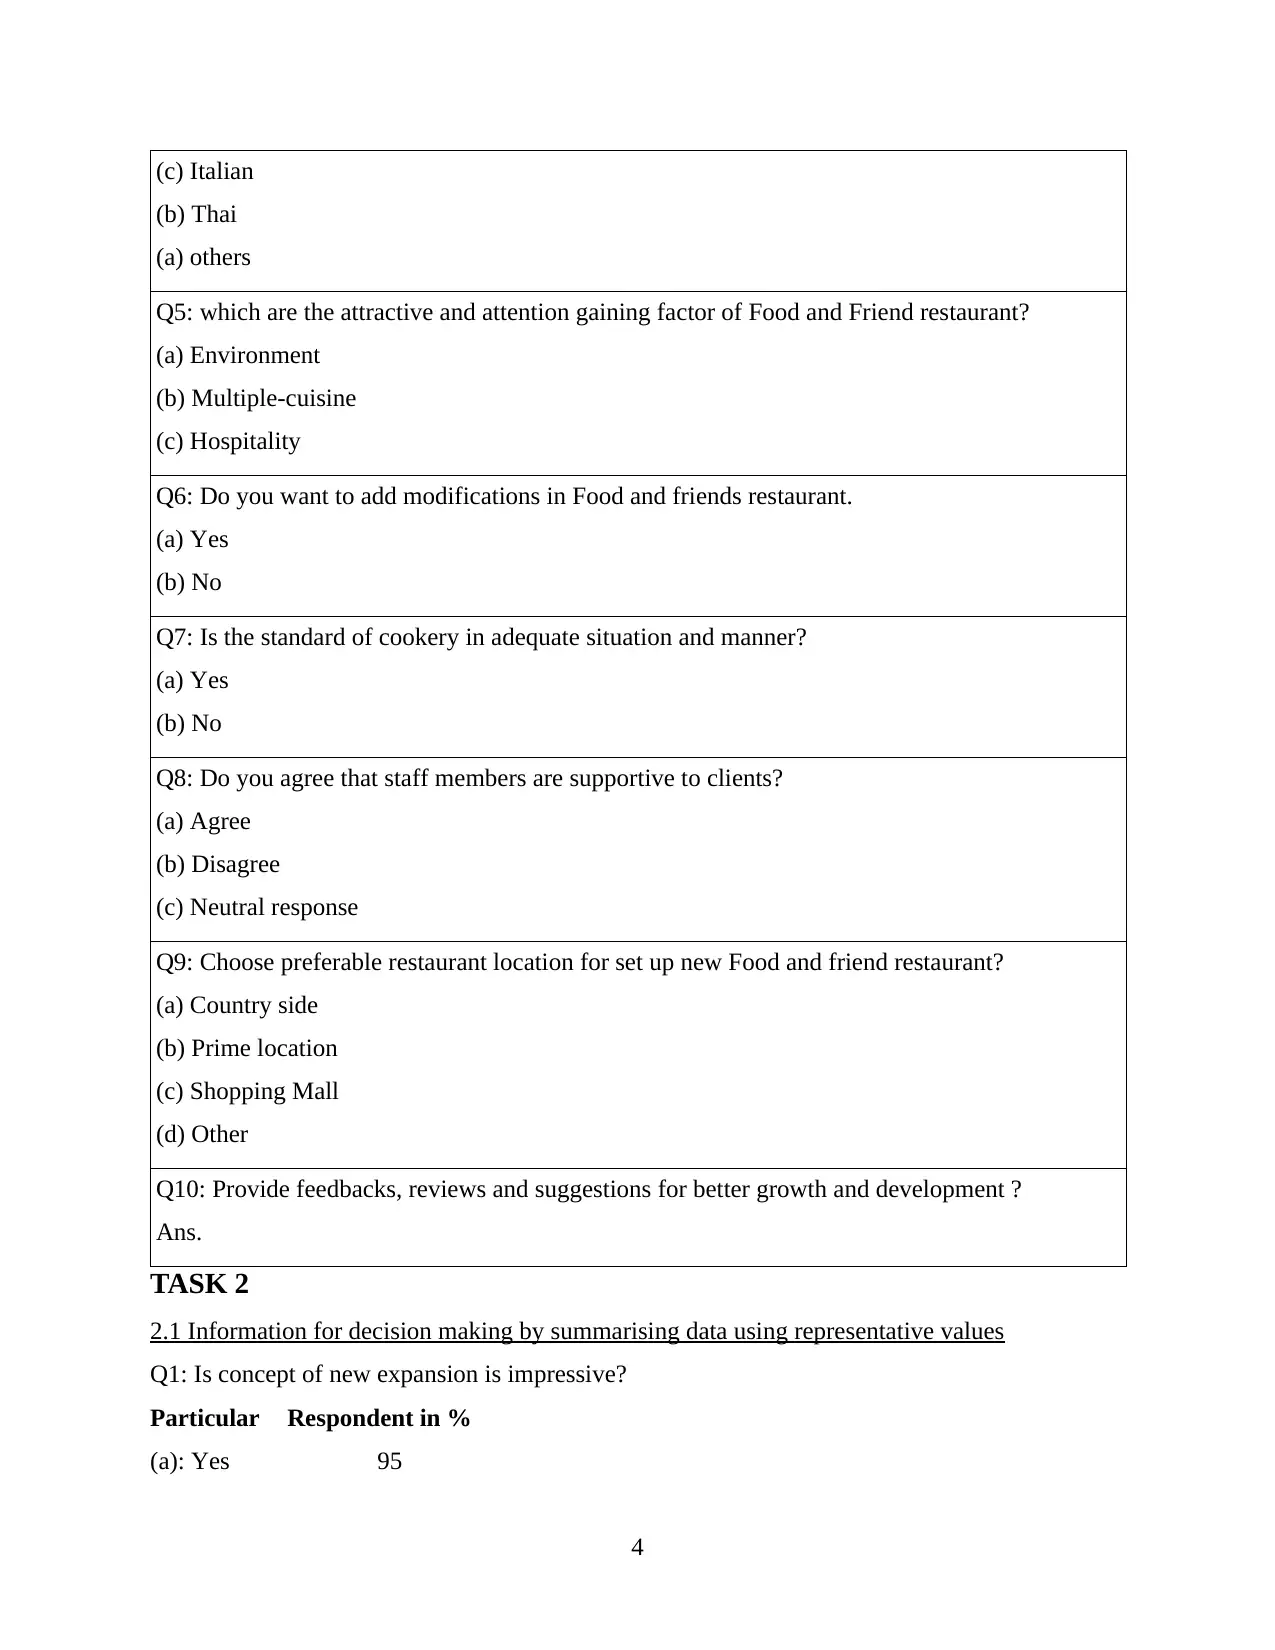
(c) Italian
(b) Thai
(a) others
Q5: which are the attractive and attention gaining factor of Food and Friend restaurant?
(a) Environment
(b) Multiple-cuisine
(c) Hospitality
Q6: Do you want to add modifications in Food and friends restaurant.
(a) Yes
(b) No
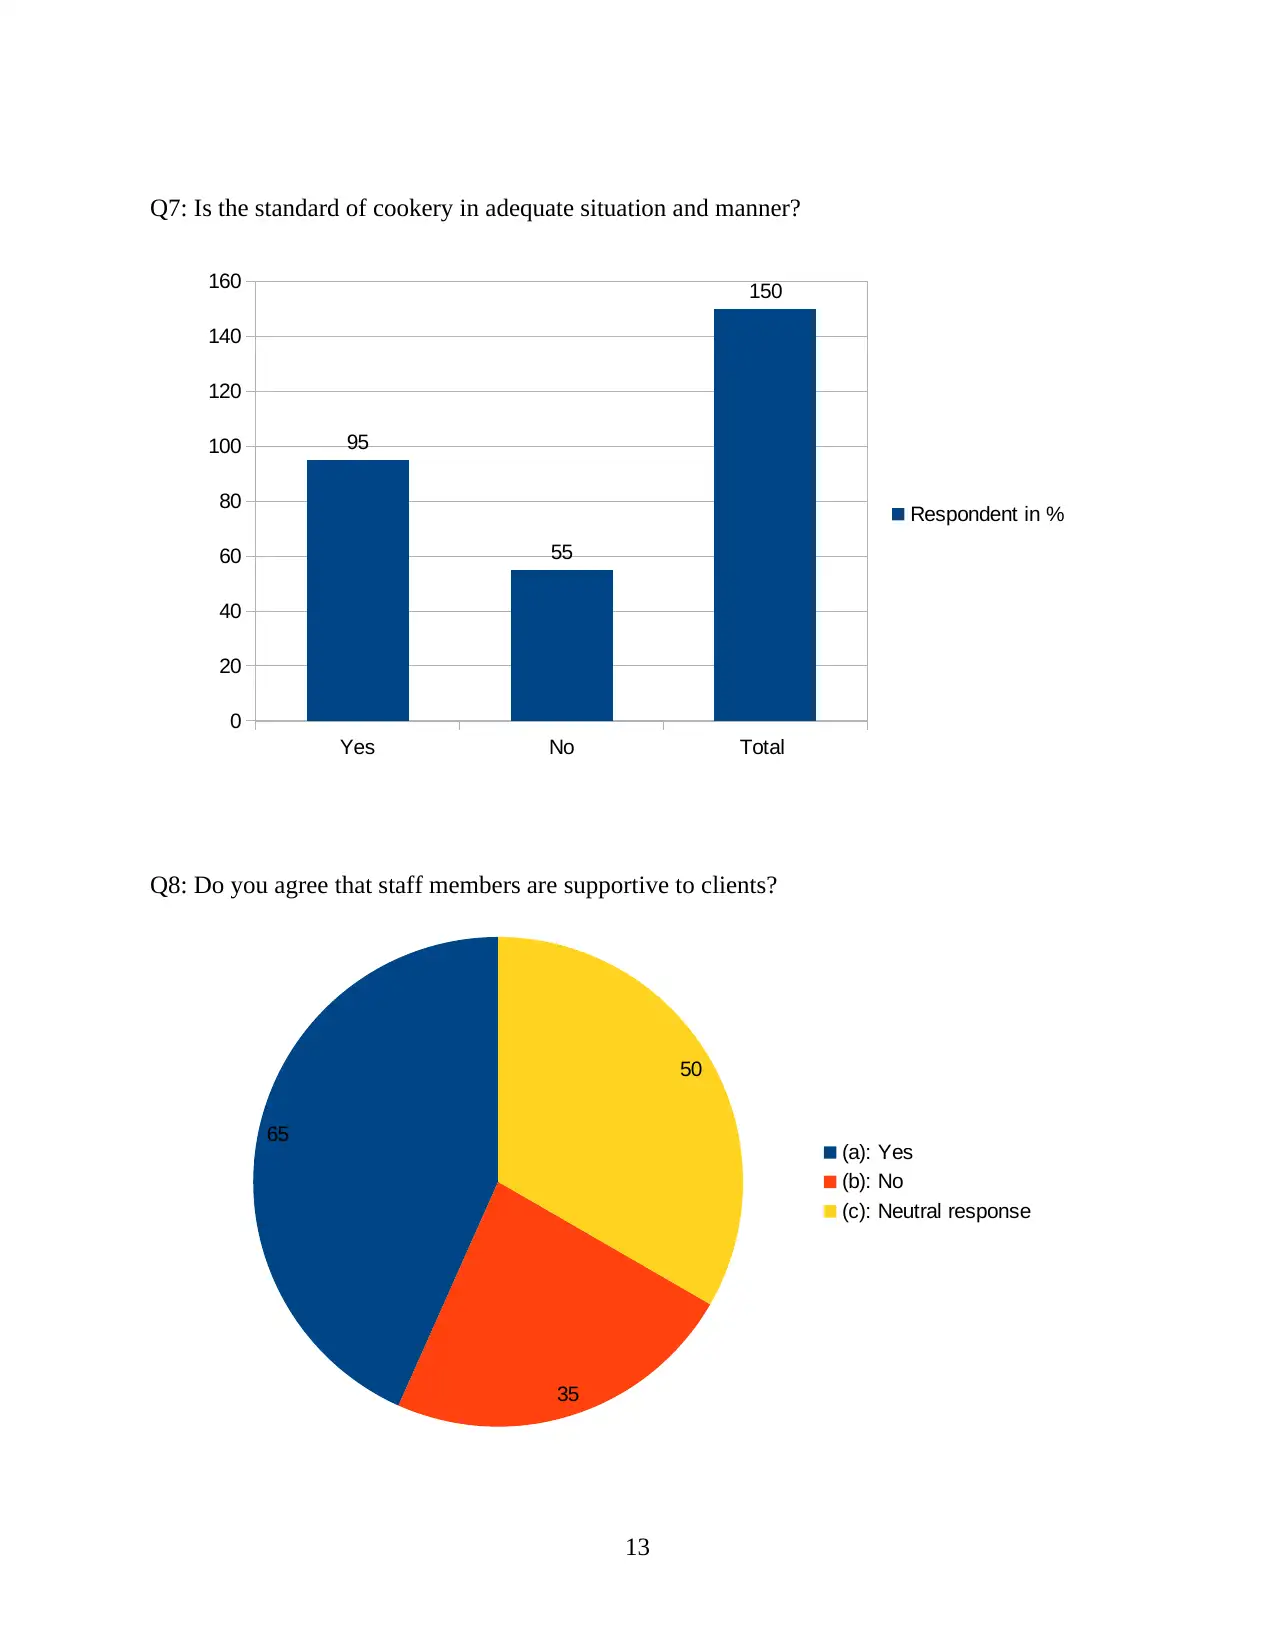
Q7: Is the standard of cookery in adequate situation and manner?
(a) Yes
(b) No
Q8: Do you agree that staff members are supportive to clients?
(a) Agree
(b) Disagree
(c) Neutral response
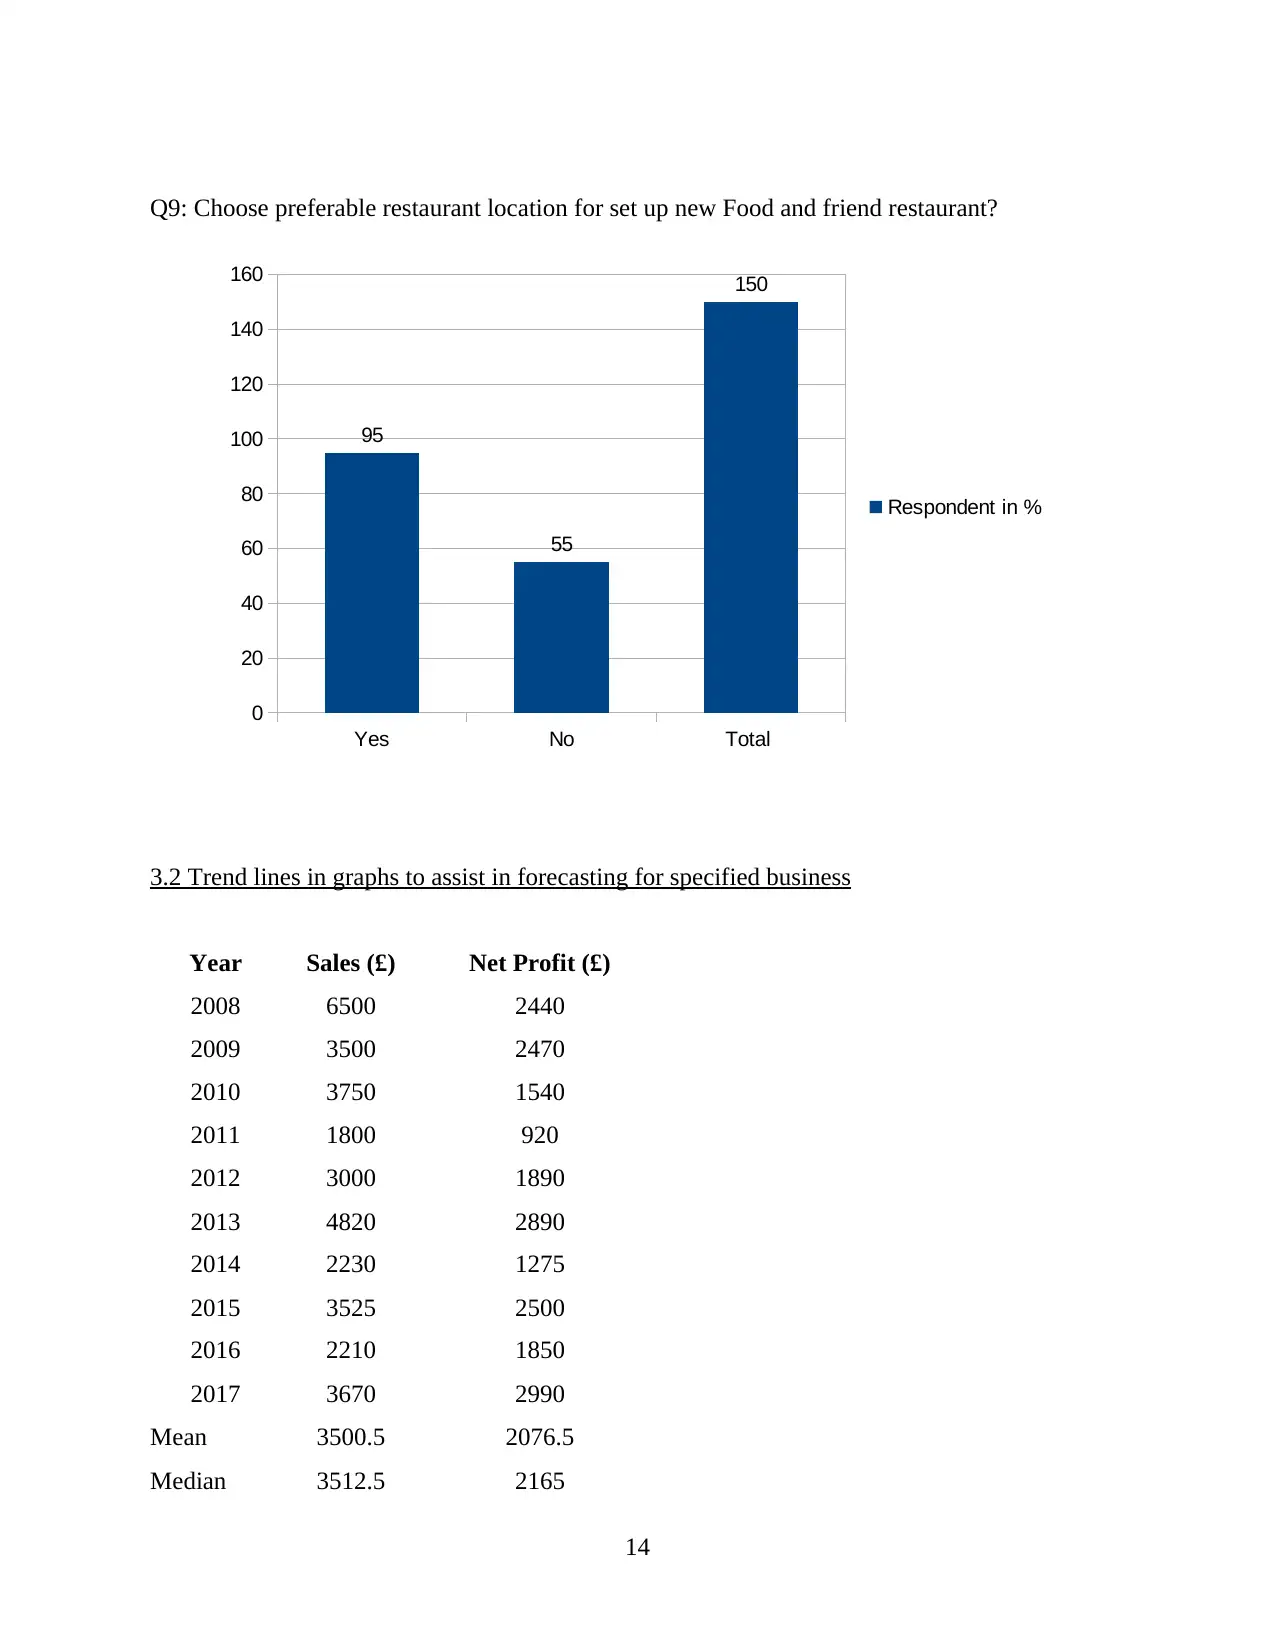
Q9: Choose preferable restaurant location for set up new Food and friend restaurant?
(a) Country side
(b) Prime location
(c) Shopping Mall
(d) Other
Q10: Provide feedbacks, reviews and suggestions for better growth and development ?
Ans.
TASK 2
2.1 Information for decision making by summarising data using representative values
Q1: Is concept of new expansion is impressive?
Particular Respondent in %
(a): Yes 95
4
(b) Thai
(a) others
Q5: which are the attractive and attention gaining factor of Food and Friend restaurant?
(a) Environment
(b) Multiple-cuisine
(c) Hospitality
Q6: Do you want to add modifications in Food and friends restaurant.
(a) Yes
(b) No
Q7: Is the standard of cookery in adequate situation and manner?
(a) Yes
(b) No
Q8: Do you agree that staff members are supportive to clients?
(a) Agree
(b) Disagree
(c) Neutral response
Q9: Choose preferable restaurant location for set up new Food and friend restaurant?
(a) Country side
(b) Prime location
(c) Shopping Mall
(d) Other
Q10: Provide feedbacks, reviews and suggestions for better growth and development ?
Ans.
TASK 2
2.1 Information for decision making by summarising data using representative values
Q1: Is concept of new expansion is impressive?
Particular Respondent in %
(a): Yes 95
4
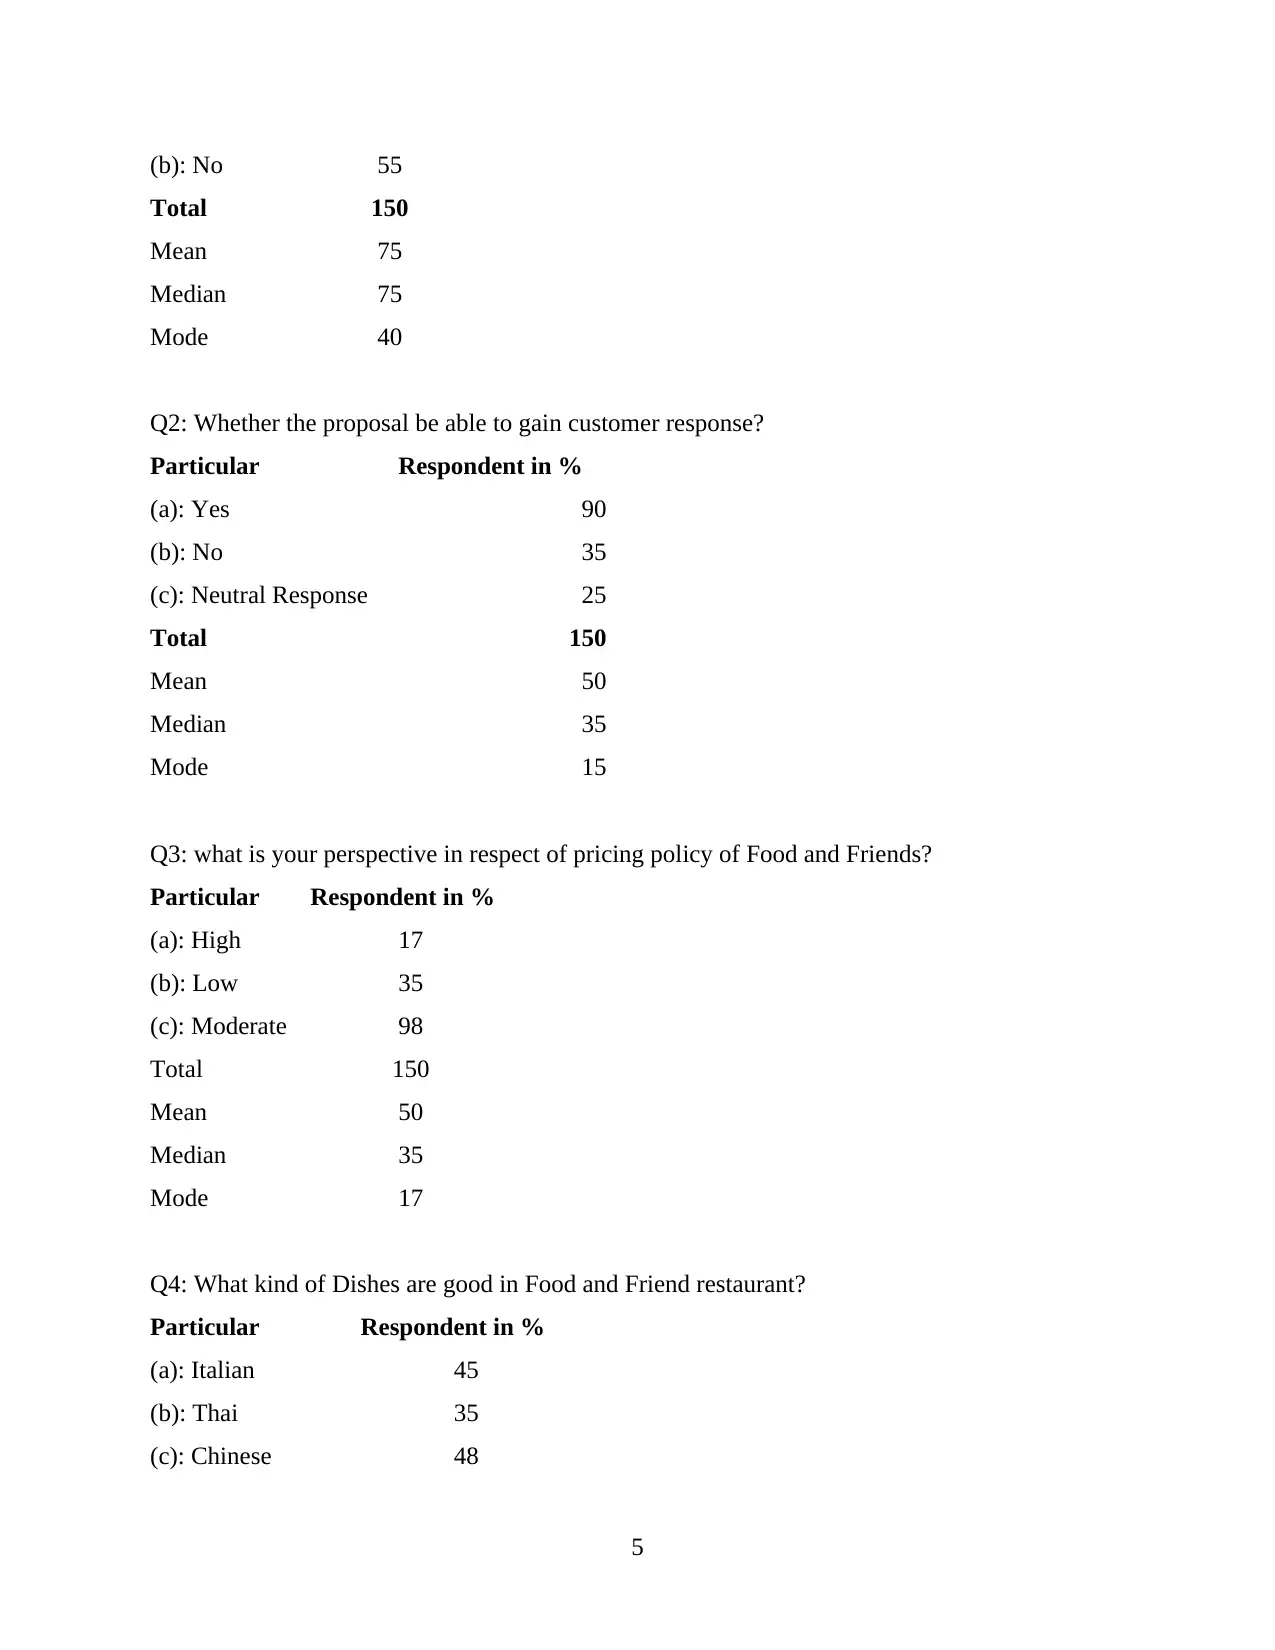
(b): No 55
Total 150
Mean 75
Median 75
Mode 40
Q2: Whether the proposal be able to gain customer response?
Particular Respondent in %
(a): Yes 90
(b): No 35
(c): Neutral Response 25
Total 150
Mean 50
Median 35
Mode 15
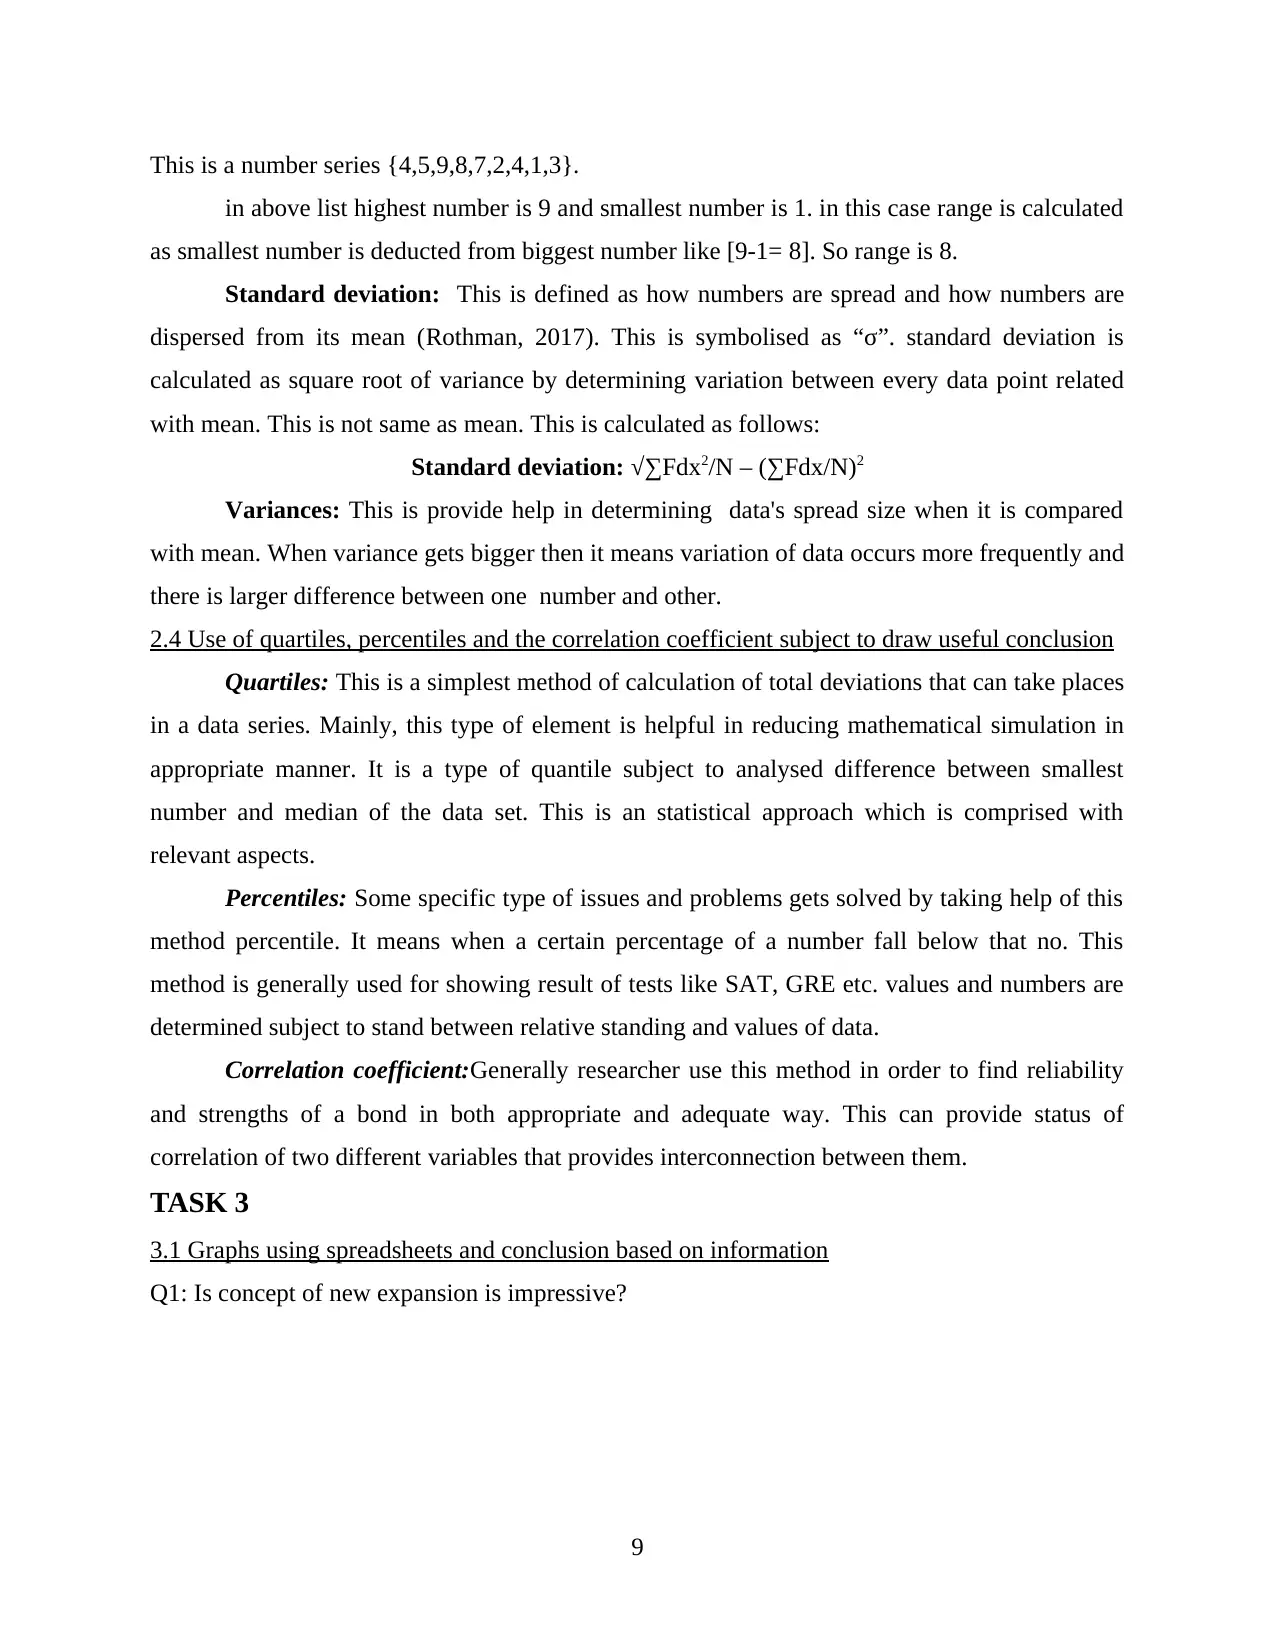
Q3: what is your perspective in respect of pricing policy of Food and Friends?
Particular Respondent in %
(a): High 17
(b): Low 35
(c): Moderate 98
Total 150
Mean 50
Median 35
Mode 17
Q4: What kind of Dishes are good in Food and Friend restaurant?
Particular Respondent in %
(a): Italian 45
(b): Thai 35
(c): Chinese 48
5
Total 150
Mean 75
Median 75
Mode 40
Q2: Whether the proposal be able to gain customer response?
Particular Respondent in %
(a): Yes 90
(b): No 35
(c): Neutral Response 25
Total 150
Mean 50
Median 35
Mode 15
Q3: what is your perspective in respect of pricing policy of Food and Friends?
Particular Respondent in %
(a): High 17
(b): Low 35
(c): Moderate 98
Total 150
Mean 50
Median 35
Mode 17
Q4: What kind of Dishes are good in Food and Friend restaurant?
Particular Respondent in %
(a): Italian 45
(b): Thai 35
(c): Chinese 48
5
Paraphrase This Document
Need a fresh take? Get an instant paraphrase of this document with our AI Paraphraser
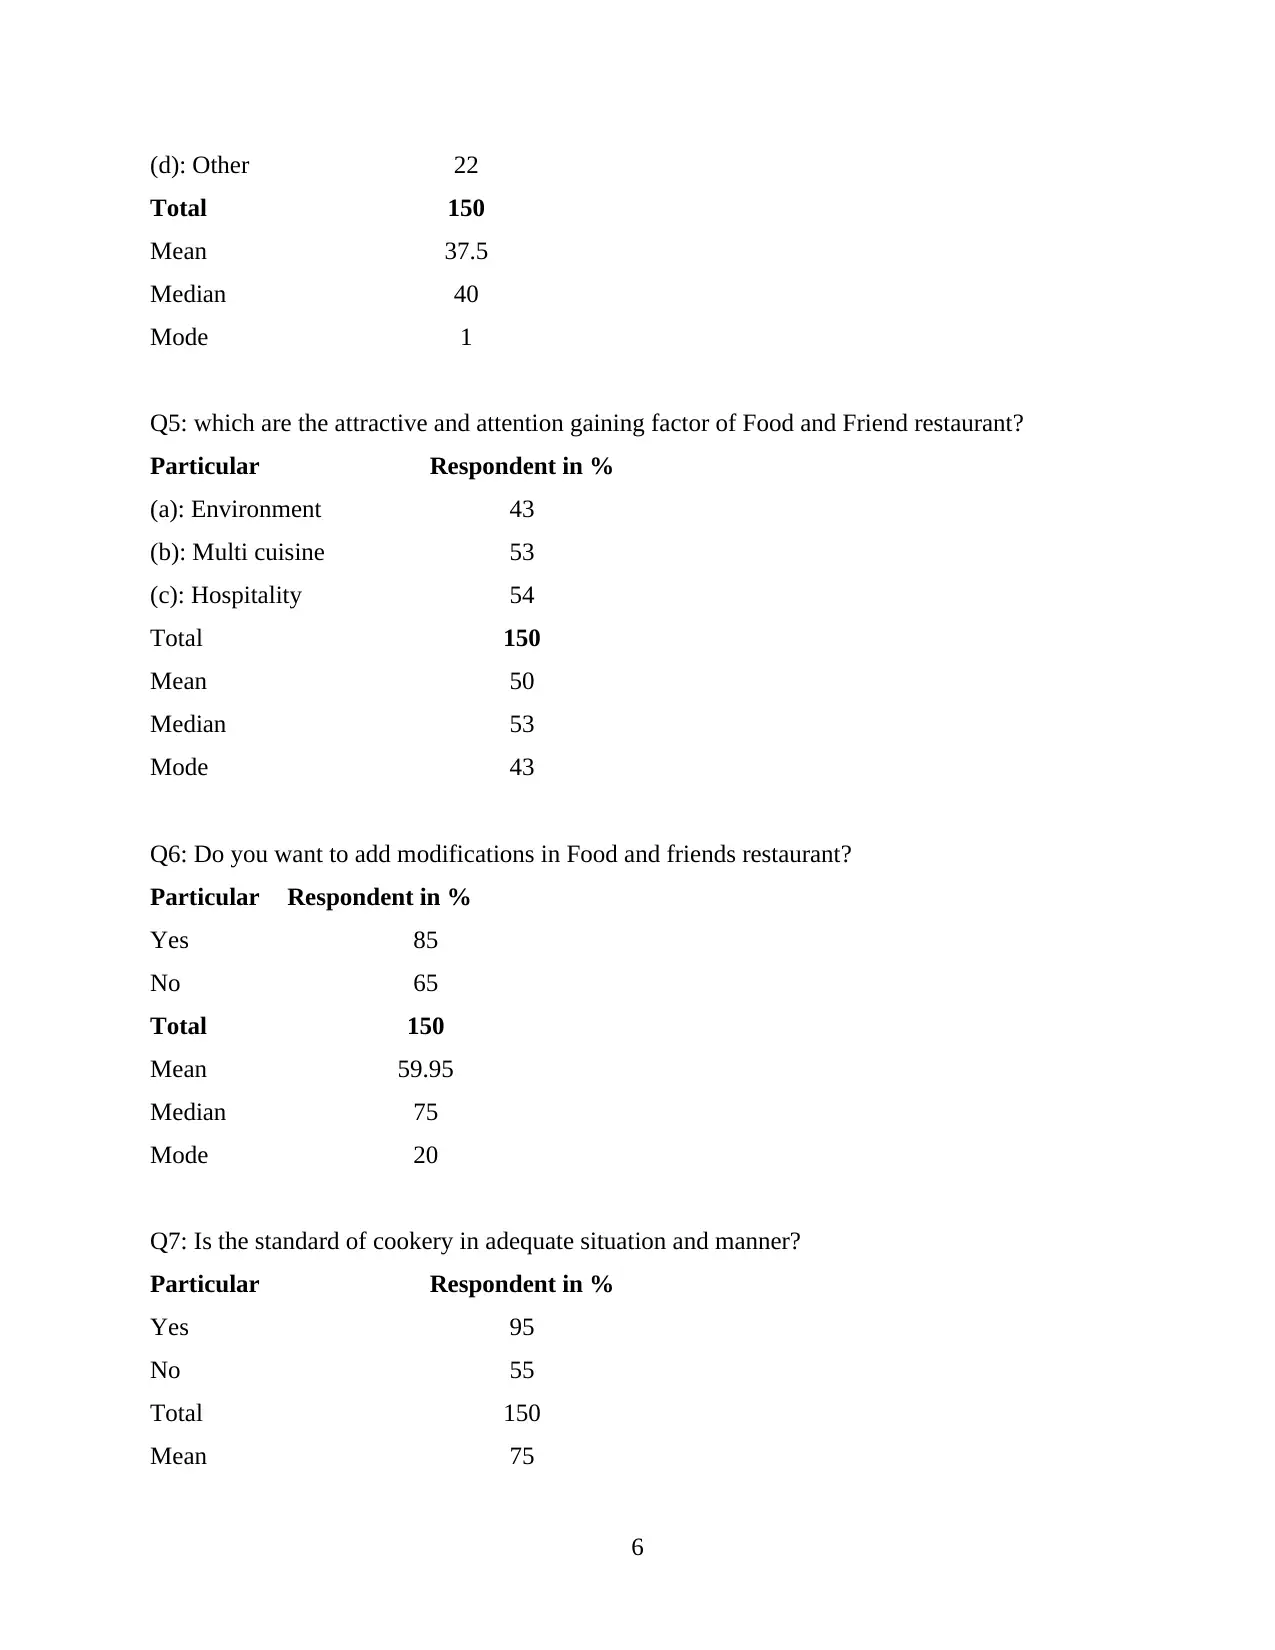
(d): Other 22
Total 150
Mean 37.5
Median 40
Mode 1
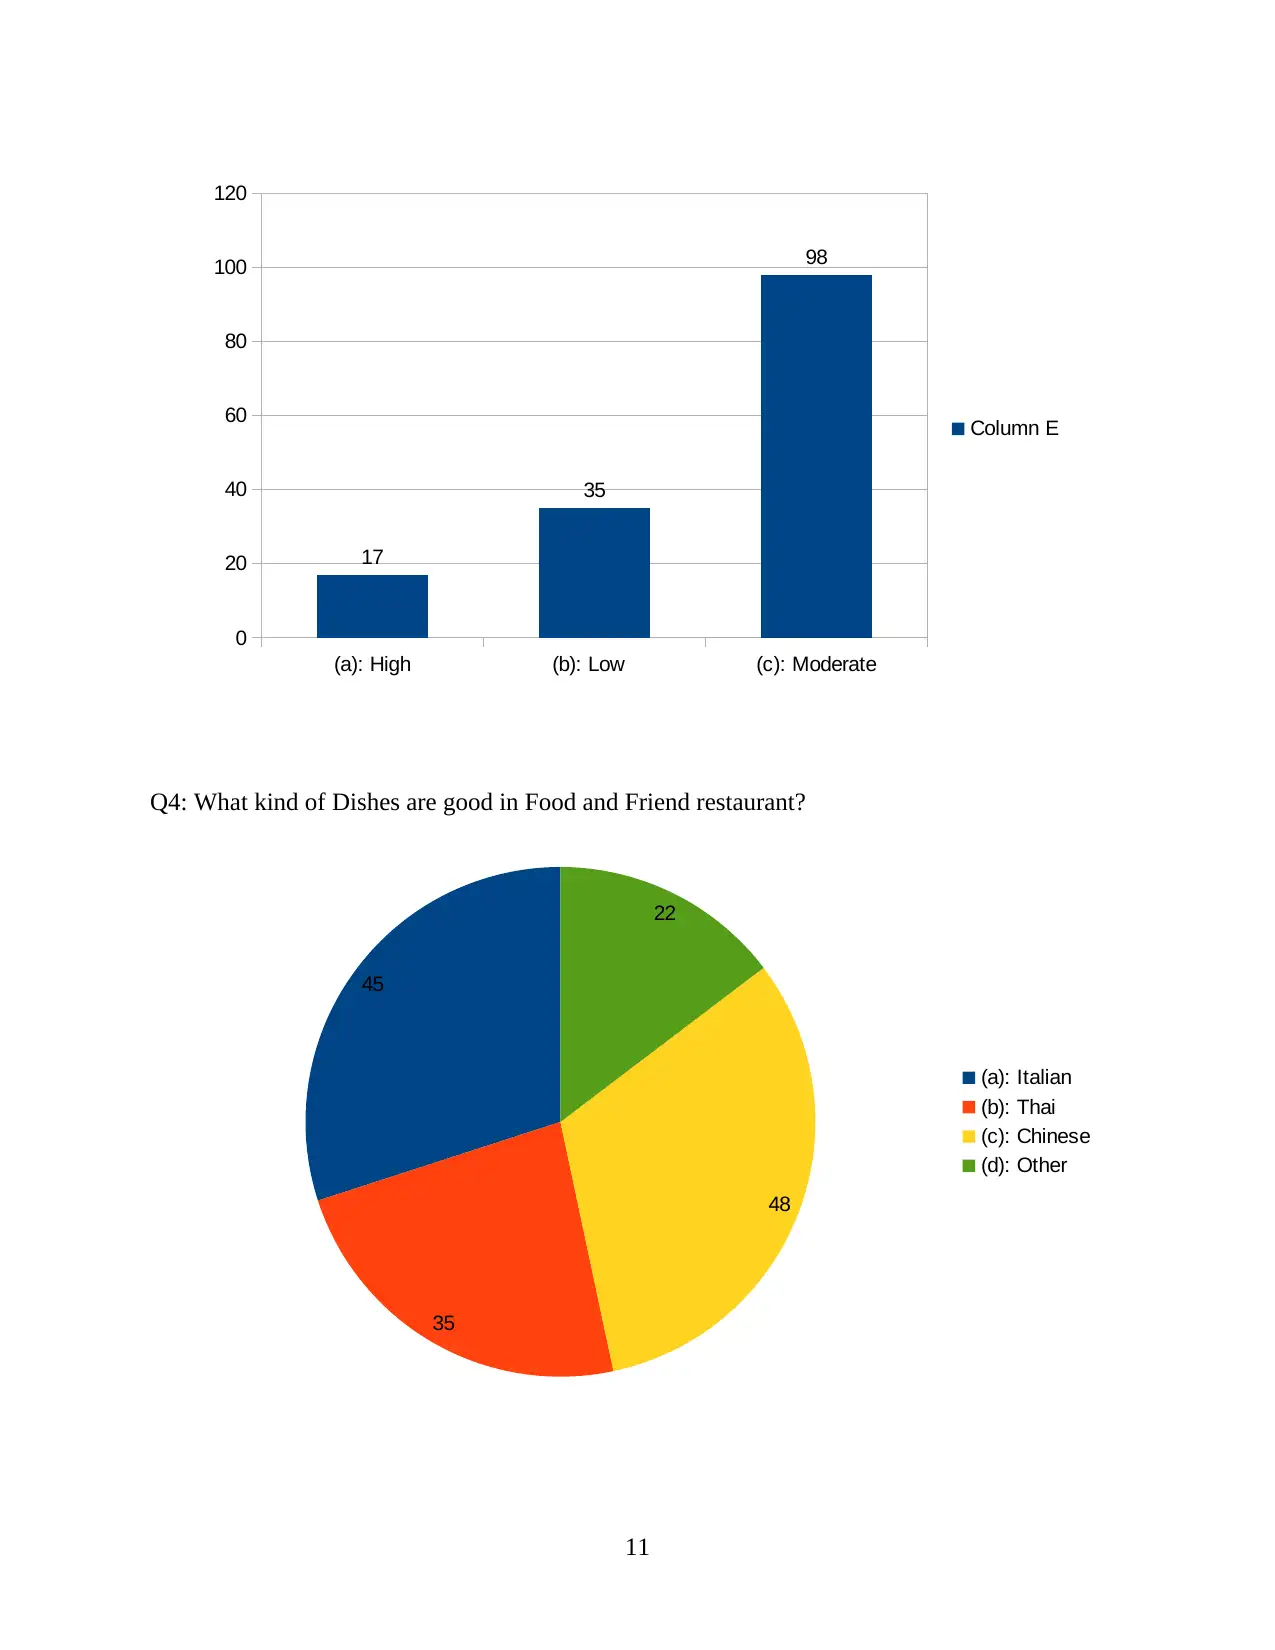
Q5: which are the attractive and attention gaining factor of Food and Friend restaurant?
Particular Respondent in %
(a): Environment 43
(b): Multi cuisine 53
(c): Hospitality 54
Total 150
Mean 50
Median 53
Mode 43
Q6: Do you want to add modifications in Food and friends restaurant?
Particular Respondent in %
Yes 85
No 65
Total 150
Mean 59.95
Median 75
Mode 20
Q7: Is the standard of cookery in adequate situation and manner?
Particular Respondent in %
Yes 95
No 55
Total 150
Mean 75
6
Total 150
Mean 37.5
Median 40
Mode 1
Q5: which are the attractive and attention gaining factor of Food and Friend restaurant?
Particular Respondent in %
(a): Environment 43
(b): Multi cuisine 53
(c): Hospitality 54
Total 150
Mean 50
Median 53
Mode 43
Q6: Do you want to add modifications in Food and friends restaurant?
Particular Respondent in %
Yes 85
No 65
Total 150
Mean 59.95
Median 75
Mode 20
Q7: Is the standard of cookery in adequate situation and manner?
Particular Respondent in %
Yes 95
No 55
Total 150
Mean 75
6
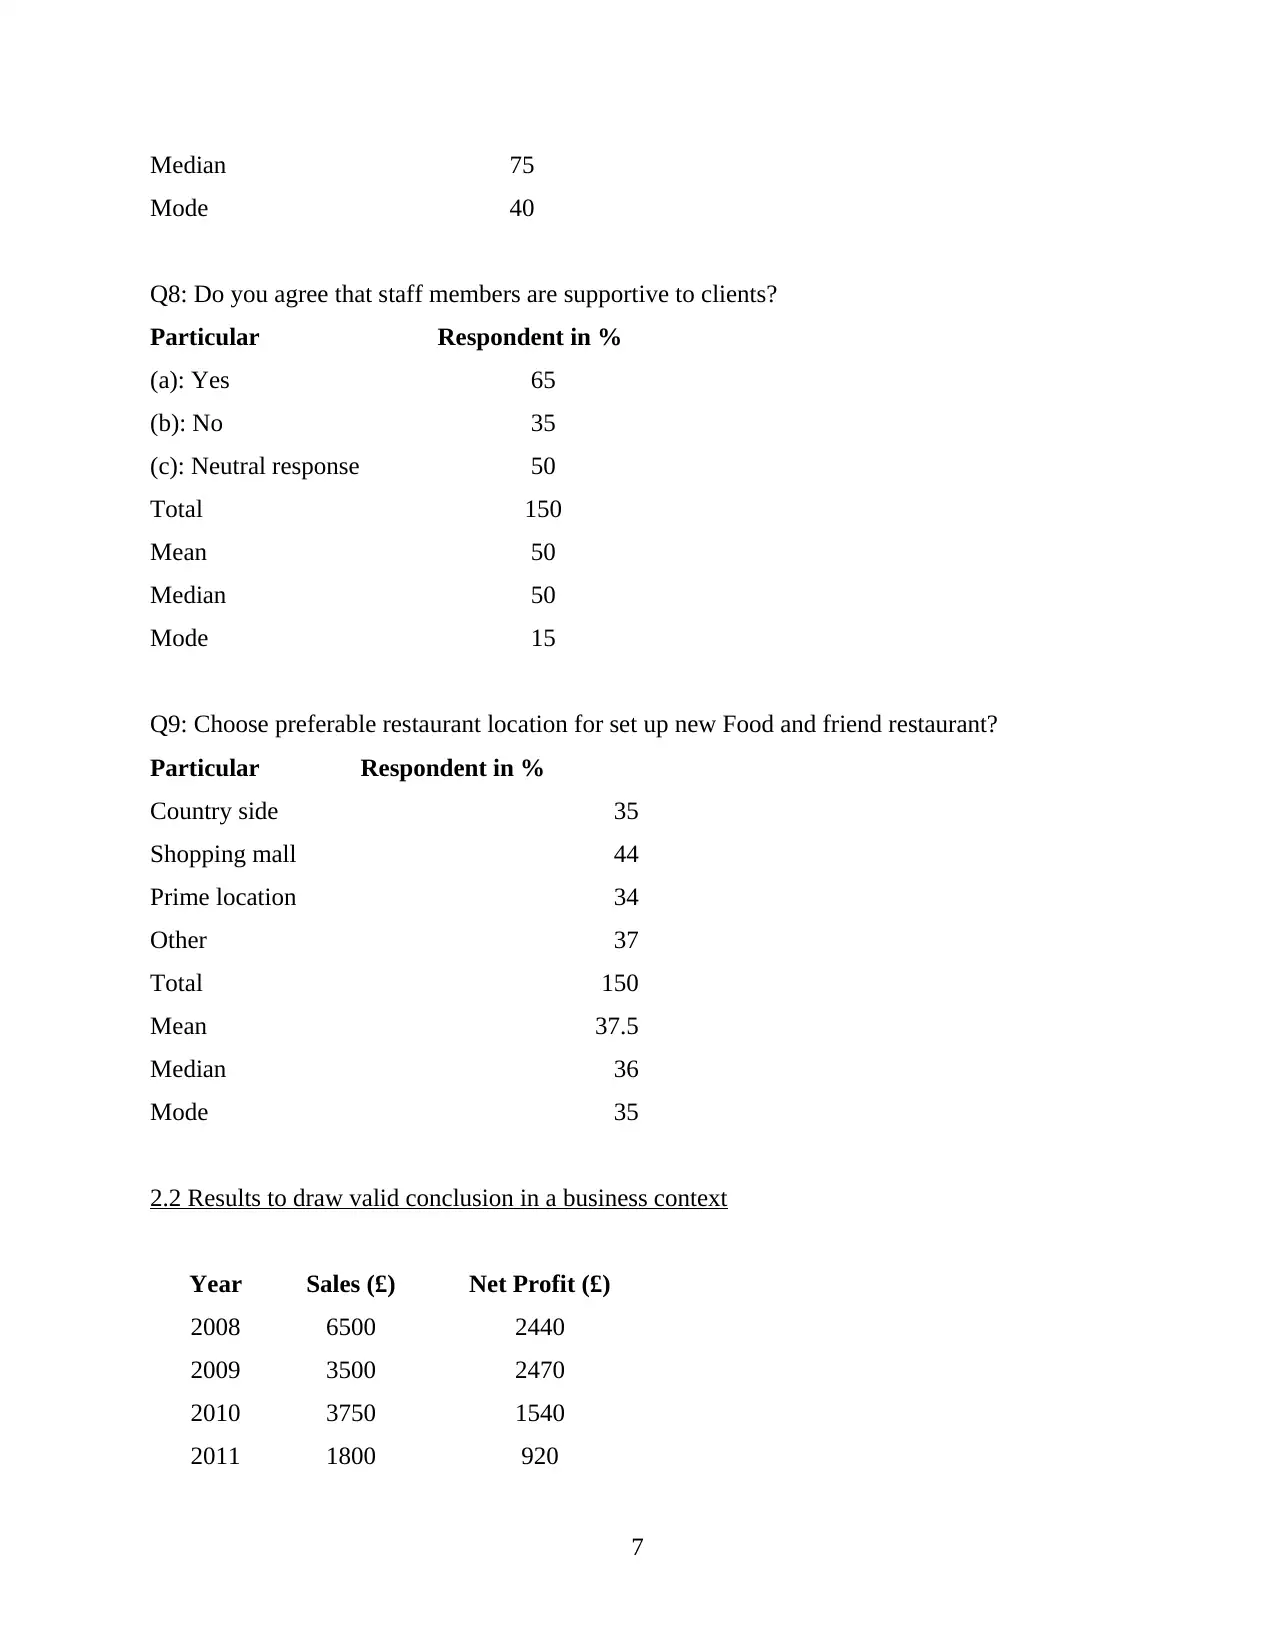
Median 75
Mode 40
Q8: Do you agree that staff members are supportive to clients?
Particular Respondent in %
(a): Yes 65
(b): No 35
(c): Neutral response 50
Total 150
Mean 50
Median 50
Mode 15
Q9: Choose preferable restaurant location for set up new Food and friend restaurant?
Particular Respondent in %
Country side 35
Shopping mall 44
Prime location 34
Other 37
Total 150
Mean 37.5
Median 36
Mode 35
2.2 Results to draw valid conclusion in a business context
Year Sales (£) Net Profit (£)
2008 6500 2440
2009 3500 2470
2010 3750 1540
2011 1800 920
7
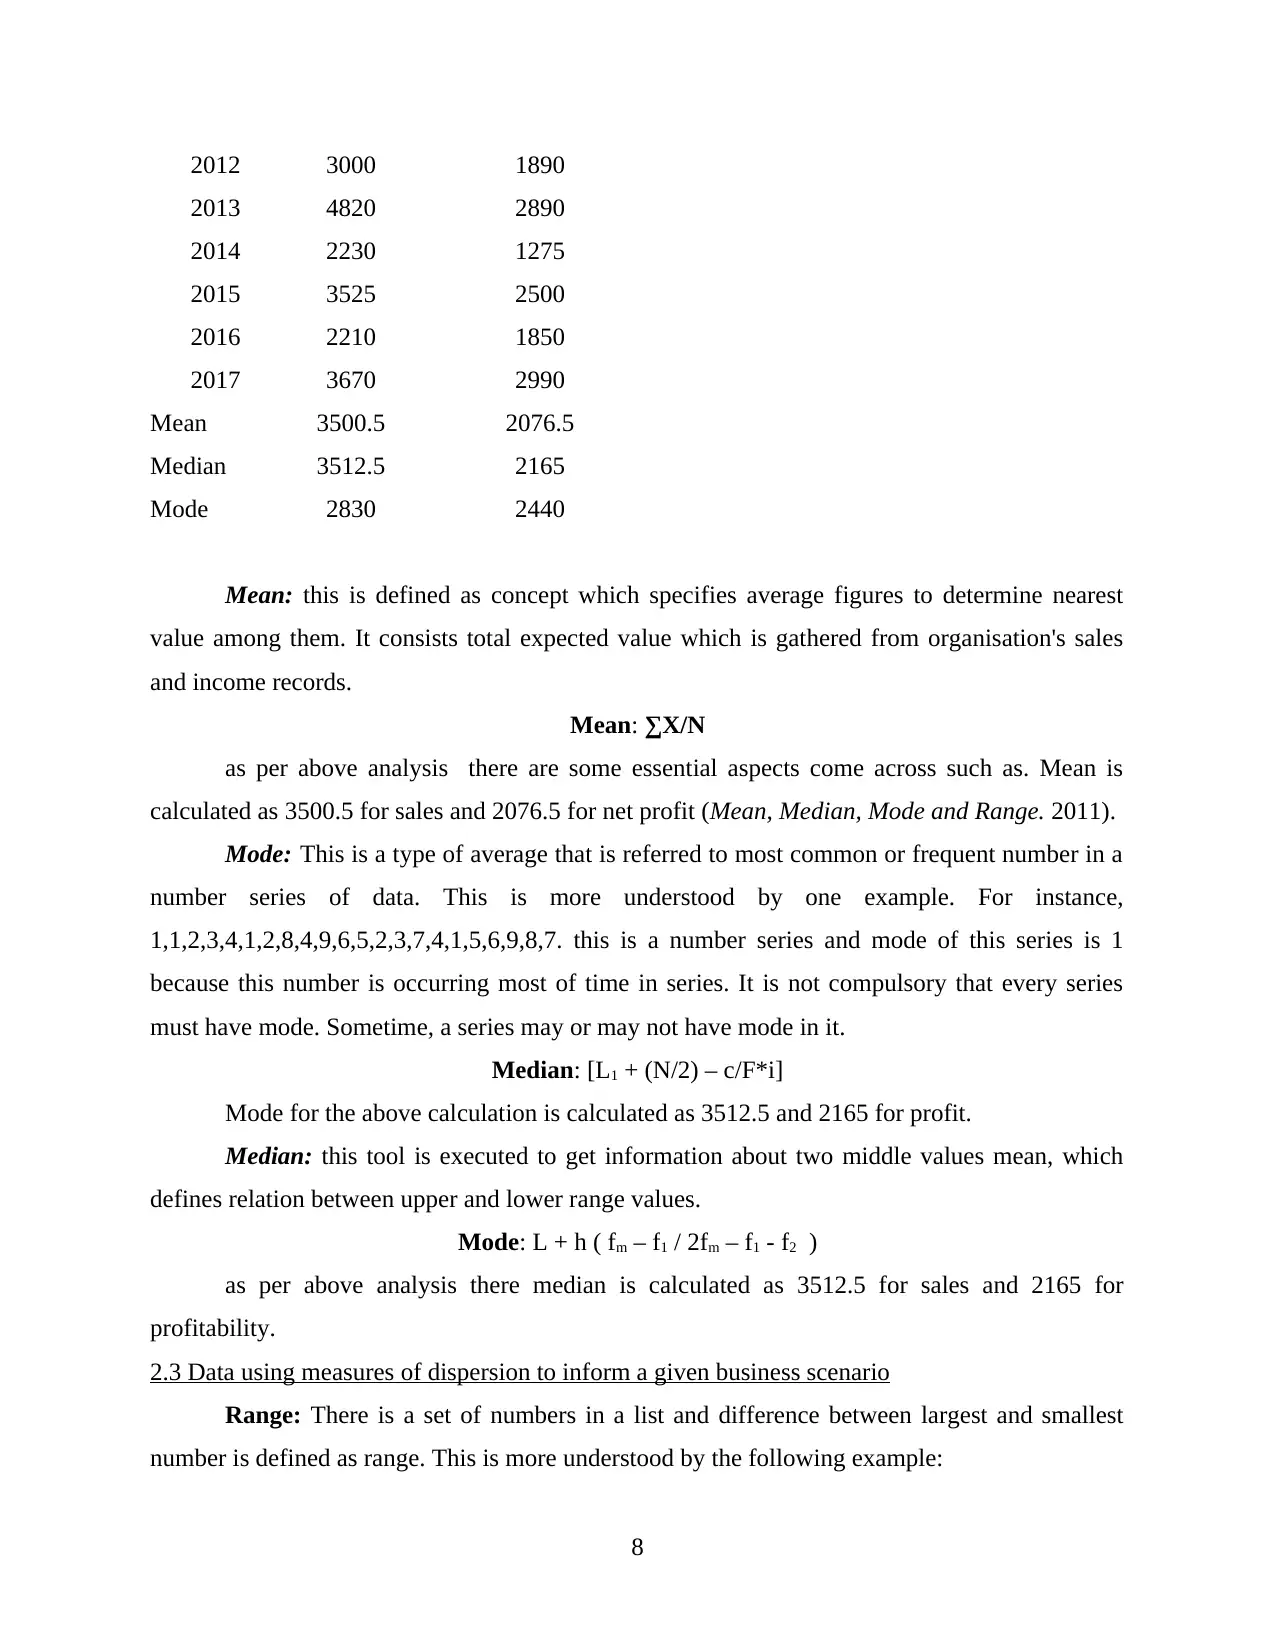
2012 3000 1890
2013 4820 2890
2014 2230 1275
2015 3525 2500
2016 2210 1850
2017 3670 2990
Mean 3500.5 2076.5
Median 3512.5 2165
Mode 2830 2440
Mean: this is defined as concept which specifies average figures to determine nearest
value among them. It consists total expected value which is gathered from organisation's sales
and income records.
Mean: ∑X/N
as per above analysis there are some essential aspects come across such as. Mean is
calculated as 3500.5 for sales and 2076.5 for net profit (Mean, Median, Mode and Range. 2011).
Mode: This is a type of average that is referred to most common or frequent number in a
number series of data. This is more understood by one example. For instance,
1,1,2,3,4,1,2,8,4,9,6,5,2,3,7,4,1,5,6,9,8,7. this is a number series and mode of this series is 1
because this number is occurring most of time in series. It is not compulsory that every series
must have mode. Sometime, a series may or may not have mode in it.
Median: [L1 + (N/2) – c/F*i]
Mode for the above calculation is calculated as 3512.5 and 2165 for profit.
Median: this tool is executed to get information about two middle values mean, which
defines relation between upper and lower range values.
Mode: L + h ( fm – f1 / 2fm – f1 - f2 )
as per above analysis there median is calculated as 3512.5 for sales and 2165 for
profitability.
2.3 Data using measures of dispersion to inform a given business scenario
Range: There is a set of numbers in a list and difference between largest and smallest
number is defined as range. This is more understood by the following example:
8
Secure Best Marks with AI Grader
Need help grading? Try our AI Grader for instant feedback on your assignments.
This is a number series {4,5,9,8,7,2,4,1,3}.
in above list highest number is 9 and smallest number is 1. in this case range is calculated
as smallest number is deducted from biggest number like [9-1= 8]. So range is 8.
Standard deviation: This is defined as how numbers are spread and how numbers are
dispersed from its mean (Rothman, 2017). This is symbolised as “σ”. standard deviation is
calculated as square root of variance by determining variation between every data point related
with mean. This is not same as mean. This is calculated as follows:
Standard deviation: √∑Fdx2/N – (∑Fdx/N)2
Variances: This is provide help in determining data's spread size when it is compared
with mean. When variance gets bigger then it means variation of data occurs more frequently and
there is larger difference between one number and other.
2.4 Use of quartiles, percentiles and the correlation coefficient subject to draw useful conclusion
Quartiles: This is a simplest method of calculation of total deviations that can take places
in a data series. Mainly, this type of element is helpful in reducing mathematical simulation in
appropriate manner. It is a type of quantile subject to analysed difference between smallest
number and median of the data set. This is an statistical approach which is comprised with
relevant aspects.
Percentiles: Some specific type of issues and problems gets solved by taking help of this
method percentile. It means when a certain percentage of a number fall below that no. This
method is generally used for showing result of tests like SAT, GRE etc. values and numbers are
determined subject to stand between relative standing and values of data.
Correlation coefficient:Generally researcher use this method in order to find reliability
and strengths of a bond in both appropriate and adequate way. This can provide status of
correlation of two different variables that provides interconnection between them.
TASK 3
3.1 Graphs using spreadsheets and conclusion based on information
Q1: Is concept of new expansion is impressive?
9

Q2: Whether the proposal be able to gain customer response?
Q3: what is your perspective in respect of pricing policy of Food and Friends?
10
(a): Yes (b): No
0
10
20
30
40
50
60
70
80
90
100 95
55
Column C
90
35
25
(a): Yes
(b): No
(c): Neutral Response
Q3: what is your perspective in respect of pricing policy of Food and Friends?
10
(a): Yes (b): No
0
10
20
30
40
50
60
70
80
90
100 95
55
Column C
90
35
25
(a): Yes
(b): No
(c): Neutral Response
Q4: What kind of Dishes are good in Food and Friend restaurant?
11
(a): High (b): Low (c): Moderate
0
20
40
60
80
100
120
17
35
98
Column E
45
35
48
22
(a): Italian
(b): Thai
(c): Chinese
(d): Other
11
(a): High (b): Low (c): Moderate
0
20
40
60
80
100
120
17
35
98
Column E
45
35
48
22
(a): Italian
(b): Thai
(c): Chinese
(d): Other
Paraphrase This Document
Need a fresh take? Get an instant paraphrase of this document with our AI Paraphraser
Q5: which are the attractive and attention gaining factor of Food and Friend restaurant?
Q6: Do you want to add modifications in Food and friends restaurant?
12
(a): Environment (b): Multi cuisine (c): Hospitality
0
10
20
30
40
50
60
43
53 54
Respondent in %
85
65
150
Yes
No
Total
Q6: Do you want to add modifications in Food and friends restaurant?
12
(a): Environment (b): Multi cuisine (c): Hospitality
0
10
20
30
40
50
60
43
53 54
Respondent in %
85
65
150
Yes
No
Total
Q7: Is the standard of cookery in adequate situation and manner?
Q8: Do you agree that staff members are supportive to clients?
13
Yes No Total
0
20
40
60
80
100
120
140
160
95
55
150
Respondent in %
65
35
50
(a): Yes
(b): No
(c): Neutral response
Q8: Do you agree that staff members are supportive to clients?
13
Yes No Total
0
20
40
60
80
100
120
140
160
95
55
150
Respondent in %
65
35
50
(a): Yes
(b): No
(c): Neutral response
Q9: Choose preferable restaurant location for set up new Food and friend restaurant?
3.2 Trend lines in graphs to assist in forecasting for specified business
Year Sales (£) Net Profit (£)
2008 6500 2440
2009 3500 2470
2010 3750 1540
2011 1800 920
2012 3000 1890
2013 4820 2890
2014 2230 1275
2015 3525 2500
2016 2210 1850
2017 3670 2990
Mean 3500.5 2076.5
Median 3512.5 2165
14
Yes No Total
0
20
40
60
80
100
120
140
160
95
55
150
Respondent in %
Secure Best Marks with AI Grader
Need help grading? Try our AI Grader for instant feedback on your assignments.
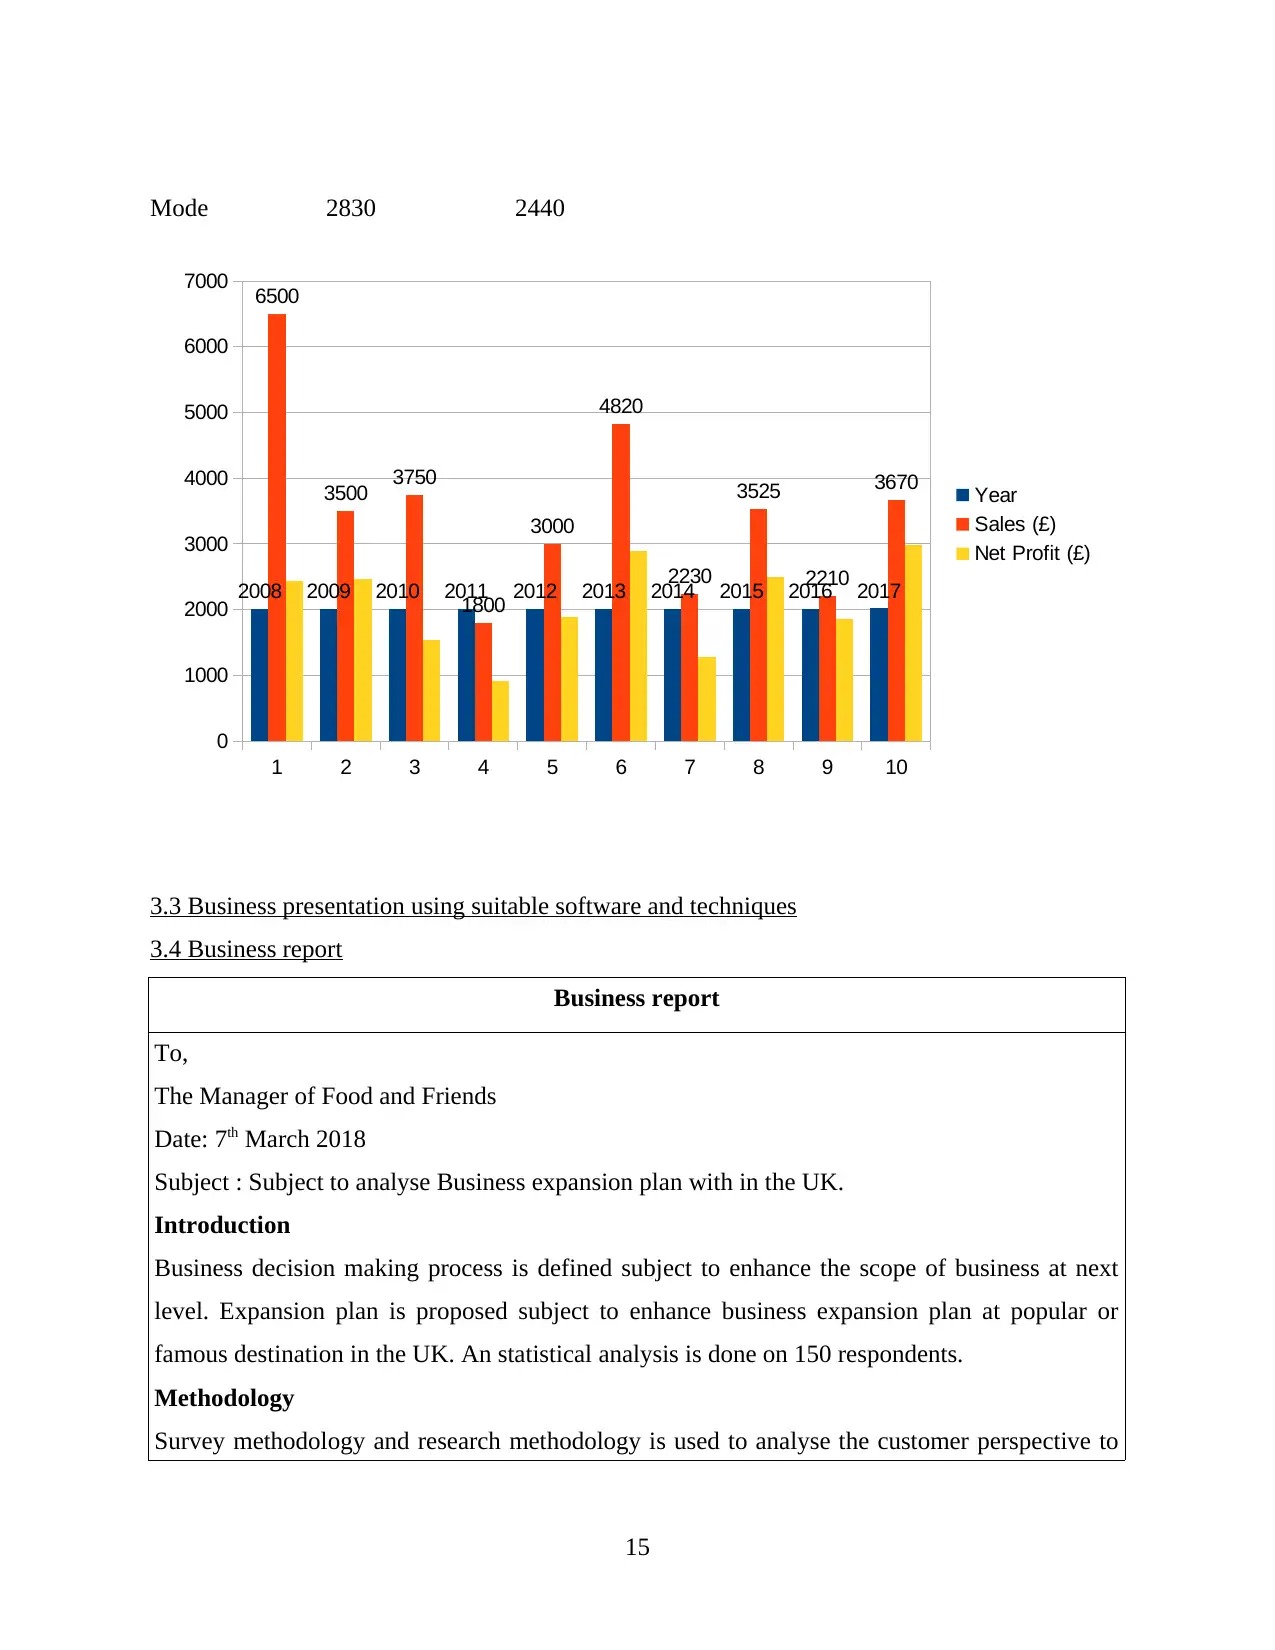
Mode 2830 2440
3.3 Business presentation using suitable software and techniques
3.4 Business report
Business report
To,
The Manager of Food and Friends
Date: 7th March 2018
Subject : Subject to analyse Business expansion plan with in the UK.
Introduction
Business decision making process is defined subject to enhance the scope of business at next
level. Expansion plan is proposed subject to enhance business expansion plan at popular or
famous destination in the UK. An statistical analysis is done on 150 respondents.
Methodology
Survey methodology and research methodology is used to analyse the customer perspective to
15
1 2 3 4 5 6 7 8 9 10
0
1000
2000
3000
4000
5000
6000
7000
2008 2009 2010 2011 2012 2013 2014 2015 2016 2017
6500
3500 3750
1800
3000
4820
2230
3525
2210
3670 Year
Sales (£)
Net Profit (£)
analyse for expansion plan. Some valuable and favourable results come across through survey
methodology.
Findings
it is suggested that organisation should analyse the review and feedbacks received form better
optimisation and effectiveness. Analysis done in respect of environment, food appliances and
structure of organisation. Preferable destinations are defined subject to elaborate and determine
the aspects of best operations.
Recommendation
It is recommended that organisation need to change some internal parts subject to attract more
customer attraction and vision. It is recommended that organisation need to improve product
quality and comprise the prise of products.
Conclusion
Overall results shows positive response and organisation is able to gain consumer and customer
interest. It is expected that Food and Friends will get positive and increased returns.
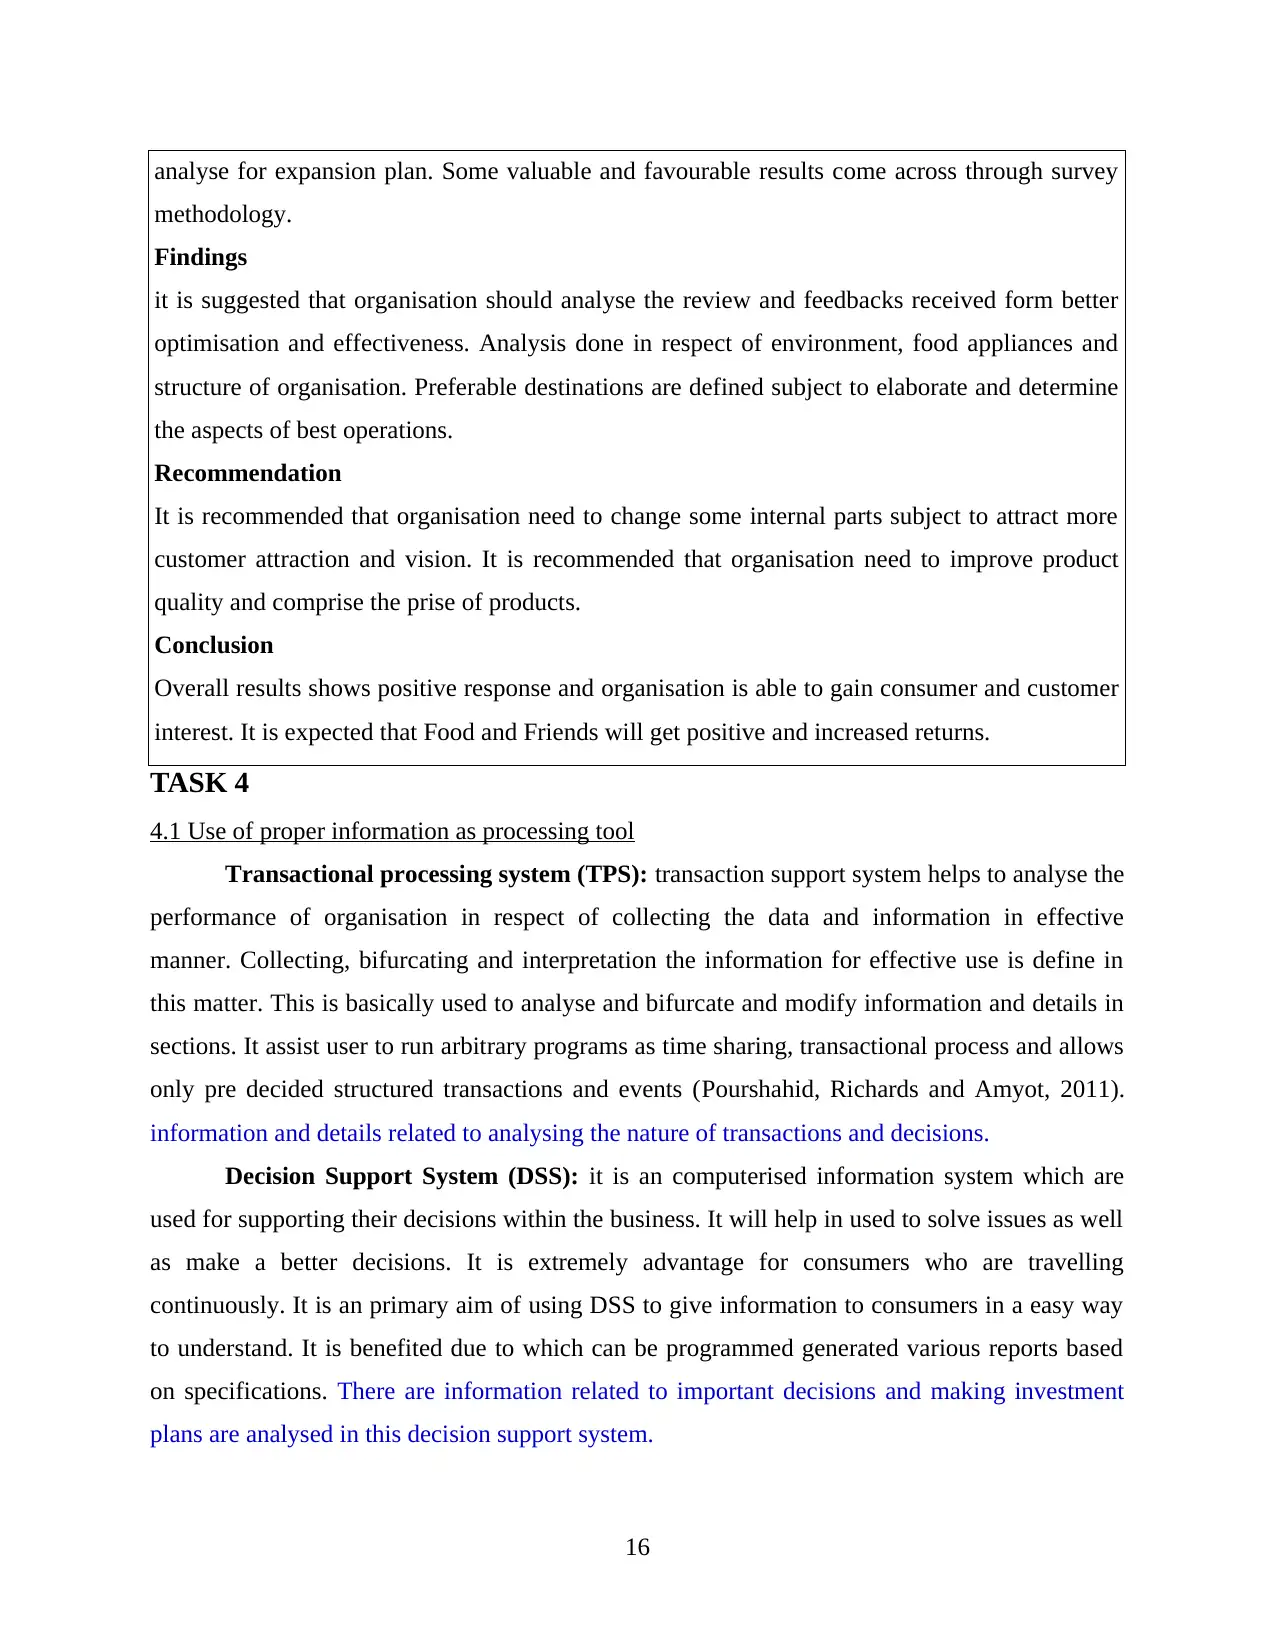
TASK 4
4.1 Use of proper information as processing tool
Transactional processing system (TPS): transaction support system helps to analyse the
performance of organisation in respect of collecting the data and information in effective
manner. Collecting, bifurcating and interpretation the information for effective use is define in
this matter. This is basically used to analyse and bifurcate and modify information and details in
sections. It assist user to run arbitrary programs as time sharing, transactional process and allows
only pre decided structured transactions and events (Pourshahid, Richards and Amyot, 2011).
information and details related to analysing the nature of transactions and decisions.
Decision Support System (DSS): it is an computerised information system which are
used for supporting their decisions within the business. It will help in used to solve issues as well
as make a better decisions. It is extremely advantage for consumers who are travelling
continuously. It is an primary aim of using DSS to give information to consumers in a easy way
to understand. It is benefited due to which can be programmed generated various reports based
on specifications. There are information related to important decisions and making investment
plans are analysed in this decision support system.
16
methodology.
Findings
it is suggested that organisation should analyse the review and feedbacks received form better
optimisation and effectiveness. Analysis done in respect of environment, food appliances and
structure of organisation. Preferable destinations are defined subject to elaborate and determine
the aspects of best operations.
Recommendation
It is recommended that organisation need to change some internal parts subject to attract more
customer attraction and vision. It is recommended that organisation need to improve product
quality and comprise the prise of products.
Conclusion
Overall results shows positive response and organisation is able to gain consumer and customer
interest. It is expected that Food and Friends will get positive and increased returns.
TASK 4
4.1 Use of proper information as processing tool
Transactional processing system (TPS): transaction support system helps to analyse the
performance of organisation in respect of collecting the data and information in effective
manner. Collecting, bifurcating and interpretation the information for effective use is define in
this matter. This is basically used to analyse and bifurcate and modify information and details in
sections. It assist user to run arbitrary programs as time sharing, transactional process and allows
only pre decided structured transactions and events (Pourshahid, Richards and Amyot, 2011).
information and details related to analysing the nature of transactions and decisions.
Decision Support System (DSS): it is an computerised information system which are
used for supporting their decisions within the business. It will help in used to solve issues as well
as make a better decisions. It is extremely advantage for consumers who are travelling
continuously. It is an primary aim of using DSS to give information to consumers in a easy way
to understand. It is benefited due to which can be programmed generated various reports based
on specifications. There are information related to important decisions and making investment
plans are analysed in this decision support system.
16
Management information system (MIS): this support system basically used in large
business entities and large organisations subject to analyse performance and durability and
credibility of business plans and interpretations. This is also one of the important aspect which
remain essential subject to determine effective and important decisions which assist
organisational structure at new dimensions (Nooraie, 2012). this system is mainly associated
with gathering information and details related to functions and operations of organisation.
Statistical information and data are produced to evaluate the dimensions of business and
operations.
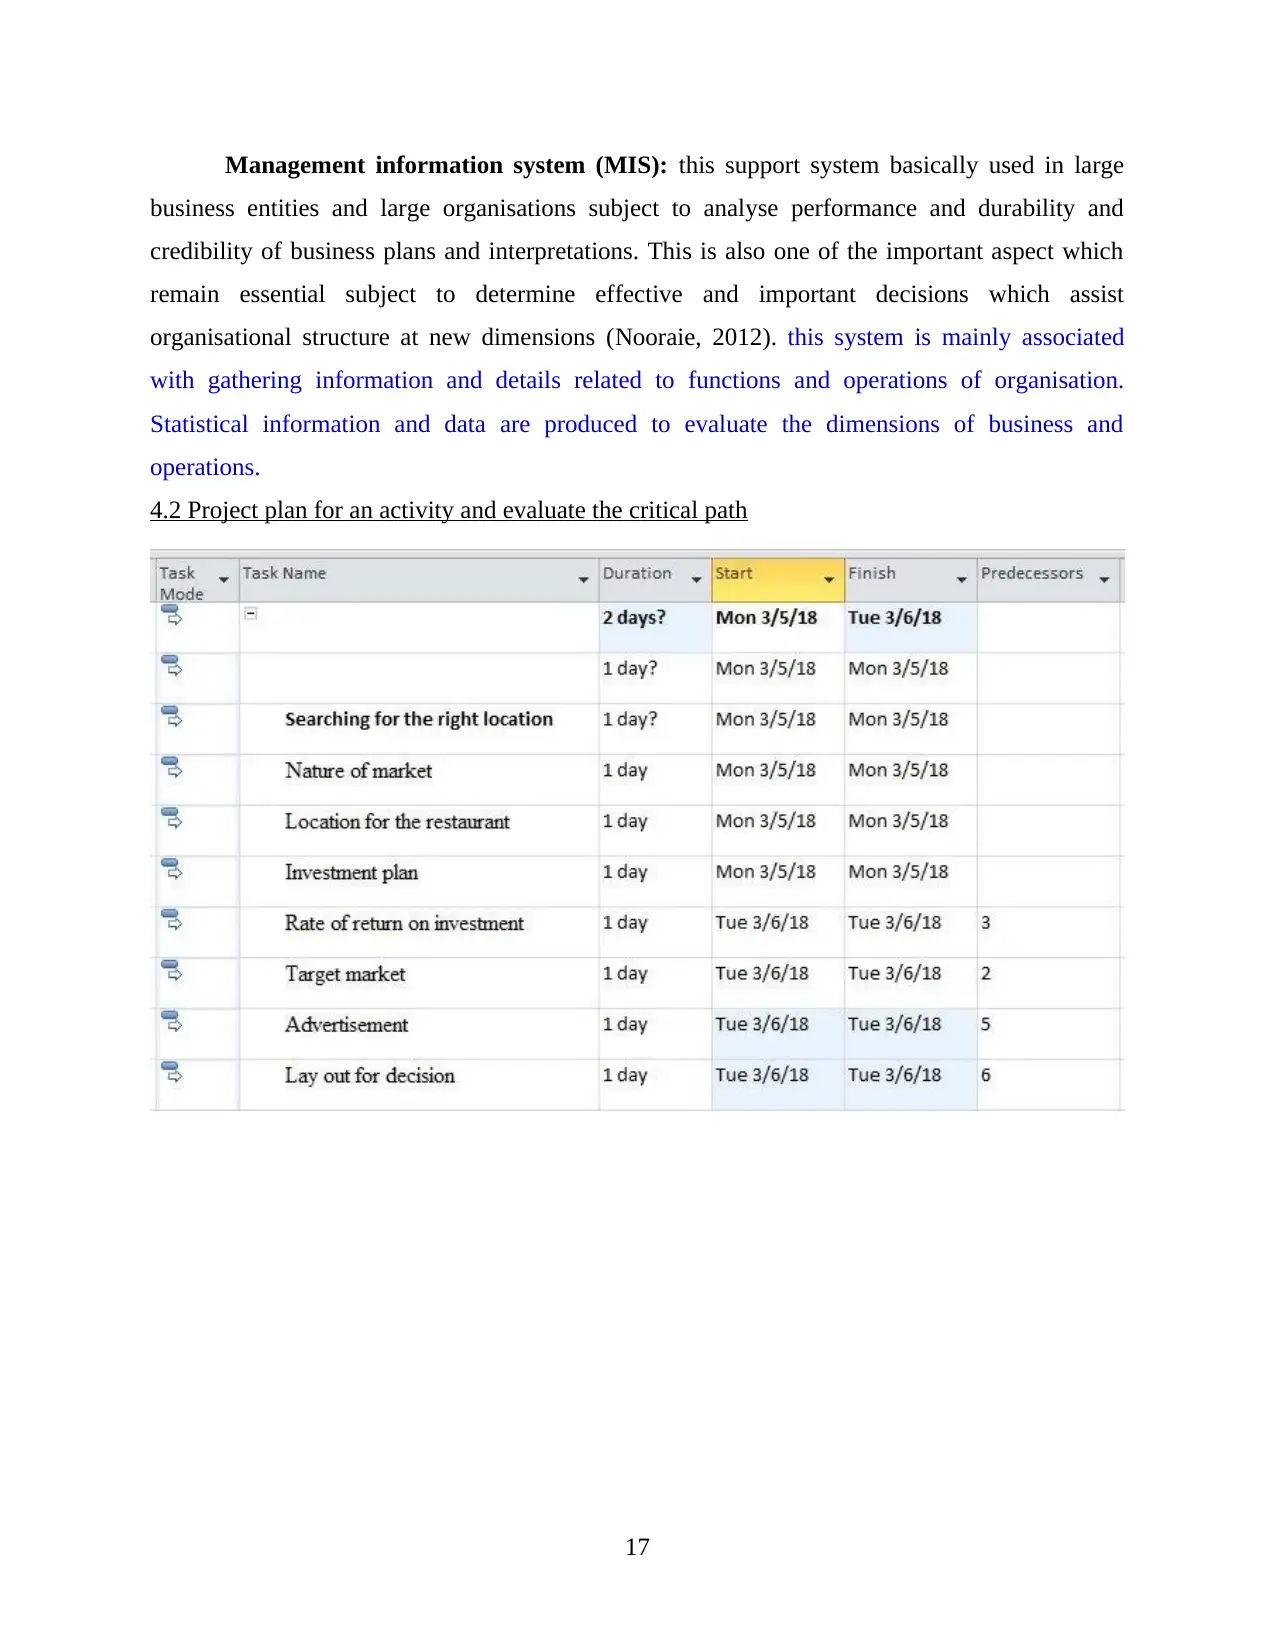
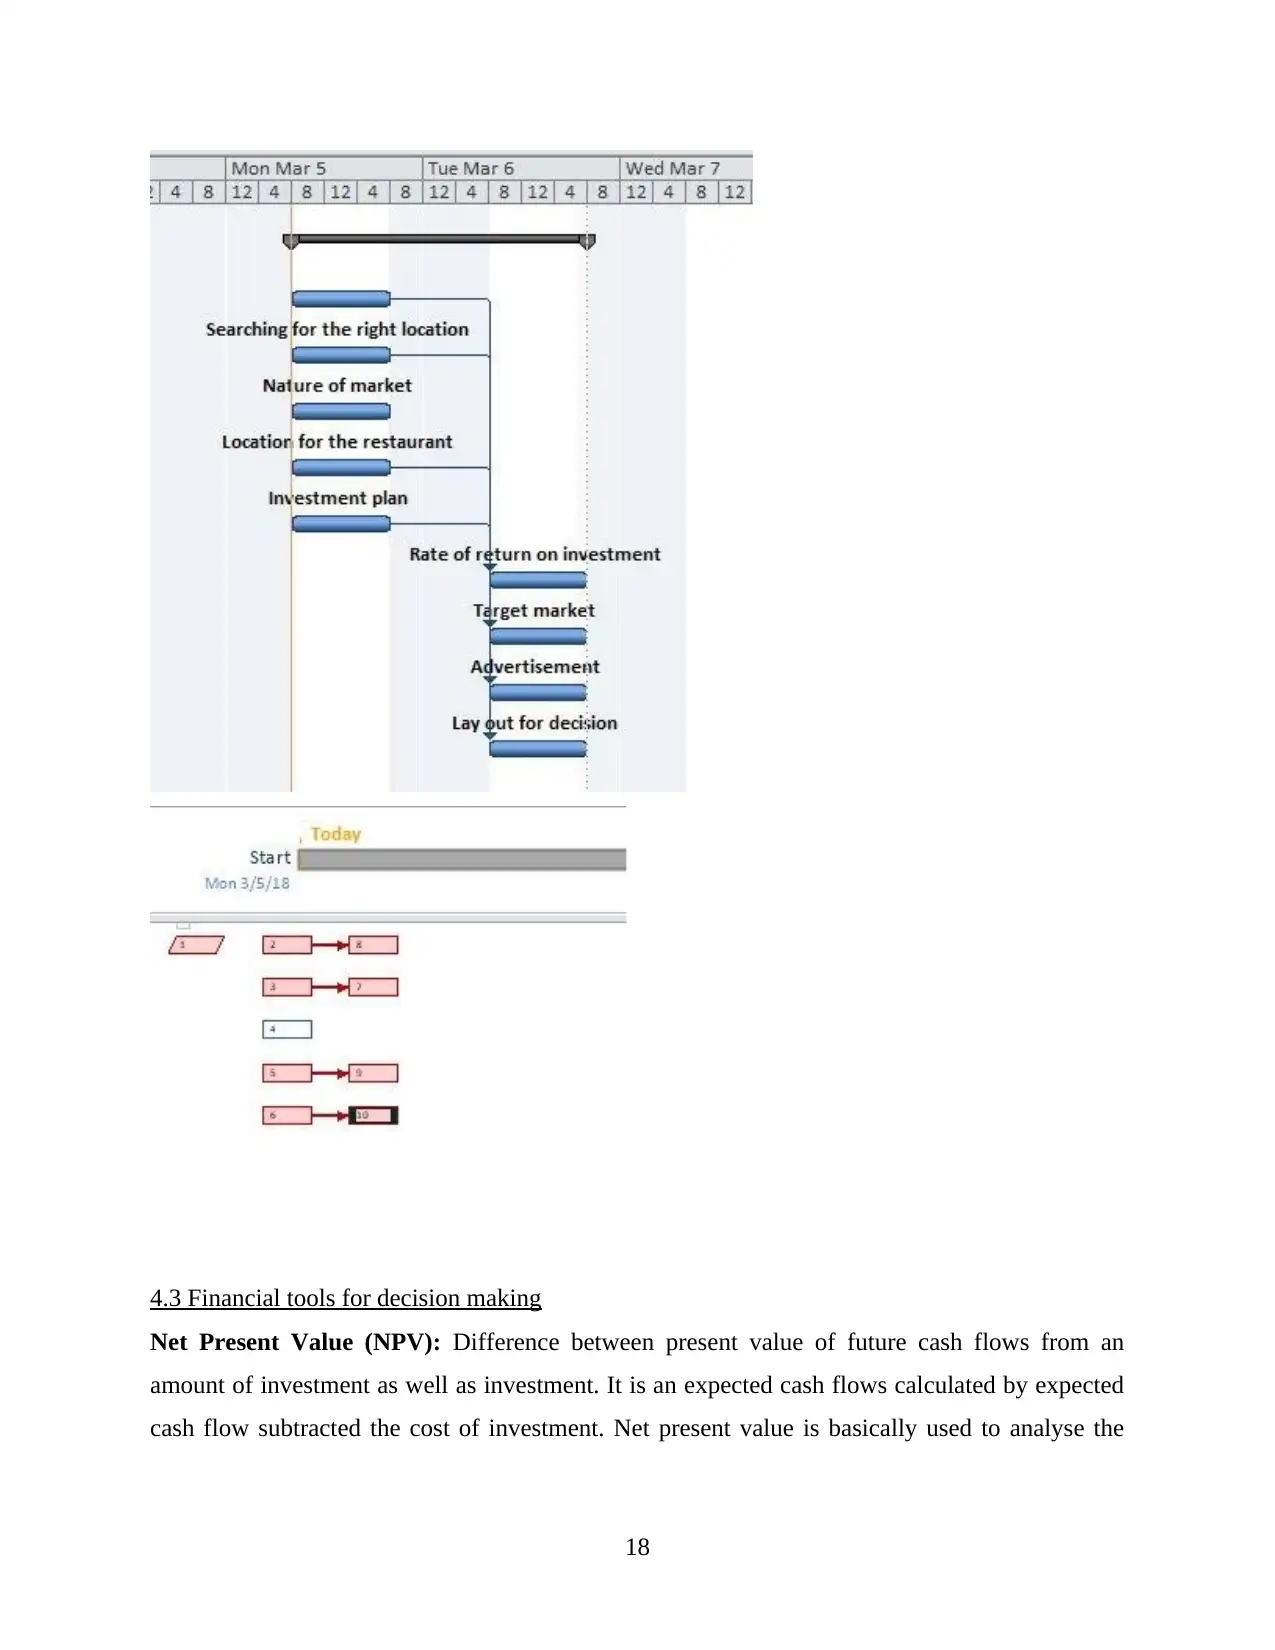
4.2 Project plan for an activity and evaluate the critical path
17
business entities and large organisations subject to analyse performance and durability and
credibility of business plans and interpretations. This is also one of the important aspect which
remain essential subject to determine effective and important decisions which assist
organisational structure at new dimensions (Nooraie, 2012). this system is mainly associated
with gathering information and details related to functions and operations of organisation.
Statistical information and data are produced to evaluate the dimensions of business and
operations.
4.2 Project plan for an activity and evaluate the critical path
17
Paraphrase This Document
Need a fresh take? Get an instant paraphrase of this document with our AI Paraphraser
4.3 Financial tools for decision making
Net Present Value (NPV): Difference between present value of future cash flows from an
amount of investment as well as investment. It is an expected cash flows calculated by expected
cash flow subtracted the cost of investment. Net present value is basically used to analyse the
18
Net Present Value (NPV): Difference between present value of future cash flows from an
amount of investment as well as investment. It is an expected cash flows calculated by expected
cash flow subtracted the cost of investment. Net present value is basically used to analyse the
18
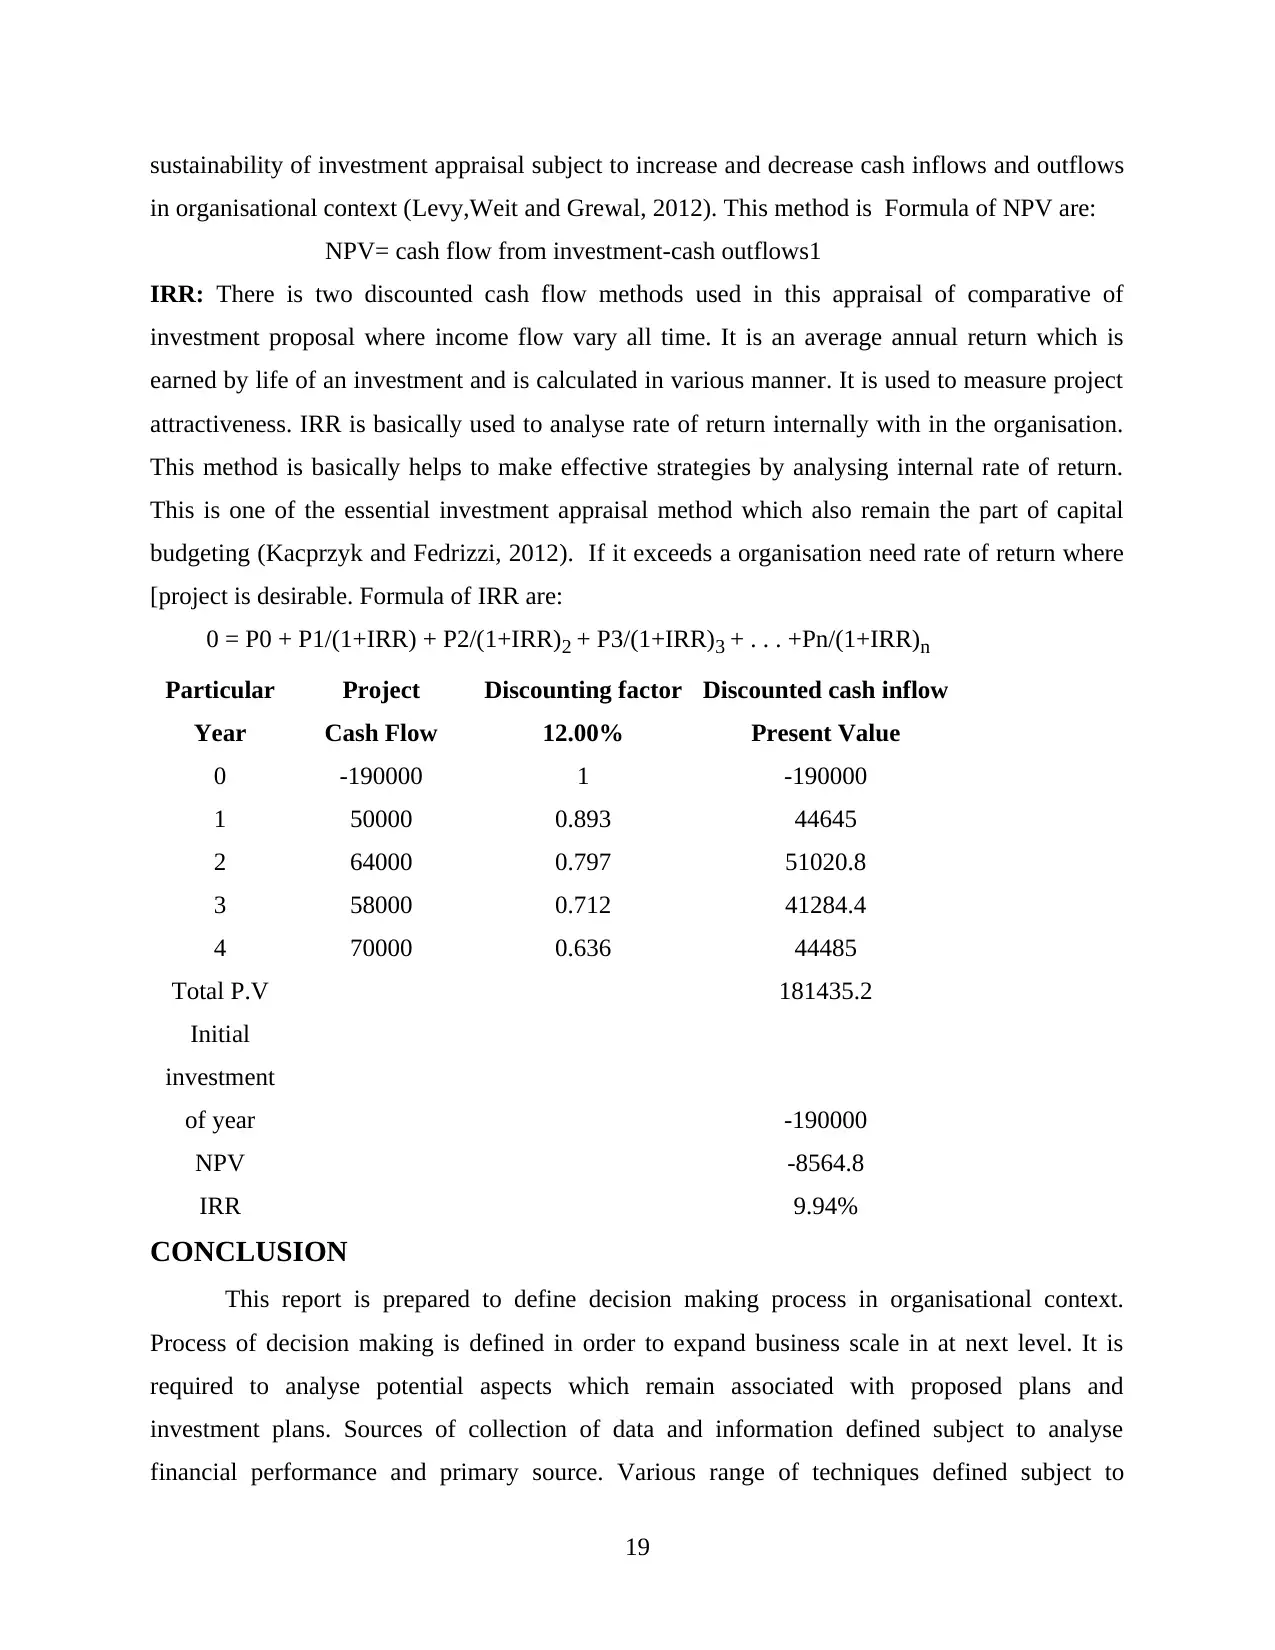
sustainability of investment appraisal subject to increase and decrease cash inflows and outflows
in organisational context (Levy,Weit and Grewal, 2012). This method is Formula of NPV are:
NPV= cash flow from investment-cash outflows1
IRR: There is two discounted cash flow methods used in this appraisal of comparative of
investment proposal where income flow vary all time. It is an average annual return which is
earned by life of an investment and is calculated in various manner. It is used to measure project
attractiveness. IRR is basically used to analyse rate of return internally with in the organisation.
This method is basically helps to make effective strategies by analysing internal rate of return.
This is one of the essential investment appraisal method which also remain the part of capital
budgeting (Kacprzyk and Fedrizzi, 2012). If it exceeds a organisation need rate of return where
[project is desirable. Formula of IRR are:
0 = P0 + P1/(1+IRR) + P2/(1+IRR)2 + P3/(1+IRR)3 + . . . +Pn/(1+IRR)n
Particular Project Discounting factor Discounted cash inflow
Year Cash Flow 12.00% Present Value
0 -190000 1 -190000
1 50000 0.893 44645
2 64000 0.797 51020.8
3 58000 0.712 41284.4
4 70000 0.636 44485
Total P.V 181435.2
Initial
investment
of year -190000
NPV -8564.8
IRR 9.94%
CONCLUSION
This report is prepared to define decision making process in organisational context.
Process of decision making is defined in order to expand business scale in at next level. It is
required to analyse potential aspects which remain associated with proposed plans and
investment plans. Sources of collection of data and information defined subject to analyse
financial performance and primary source. Various range of techniques defined subject to
19
1 out of 21
Related Documents


Your All-in-One AI-Powered Toolkit for Academic Success.
+13062052269
info@desklib.com
Available 24*7 on WhatsApp / Email
![[object Object]](/_next/static/media/star-bottom.7253800d.svg)
Unlock your academic potential
© 2024 | Zucol Services PVT LTD | All rights reserved.