Business Decision Making
VerifiedAdded on 2023/01/04
|13
|2054
|61
AI Summary
This document discusses various aspects of business decision making. It covers topics such as statistical analysis, payback period, accounting rate of return, net present value, and internal rate of return. The content provides insights into the importance and limitations of these decision-making tools. It also includes examples and explanations to help understand the concepts better.
Contribute Materials
Your contribution can guide someone’s learning journey. Share your
documents today.

Business Decision Making
Secure Best Marks with AI Grader
Need help grading? Try our AI Grader for instant feedback on your assignments.

Contents
TASK...............................................................................................................................................3
Question 1...............................................................................................................................3
Question 2...............................................................................................................................3
Question 3...............................................................................................................................5
Question 4...............................................................................................................................5
Question 5...............................................................................................................................5
Question 6...............................................................................................................................7

TASK
Question 1
Number Tally Frequency
2 II 2
3 I 1
4 IIII 4
5 IIII 4
6 IIII 4
7 II 2
Question 2
Mean
7
11
11
15
20
20
28
29
35
15
36
54
22
45
32
11
15
= 406 / 17 =
Question 1
Number Tally Frequency
2 II 2
3 I 1
4 IIII 4
5 IIII 4
6 IIII 4
7 II 2
Question 2
Mean
7
11
11
15
20
20
28
29
35
15
36
54
22
45
32
11
15
= 406 / 17 =
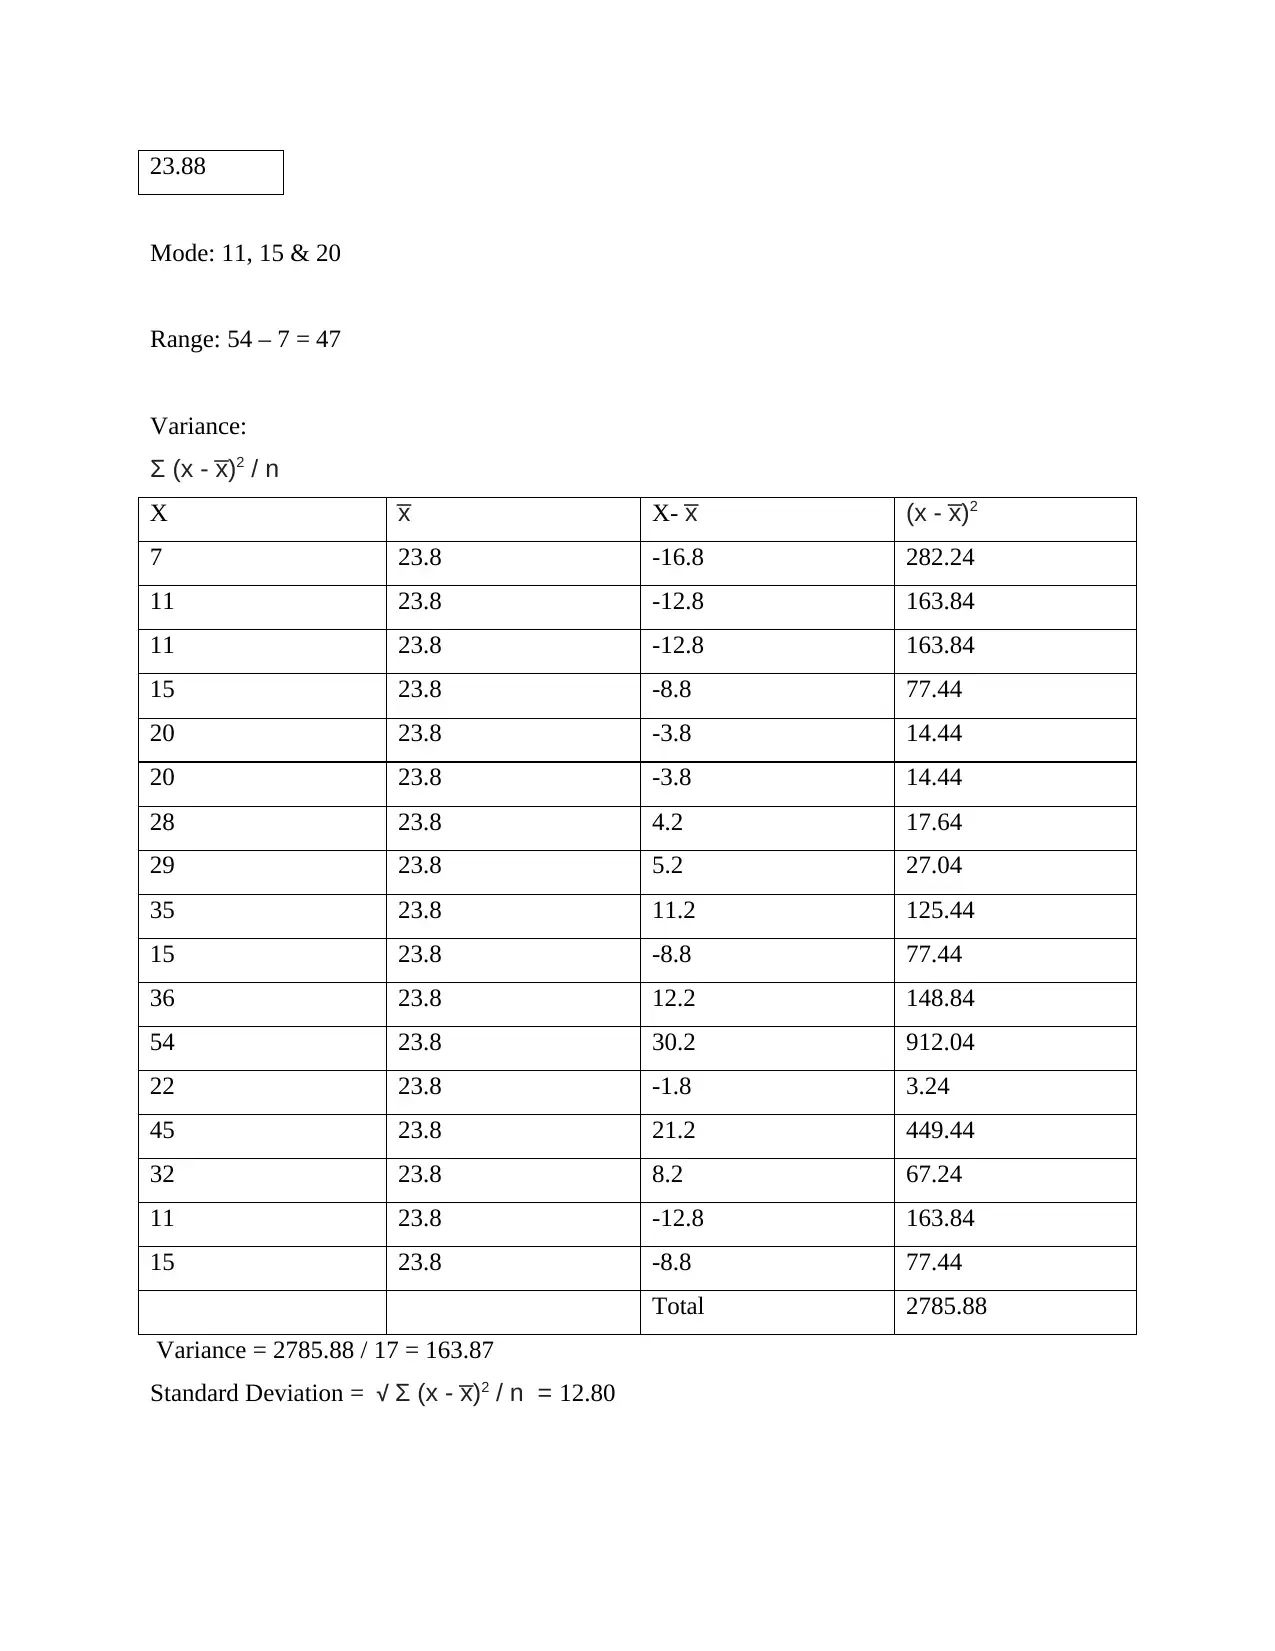
23.88
Mode: 11, 15 & 20
Range: 54 – 7 = 47
Variance:
Σ (x - x̅)2 / n
X x̅ X- x̅ (x - x̅)2
7 23.8 -16.8 282.24
11 23.8 -12.8 163.84
11 23.8 -12.8 163.84
15 23.8 -8.8 77.44
20 23.8 -3.8 14.44
20 23.8 -3.8 14.44
28 23.8 4.2 17.64
29 23.8 5.2 27.04
35 23.8 11.2 125.44
15 23.8 -8.8 77.44
36 23.8 12.2 148.84
54 23.8 30.2 912.04
22 23.8 -1.8 3.24
45 23.8 21.2 449.44
32 23.8 8.2 67.24
11 23.8 -12.8 163.84
15 23.8 -8.8 77.44
Total 2785.88
Variance = 2785.88 / 17 = 163.87
Standard Deviation = √ Σ (x - x̅)2 / n = 12.80
Secure Best Marks with AI Grader
Need help grading? Try our AI Grader for instant feedback on your assignments.
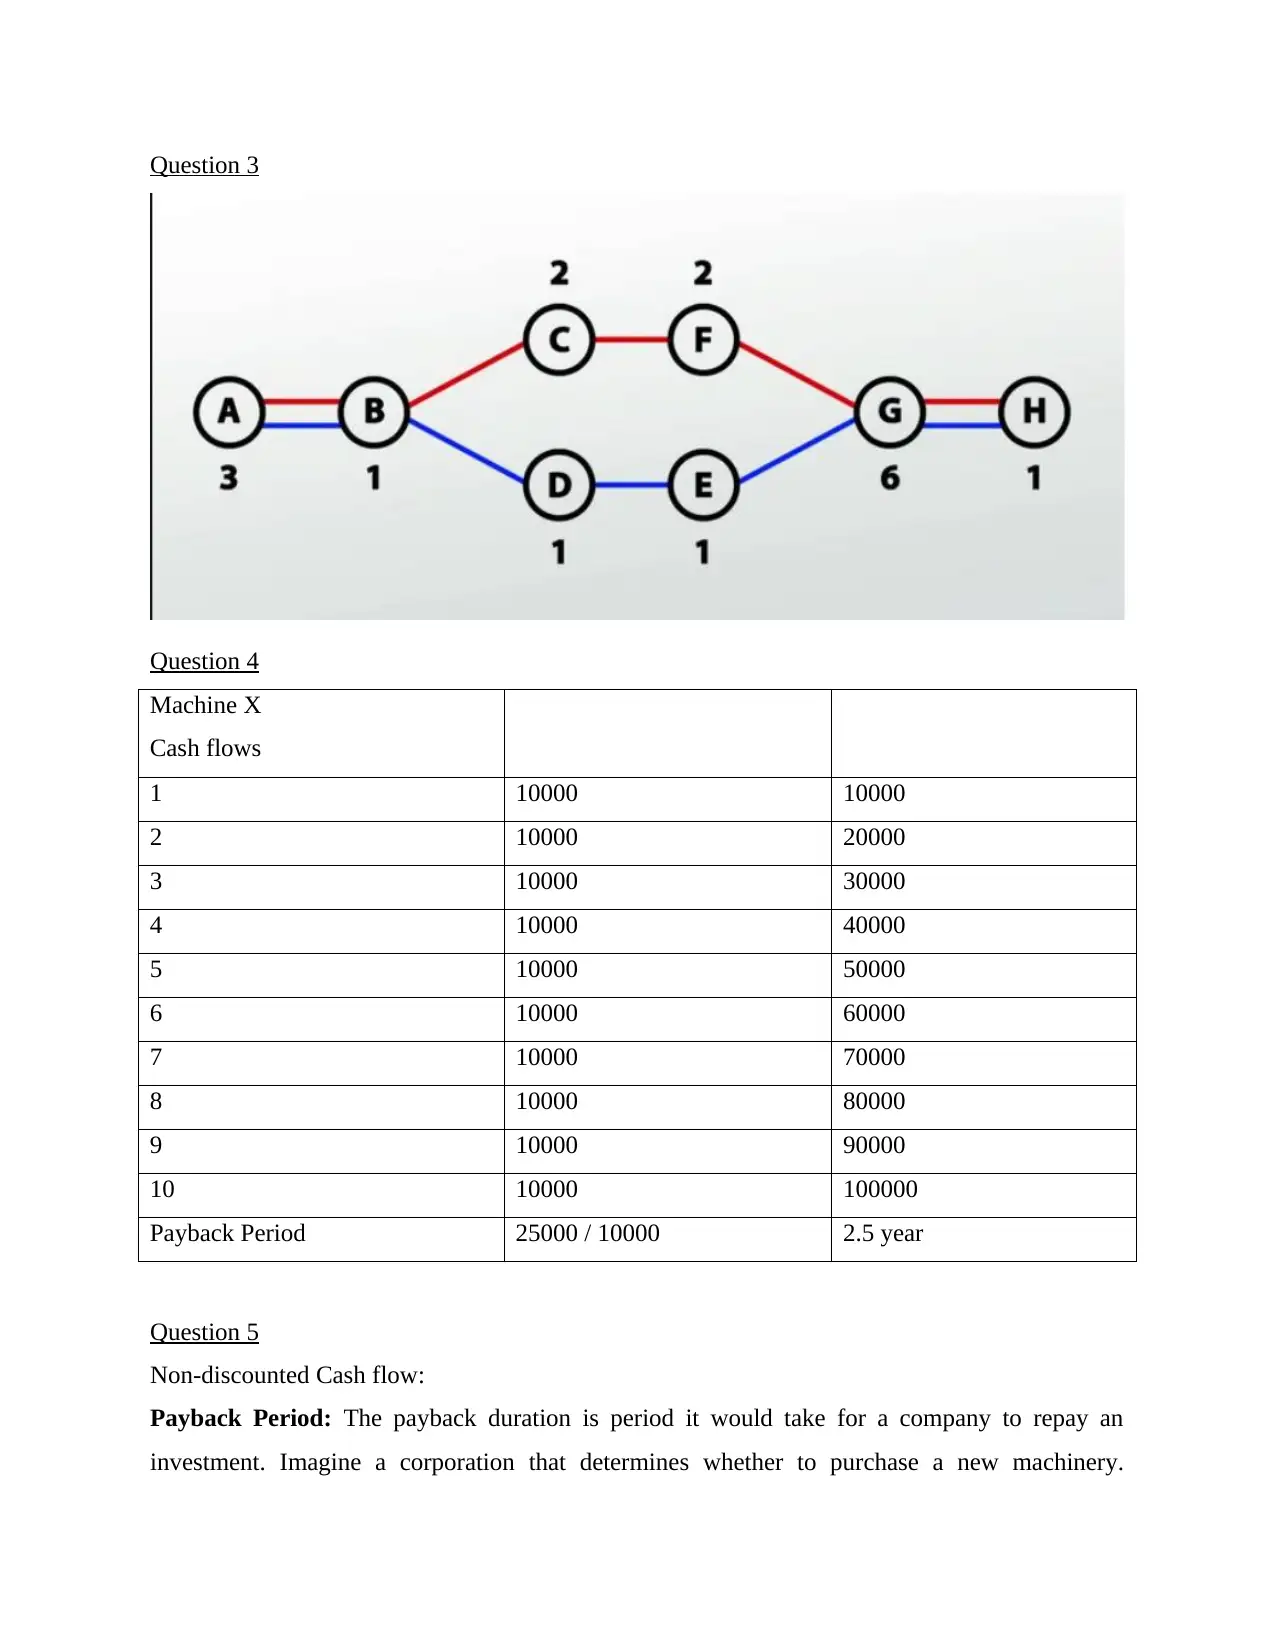
Question 3
Question 4
Machine X
Cash flows
1 10000 10000
2 10000 20000
3 10000 30000
4 10000 40000
5 10000 50000
6 10000 60000
7 10000 70000
8 10000 80000
9 10000 90000
10 10000 100000
Payback Period 25000 / 10000 2.5 year
Question 5
Non-discounted Cash flow:
Payback Period: The payback duration is period it would take for a company to repay an
investment. Imagine a corporation that determines whether to purchase a new machinery.
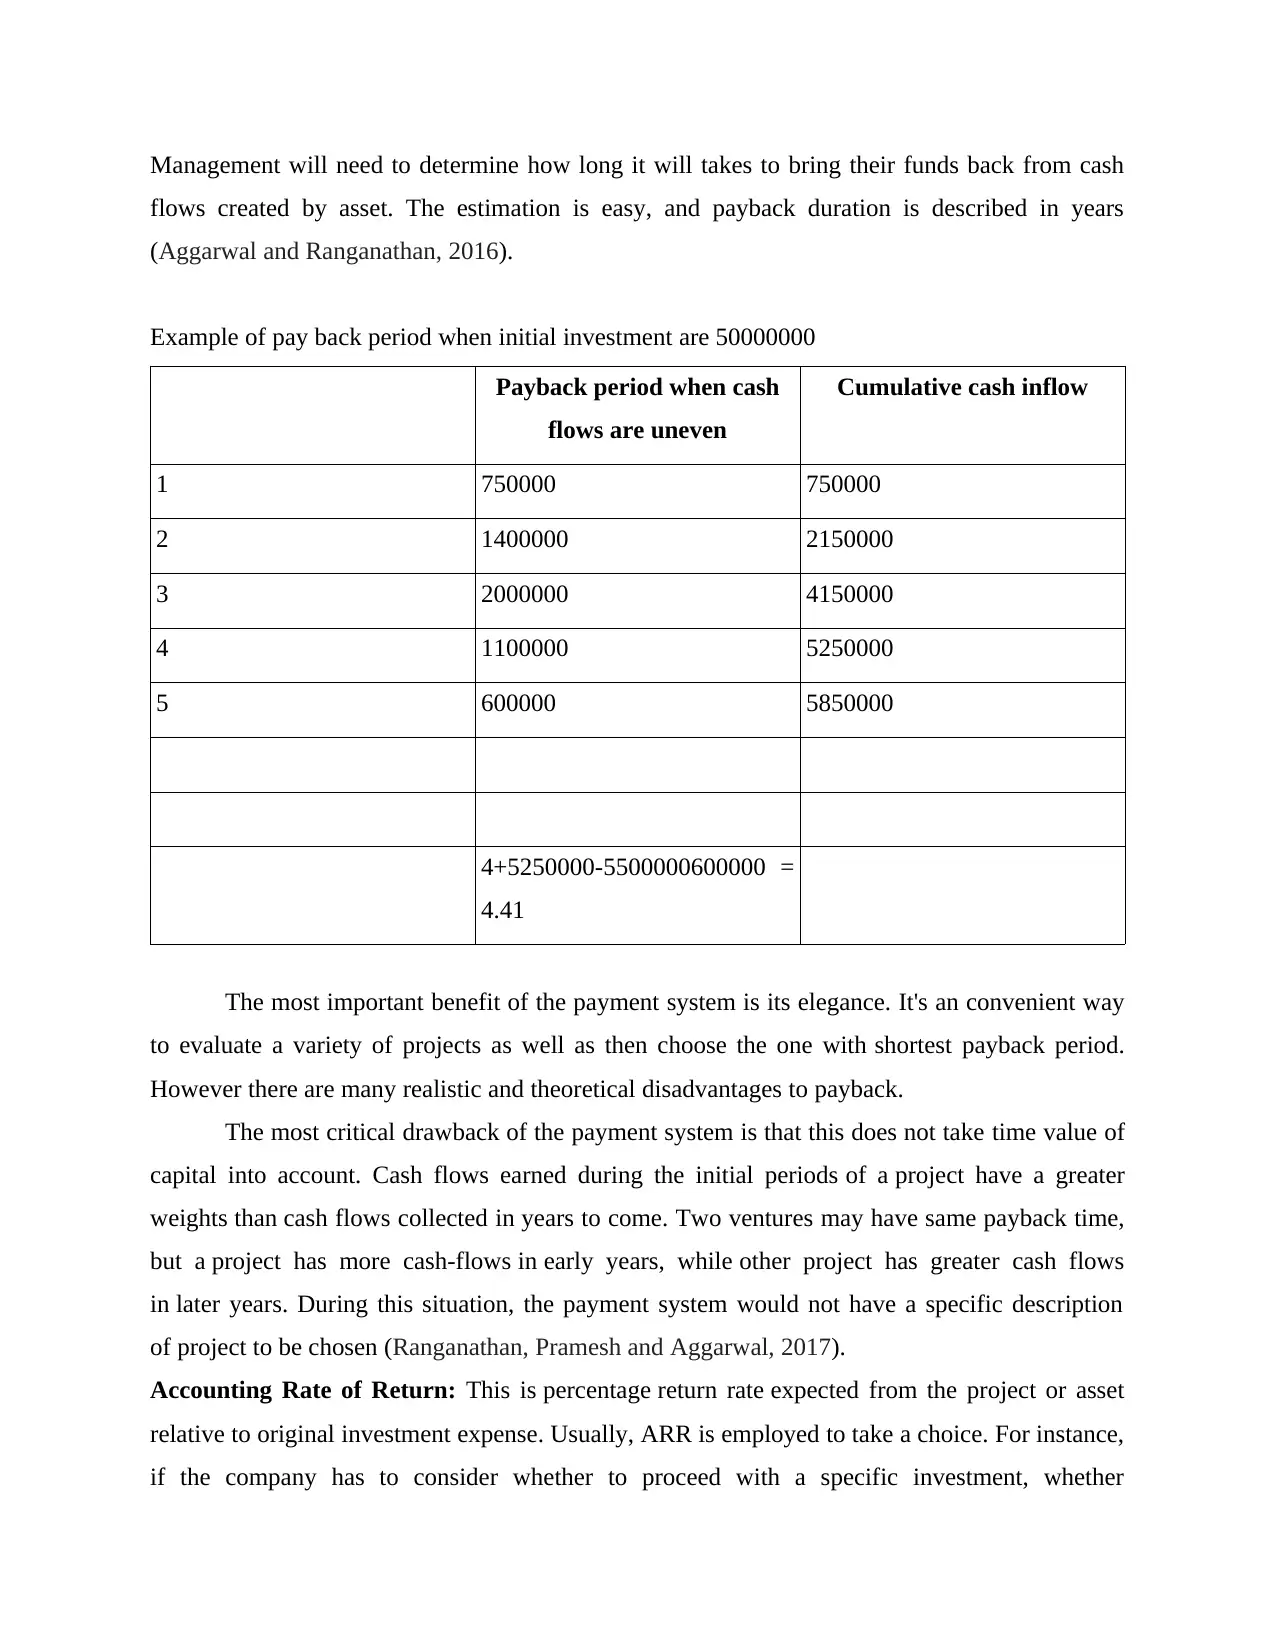
Management will need to determine how long it will takes to bring their funds back from cash
flows created by asset. The estimation is easy, and payback duration is described in years
(Aggarwal and Ranganathan, 2016).
Example of pay back period when initial investment are 50000000
Payback period when cash
flows are uneven
Cumulative cash inflow
1 750000 750000
2 1400000 2150000
3 2000000 4150000
4 1100000 5250000
5 600000 5850000
4+5250000-5500000600000 =
4.41
The most important benefit of the payment system is its elegance. It's an convenient way
to evaluate a variety of projects as well as then choose the one with shortest payback period.
However there are many realistic and theoretical disadvantages to payback.
The most critical drawback of the payment system is that this does not take time value of
capital into account. Cash flows earned during the initial periods of a project have a greater
weights than cash flows collected in years to come. Two ventures may have same payback time,
but a project has more cash-flows in early years, while other project has greater cash flows
in later years. During this situation, the payment system would not have a specific description
of project to be chosen (Ranganathan, Pramesh and Aggarwal, 2017).
Accounting Rate of Return: This is percentage return rate expected from the project or asset
relative to original investment expense. Usually, ARR is employed to take a choice. For instance,
if the company has to consider whether to proceed with a specific investment, whether
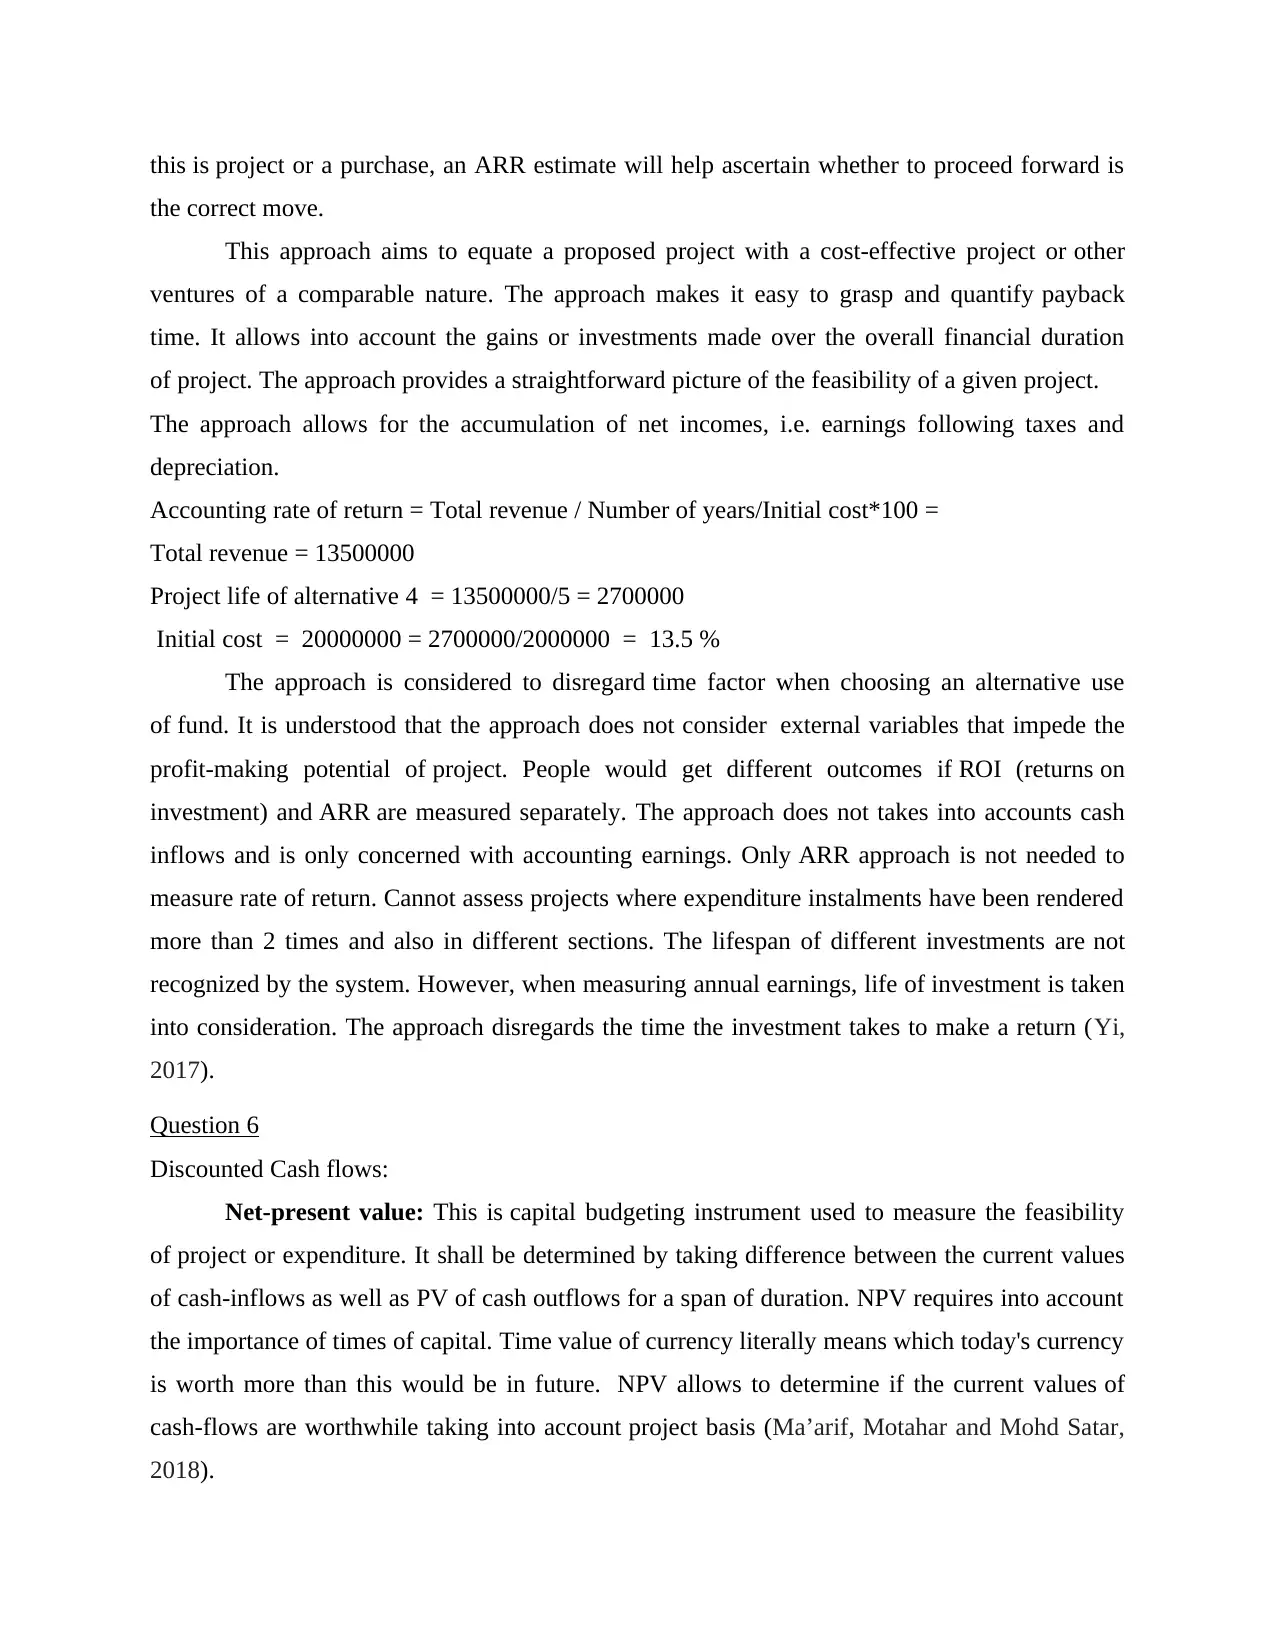
this is project or a purchase, an ARR estimate will help ascertain whether to proceed forward is
the correct move.
This approach aims to equate a proposed project with a cost-effective project or other
ventures of a comparable nature. The approach makes it easy to grasp and quantify payback
time. It allows into account the gains or investments made over the overall financial duration
of project. The approach provides a straightforward picture of the feasibility of a given project.
The approach allows for the accumulation of net incomes, i.e. earnings following taxes and
depreciation.
Accounting rate of return = Total revenue / Number of years/Initial cost*100 =
Total revenue = 13500000
Project life of alternative 4 = 13500000/5 = 2700000
Initial cost = 20000000 = 2700000/2000000 = 13.5 %
The approach is considered to disregard time factor when choosing an alternative use
of fund. It is understood that the approach does not consider external variables that impede the
profit-making potential of project. People would get different outcomes if ROI (returns on
investment) and ARR are measured separately. The approach does not takes into accounts cash
inflows and is only concerned with accounting earnings. Only ARR approach is not needed to
measure rate of return. Cannot assess projects where expenditure instalments have been rendered
more than 2 times and also in different sections. The lifespan of different investments are not
recognized by the system. However, when measuring annual earnings, life of investment is taken
into consideration. The approach disregards the time the investment takes to make a return (Yi,
2017).
Question 6
Discounted Cash flows:
Net-present value: This is capital budgeting instrument used to measure the feasibility
of project or expenditure. It shall be determined by taking difference between the current values
of cash-inflows as well as PV of cash outflows for a span of duration. NPV requires into account
the importance of times of capital. Time value of currency literally means which today's currency
is worth more than this would be in future. NPV allows to determine if the current values of
cash-flows are worthwhile taking into account project basis (Ma’arif, Motahar and Mohd Satar,
2018).
Paraphrase This Document
Need a fresh take? Get an instant paraphrase of this document with our AI Paraphraser
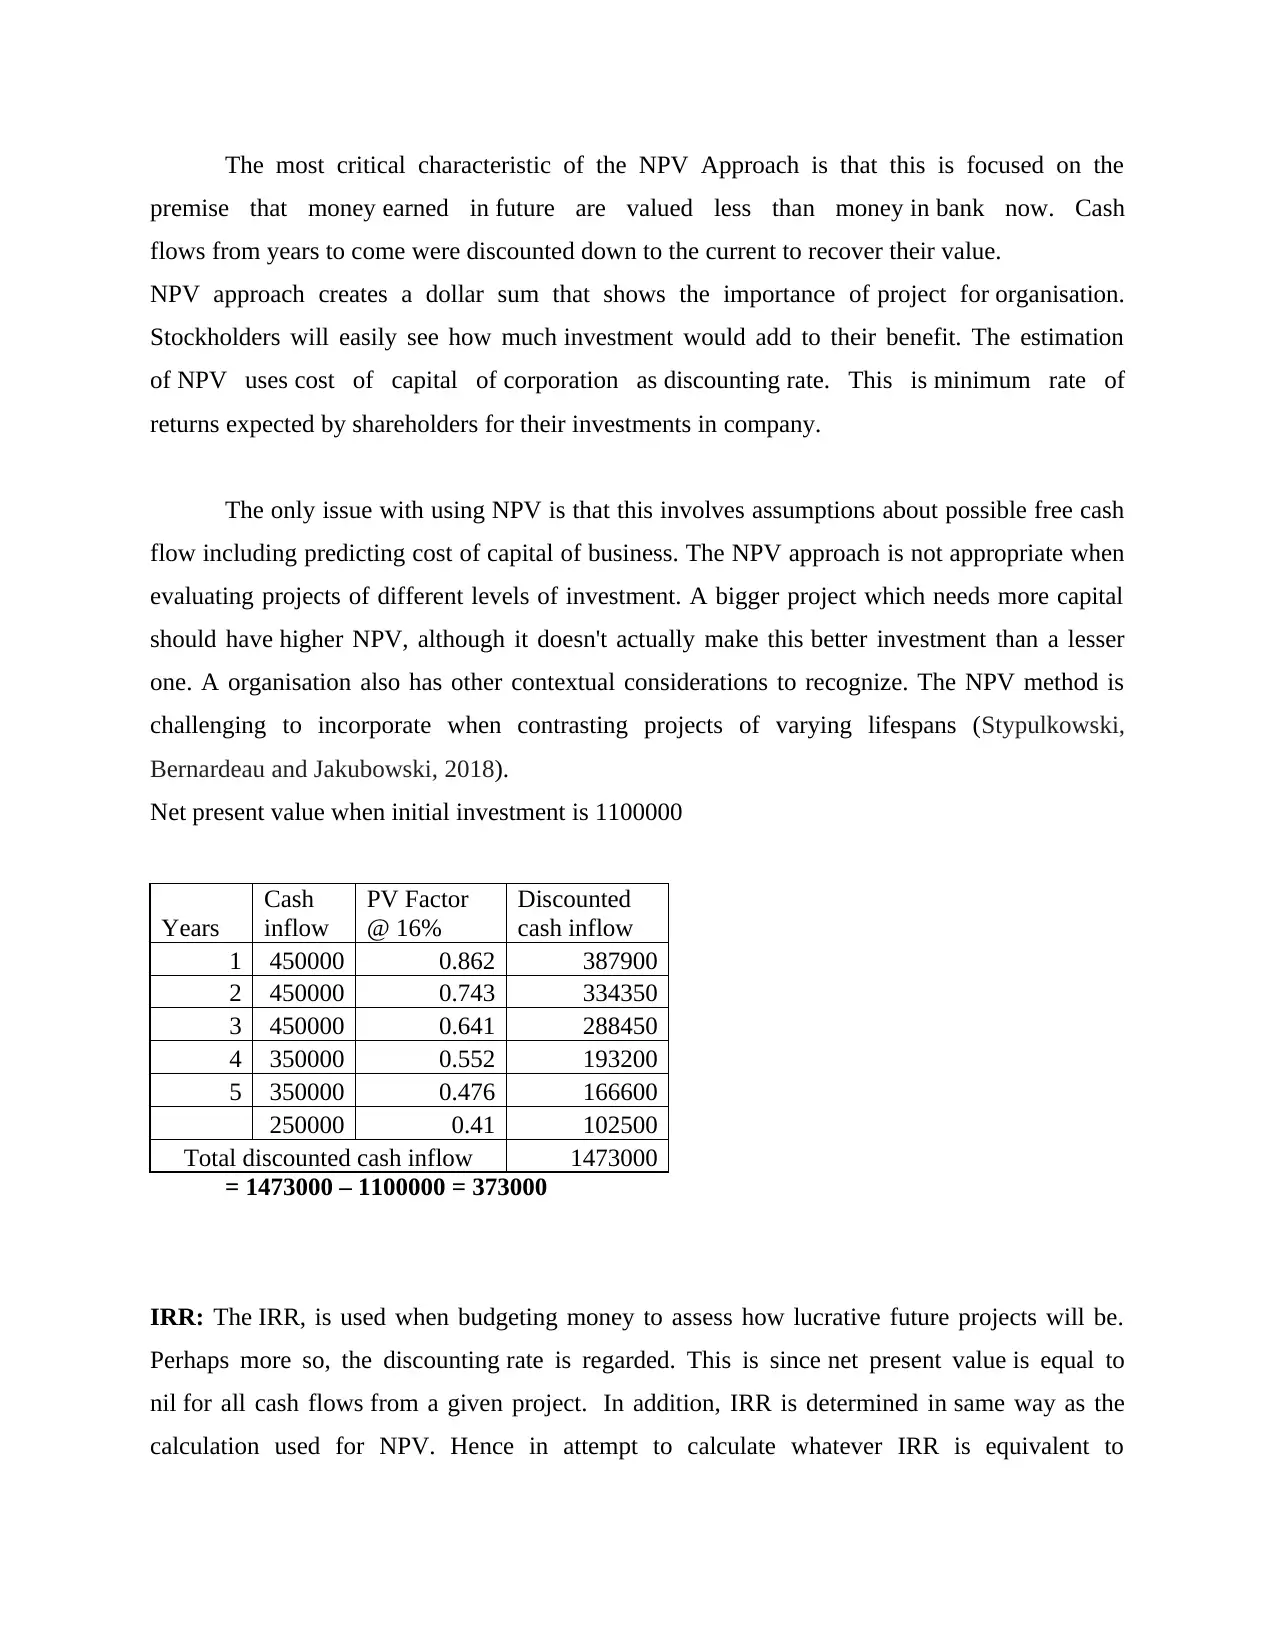
The most critical characteristic of the NPV Approach is that this is focused on the
premise that money earned in future are valued less than money in bank now. Cash
flows from years to come were discounted down to the current to recover their value.
NPV approach creates a dollar sum that shows the importance of project for organisation.
Stockholders will easily see how much investment would add to their benefit. The estimation
of NPV uses cost of capital of corporation as discounting rate. This is minimum rate of
returns expected by shareholders for their investments in company.
The only issue with using NPV is that this involves assumptions about possible free cash
flow including predicting cost of capital of business. The NPV approach is not appropriate when
evaluating projects of different levels of investment. A bigger project which needs more capital
should have higher NPV, although it doesn't actually make this better investment than a lesser
one. A organisation also has other contextual considerations to recognize. The NPV method is
challenging to incorporate when contrasting projects of varying lifespans (Stypulkowski,
Bernardeau and Jakubowski, 2018).
Net present value when initial investment is 1100000
Years
Cash
inflow
PV Factor
@ 16%
Discounted
cash inflow
1 450000 0.862 387900
2 450000 0.743 334350
3 450000 0.641 288450
4 350000 0.552 193200
5 350000 0.476 166600
250000 0.41 102500
Total discounted cash inflow 1473000
= 1473000 – 1100000 = 373000
IRR: The IRR, is used when budgeting money to assess how lucrative future projects will be.
Perhaps more so, the discounting rate is regarded. This is since net present value is equal to
nil for all cash flows from a given project. In addition, IRR is determined in same way as the
calculation used for NPV. Hence in attempt to calculate whatever IRR is equivalent to
using formula above, one must actually set NPV to nil as well as solve discount rate. Conversely,
IRR is usually not measured analytically, either by guesswork or through advanced computer
systems. Usually, where project has high internal cost of return, this much more attractive to take
part in projects. Many uses internal rate-of-return to score project prospects open to make most
optimal choice to make.
Example
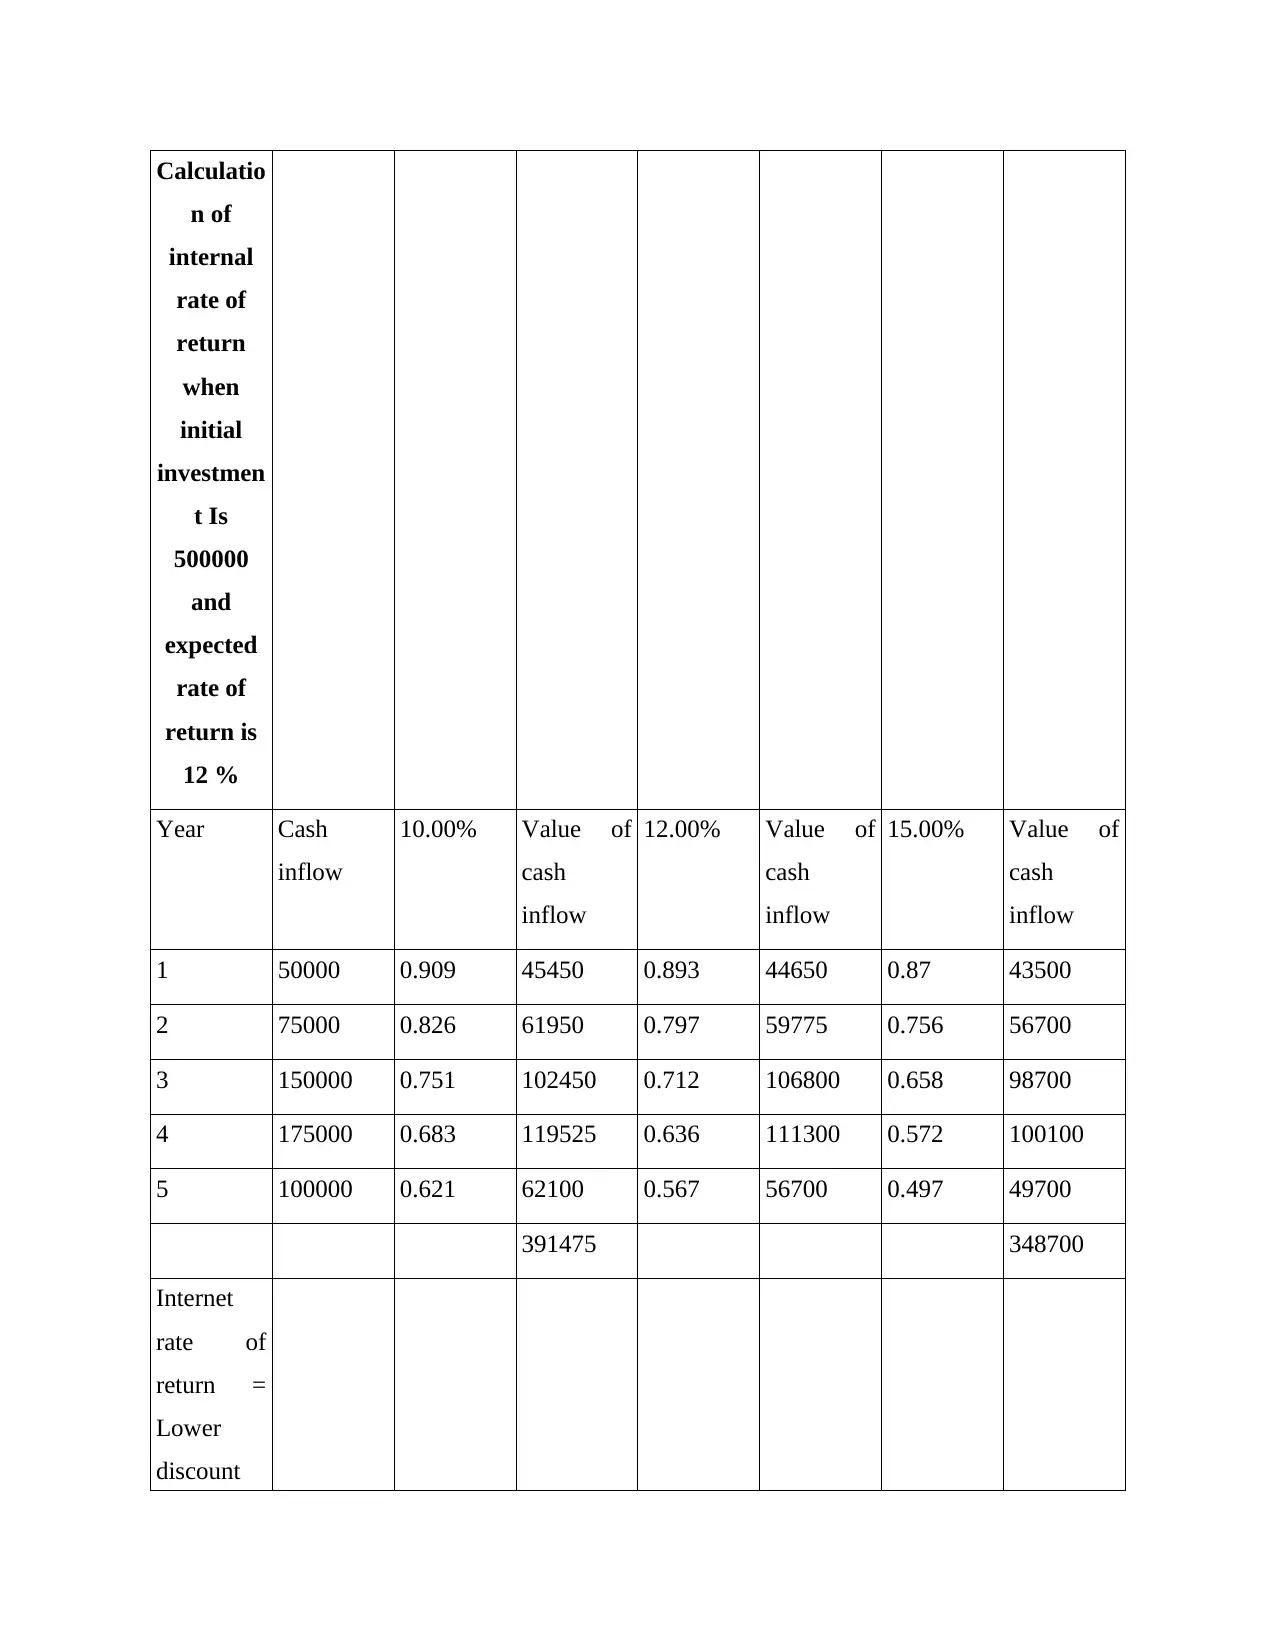
IRR is calculated as determine interest rate where current value of potential cash flows
is equal to capital investment needed. This ensures that all cash balances in the future will be
treated as component of IRR estimate. This helps and cash flows to be given an equivalent
weighted when gazing at value of money from time perspective. The IRR is simple metric to
determine. The knowledge it offers allows it possible to contrast the importance or value
of different projects that might be considered at any specified period. When accurately estimated,
company owners will easily see which ventures will produce the most possible cash profits
in future. This is also feasible to apply IRR as method of seeking cost-saving options for
potential sales or savings (Ndanyenbah and Zakaria, 2019).
When estimating IRR, cost of capital rate is not expected to be component of the
measurement. Often referred to as "hurdle rate," this number is rate of return expected to finance
the project. While this could be a benefit, since hurdle rate is often a discretionary figure, often
this can be verified figure. In this case, the IRR cannot have an exact estimation of the cost.
IRR is usually not measured analytically, either by guesswork or through advanced computer
systems. Usually, where project has high internal cost of return, this much more attractive to take
part in projects. Many uses internal rate-of-return to score project prospects open to make most
optimal choice to make.
Example
IRR is calculated as determine interest rate where current value of potential cash flows
is equal to capital investment needed. This ensures that all cash balances in the future will be
treated as component of IRR estimate. This helps and cash flows to be given an equivalent
weighted when gazing at value of money from time perspective. The IRR is simple metric to
determine. The knowledge it offers allows it possible to contrast the importance or value
of different projects that might be considered at any specified period. When accurately estimated,
company owners will easily see which ventures will produce the most possible cash profits
in future. This is also feasible to apply IRR as method of seeking cost-saving options for
potential sales or savings (Ndanyenbah and Zakaria, 2019).
When estimating IRR, cost of capital rate is not expected to be component of the
measurement. Often referred to as "hurdle rate," this number is rate of return expected to finance
the project. While this could be a benefit, since hurdle rate is often a discretionary figure, often
this can be verified figure. In this case, the IRR cannot have an exact estimation of the cost.
Calculatio
n of
internal
rate of
return
when
initial
investmen
t Is
500000
and
expected
rate of
return is
12 %
Year Cash
inflow
10.00% Value of
cash
inflow
12.00% Value of
cash
inflow
15.00% Value of
cash
inflow
1 50000 0.909 45450 0.893 44650 0.87 43500
2 75000 0.826 61950 0.797 59775 0.756 56700
3 150000 0.751 102450 0.712 106800 0.658 98700
4 175000 0.683 119525 0.636 111300 0.572 100100
5 100000 0.621 62100 0.567 56700 0.497 49700
391475 348700
Internet
rate of
return =
Lower
discount
Secure Best Marks with AI Grader
Need help grading? Try our AI Grader for instant feedback on your assignments.

Calculatio
n of
internal
rate of
return
when
initial
investmen
t Is
500000
and
expected
rate of
return is
12 %
rate/ Net
present
value at
lower
discount
rate- Net
present
value of
cash
inflow at
higher
discount
rate *
Lower
discount
rate -
n of
internal
rate of
return
when
initial
investmen
t Is
500000
and
expected
rate of
return is
12 %
rate/ Net
present
value at
lower
discount
rate- Net
present
value of
cash
inflow at
higher
discount
rate *
Lower
discount
rate -
Calculatio
n of
internal
rate of
return
when
initial
investmen
t Is
500000
and
expected
rate of
return is
12 %
higher
discount
rate
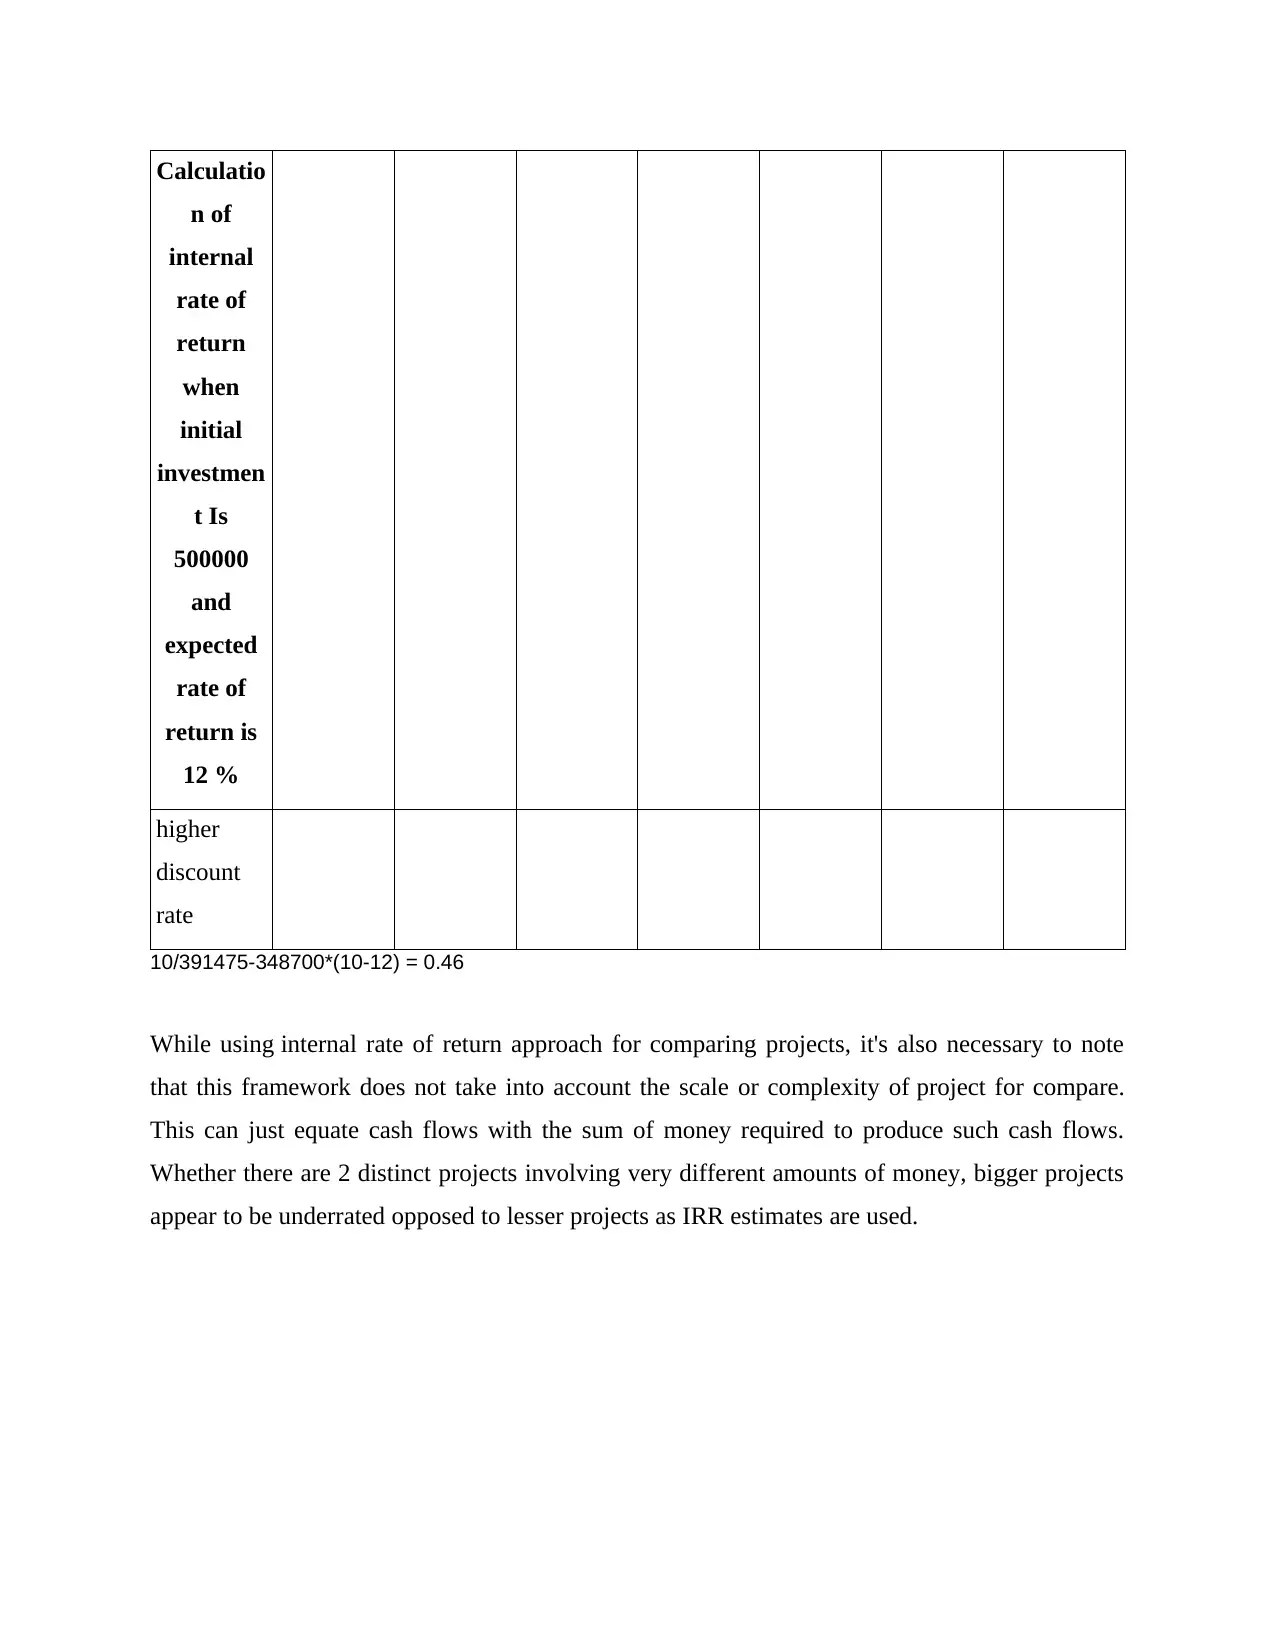
10/391475-348700*(10-12) = 0.46
While using internal rate of return approach for comparing projects, it's also necessary to note
that this framework does not take into account the scale or complexity of project for compare.
This can just equate cash flows with the sum of money required to produce such cash flows.
Whether there are 2 distinct projects involving very different amounts of money, bigger projects
appear to be underrated opposed to lesser projects as IRR estimates are used.
n of
internal
rate of
return
when
initial
investmen
t Is
500000
and
expected
rate of
return is
12 %
higher
discount
rate
10/391475-348700*(10-12) = 0.46
While using internal rate of return approach for comparing projects, it's also necessary to note
that this framework does not take into account the scale or complexity of project for compare.
This can just equate cash flows with the sum of money required to produce such cash flows.
Whether there are 2 distinct projects involving very different amounts of money, bigger projects
appear to be underrated opposed to lesser projects as IRR estimates are used.
REFERENCES
Books and Journals
Aggarwal, R. and Ranganathan, P., 2016. Common pitfalls in statistical analysis: The use of
correlation techniques. Perspectives in clinical research, 7(4), p.187.
Ranganathan, P., Pramesh, C.S. and Aggarwal, R., 2017. Common pitfalls in statistical analysis:
Measures of agreement. Perspectives in clinical research, 8(4), p.187.
Yi, G.Y., 2017. Statistical analysis with measurement error or misclassification: strategy,
method and application. Springer.
Ma’arif, M.Y., Motahar, S.M. and Mohd Satar, N.S., 2018. A descriptive statistical based
analysis on perceptual of ERP training needs. In Proceedings of 2018 International
Conference on Engineering, Science, and Application (ICESA 2018) (pp. 46-62).
Stypulkowski, J.B., Bernardeau, F.G. and Jakubowski, J., 2018. Descriptive statistical analysis of
TBM performance at Abu Hamour Tunnel Phase I. Arabian Journal of
Geosciences, 11(9), p.191.
Ndanyenbah, T.Y. and Zakaria, A., 2019. Application of Investment Appraisal Techniques by
Small and Medium Enterprises (SMEs) Operators in the Tamale Metropolis, Ghana.
1 out of 13


Your All-in-One AI-Powered Toolkit for Academic Success.
+13062052269
info@desklib.com
Available 24*7 on WhatsApp / Email
![[object Object]](/_next/static/media/star-bottom.7253800d.svg)
Unlock your academic potential
© 2024 | Zucol Services PVT LTD | All rights reserved.