Business Decision Making Report on Restaurant Data Analysis
VerifiedAdded on 2020/02/17
|22
|4421
|463
Report
AI Summary
This report presents a comprehensive analysis of data related to a restaurant business, aiming to aid in informed decision-making. The report begins with an introduction outlining the research plan, methodology, and sampling frame. Task 1 focuses on the collection of primary and secondary data through questionnaires and existing literature. Task 2 delves into statistical tools for data analysis, including mean, median, mode, and measures of dispersion like standard deviation. The analysis covers various aspects of the restaurant, such as the impact of interior design, service quality, and order delivery times. Task 3 involves producing graphs and trend analysis charts, with the findings presented in a formal business report. Finally, Task 4 evaluates potential projects using information processing tools, network diagrams, and project evaluation methods like NPV and IRR calculations, culminating in a conclusion and references.

BUSINESS DECISION
MAKING
MAKING
Paraphrase This Document
Need a fresh take? Get an instant paraphrase of this document with our AI Paraphraser
TABLE OF CONTENTS
INTRODUCTION.......................................................................................................................................3
TASK 1.......................................................................................................................................................3
1.1 Plan for collection of data..................................................................................................................3
1.2 Sampling methods and survey methodology of research..................................................................4
1.3 Questionnaire for research................................................................................................................4
TASK 2.......................................................................................................................................................6
2.1 Statistical tools for analysis of data...................................................................................................6
2.2 Analysis of data..................................................................................................................................7
2.3 Measures of dispersion......................................................................................................................8
TASK 3.......................................................................................................................................................9
3.1 Producing graph................................................................................................................................9
3.2 Trend analysis chart.........................................................................................................................11
3.3 Covered in PPT.................................................................................................................................11
3.4 Formal business report....................................................................................................................11
TASK 4........................................................................................................................................................12
4.1 Information processing tools...........................................................................................................12
4.2 Network diagram.............................................................................................................................13
4.3 Project evaluation method..............................................................................................................14
CONCLUSION.........................................................................................................................................15
REFERENCES..........................................................................................................................................16
Figure 1Frequency of eating food in the restaurant...................................................................................10
Figure 2 Quality of services.......................................................................................................................11
Figure 3Trend analysis chart.....................................................................................................................12
Figure 4GANTT chart...............................................................................................................................14
Figure 5Network diagram..........................................................................................................................14
Figure 6Calculation of NPV......................................................................................................................15
Figure 7Calculation of IRR.......................................................................................................................16
Table 1 Descriptive statistics on data...........................................................................................................8
Table 2Calcualtion of standard deviation..................................................................................................10
Table 3 Calculation of correlation and quartile..........................................................................................10
Table 4Frequency of eating food in the restaurant.....................................................................................11
Table 5Quality of services.........................................................................................................................12
⊘ This is a preview!⊘
Do you want full access?
Subscribe today to unlock all pages.
Trusted by 1+ million students worldwide
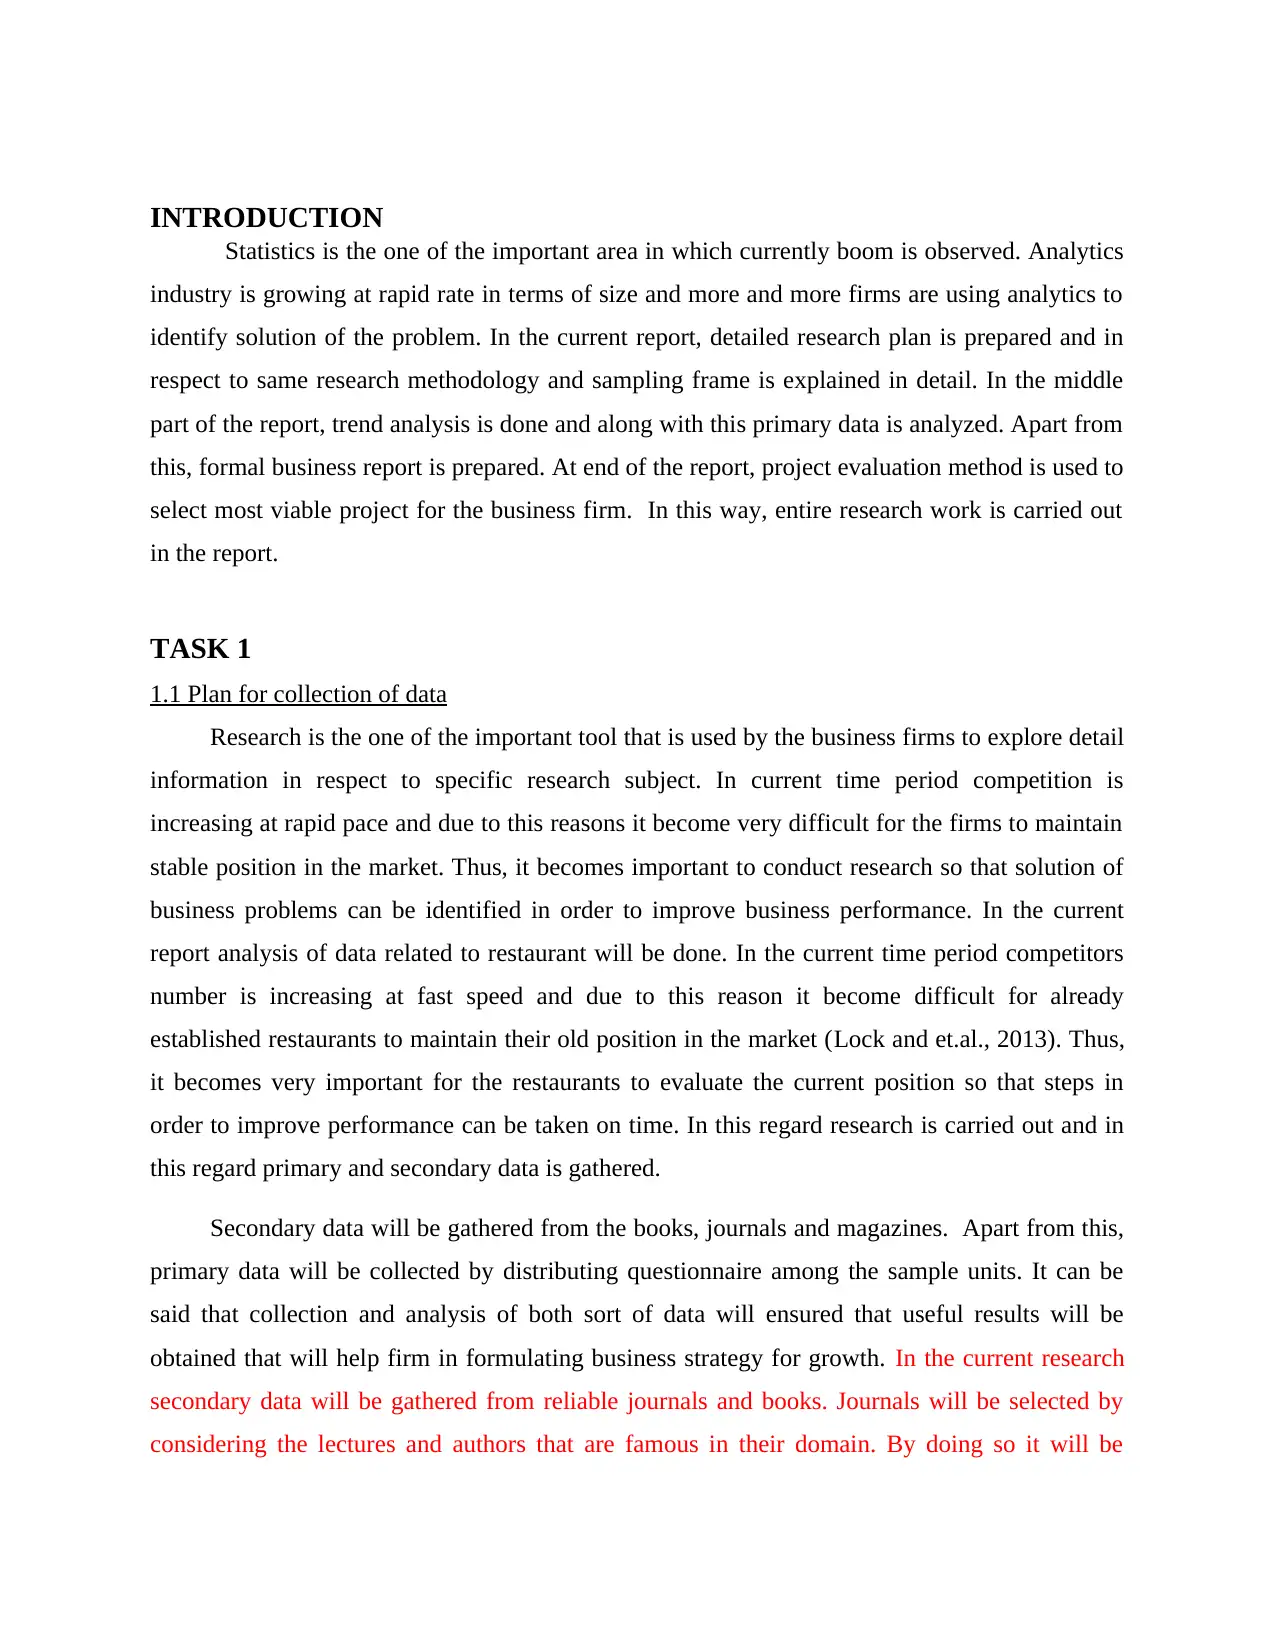
INTRODUCTION
Statistics is the one of the important area in which currently boom is observed. Analytics
industry is growing at rapid rate in terms of size and more and more firms are using analytics to
identify solution of the problem. In the current report, detailed research plan is prepared and in
respect to same research methodology and sampling frame is explained in detail. In the middle
part of the report, trend analysis is done and along with this primary data is analyzed. Apart from
this, formal business report is prepared. At end of the report, project evaluation method is used to
select most viable project for the business firm. In this way, entire research work is carried out
in the report.
TASK 1
1.1 Plan for collection of data
Research is the one of the important tool that is used by the business firms to explore detail
information in respect to specific research subject. In current time period competition is
increasing at rapid pace and due to this reasons it become very difficult for the firms to maintain
stable position in the market. Thus, it becomes important to conduct research so that solution of
business problems can be identified in order to improve business performance. In the current
report analysis of data related to restaurant will be done. In the current time period competitors
number is increasing at fast speed and due to this reason it become difficult for already
established restaurants to maintain their old position in the market (Lock and et.al., 2013). Thus,
it becomes very important for the restaurants to evaluate the current position so that steps in
order to improve performance can be taken on time. In this regard research is carried out and in
this regard primary and secondary data is gathered.
Secondary data will be gathered from the books, journals and magazines. Apart from this,
primary data will be collected by distributing questionnaire among the sample units. It can be
said that collection and analysis of both sort of data will ensured that useful results will be
obtained that will help firm in formulating business strategy for growth. In the current research
secondary data will be gathered from reliable journals and books. Journals will be selected by
considering the lectures and authors that are famous in their domain. By doing so it will be
Paraphrase This Document
Need a fresh take? Get an instant paraphrase of this document with our AI Paraphraser
ensured that from relevant journals data will be gathered. This data which is gathered from
Journal will be analyzed deeply and same will be source of information in present research study.
In the present research study data will be gathered from sample of 50 people will be taken
in the present research. By analysis of data results will be obtained and in this way research will
be carried out. Sample units will be taken from the population by selecting appropriate sample
units from the population.
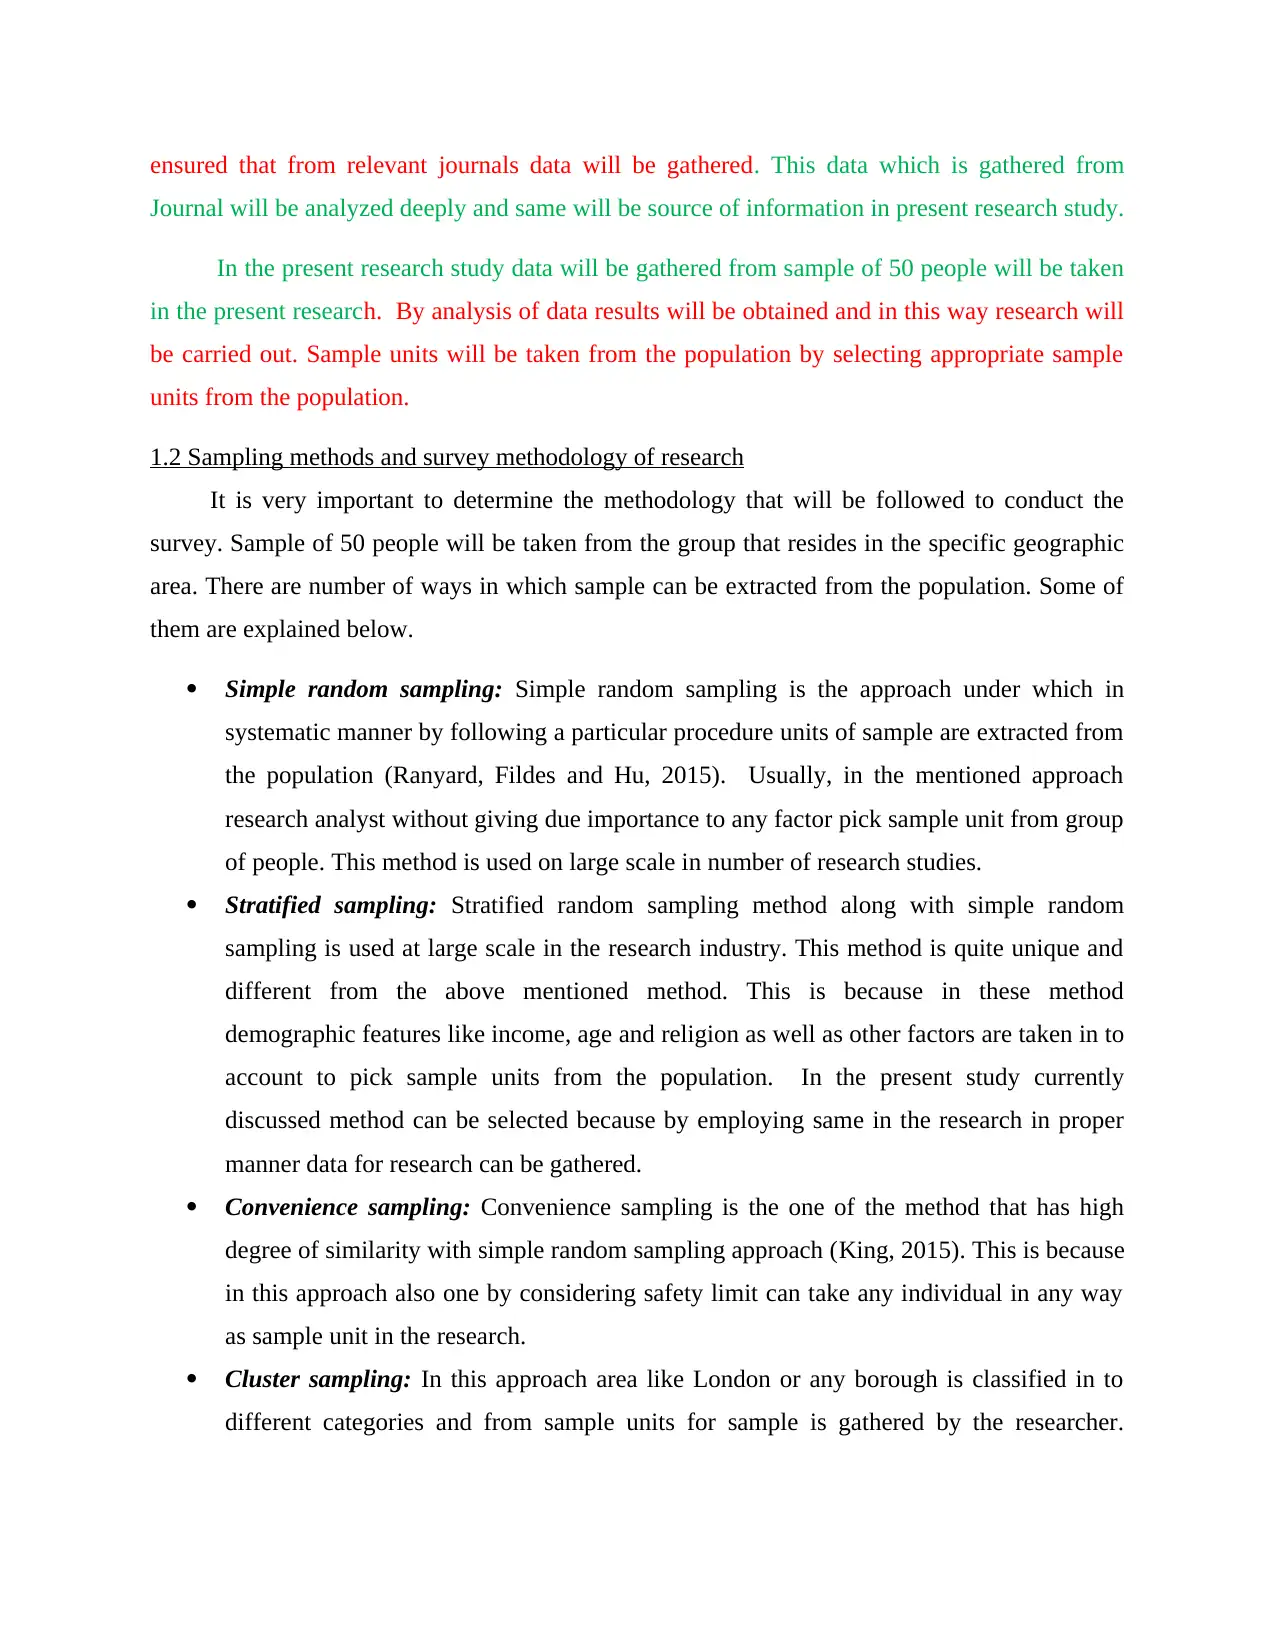
1.2 Sampling methods and survey methodology of research
It is very important to determine the methodology that will be followed to conduct the
survey. Sample of 50 people will be taken from the group that resides in the specific geographic
area. There are number of ways in which sample can be extracted from the population. Some of
them are explained below.
Simple random sampling: Simple random sampling is the approach under which in
systematic manner by following a particular procedure units of sample are extracted from
the population (Ranyard, Fildes and Hu, 2015). Usually, in the mentioned approach
research analyst without giving due importance to any factor pick sample unit from group
of people. This method is used on large scale in number of research studies.
Stratified sampling: Stratified random sampling method along with simple random
sampling is used at large scale in the research industry. This method is quite unique and
different from the above mentioned method. This is because in these method
demographic features like income, age and religion as well as other factors are taken in to
account to pick sample units from the population. In the present study currently
discussed method can be selected because by employing same in the research in proper
manner data for research can be gathered.
Convenience sampling: Convenience sampling is the one of the method that has high
degree of similarity with simple random sampling approach (King, 2015). This is because
in this approach also one by considering safety limit can take any individual in any way
as sample unit in the research.
Cluster sampling: In this approach area like London or any borough is classified in to
different categories and from sample units for sample is gathered by the researcher.
Journal will be analyzed deeply and same will be source of information in present research study.
In the present research study data will be gathered from sample of 50 people will be taken
in the present research. By analysis of data results will be obtained and in this way research will
be carried out. Sample units will be taken from the population by selecting appropriate sample
units from the population.
1.2 Sampling methods and survey methodology of research
It is very important to determine the methodology that will be followed to conduct the
survey. Sample of 50 people will be taken from the group that resides in the specific geographic
area. There are number of ways in which sample can be extracted from the population. Some of
them are explained below.
Simple random sampling: Simple random sampling is the approach under which in
systematic manner by following a particular procedure units of sample are extracted from
the population (Ranyard, Fildes and Hu, 2015). Usually, in the mentioned approach
research analyst without giving due importance to any factor pick sample unit from group
of people. This method is used on large scale in number of research studies.
Stratified sampling: Stratified random sampling method along with simple random
sampling is used at large scale in the research industry. This method is quite unique and
different from the above mentioned method. This is because in these method
demographic features like income, age and religion as well as other factors are taken in to
account to pick sample units from the population. In the present study currently
discussed method can be selected because by employing same in the research in proper
manner data for research can be gathered.
Convenience sampling: Convenience sampling is the one of the method that has high
degree of similarity with simple random sampling approach (King, 2015). This is because
in this approach also one by considering safety limit can take any individual in any way
as sample unit in the research.
Cluster sampling: In this approach area like London or any borough is classified in to
different categories and from sample units for sample is gathered by the researcher.
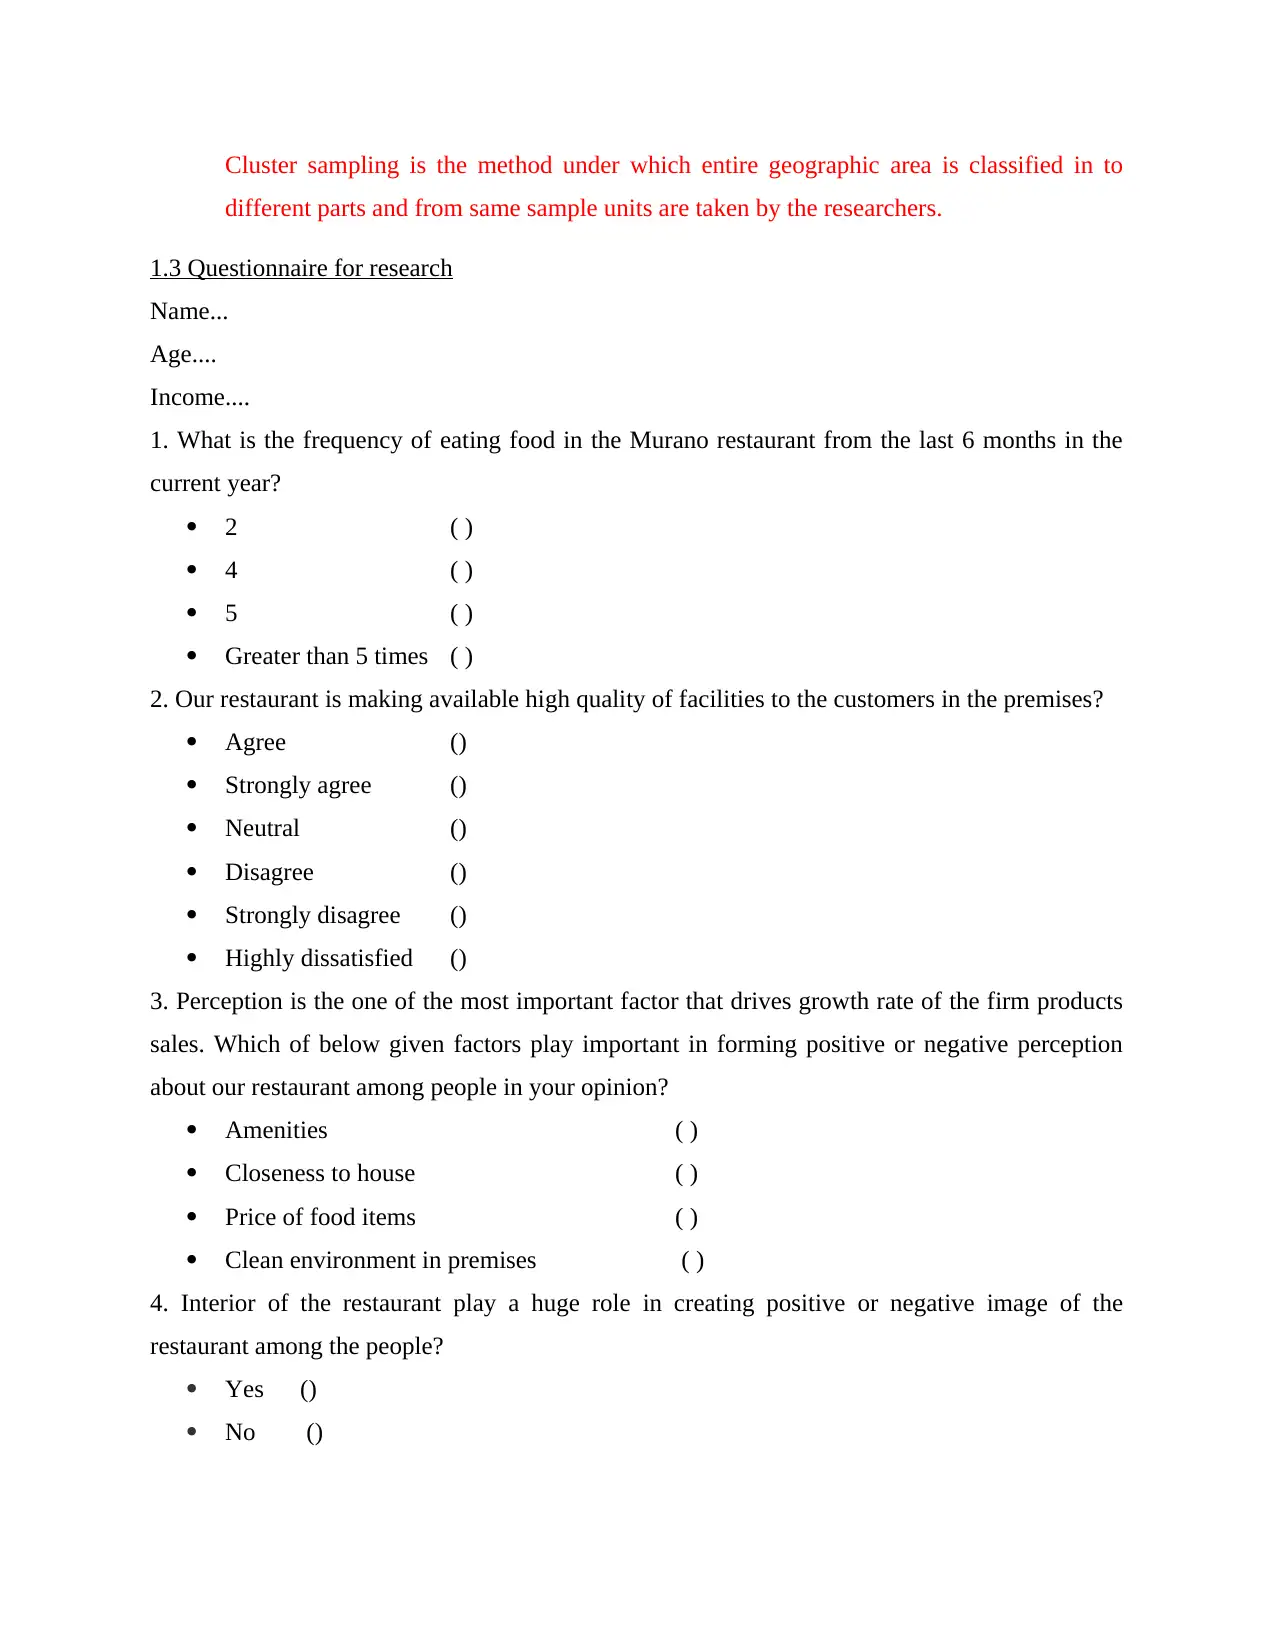
Cluster sampling is the method under which entire geographic area is classified in to
different parts and from same sample units are taken by the researchers.
1.3 Questionnaire for research
Name...
Age....
Income....
1. What is the frequency of eating food in the Murano restaurant from the last 6 months in the
current year?
2 ( )
4 ( )
5 ( )
Greater than 5 times ( )
2. Our restaurant is making available high quality of facilities to the customers in the premises?
Agree ()
Strongly agree ()
Neutral ()
Disagree ()
Strongly disagree ()
Highly dissatisfied ()
3. Perception is the one of the most important factor that drives growth rate of the firm products
sales. Which of below given factors play important in forming positive or negative perception
about our restaurant among people in your opinion?
Amenities ( )
Closeness to house ( )
Price of food items ( )
Clean environment in premises ( )
4. Interior of the restaurant play a huge role in creating positive or negative image of the
restaurant among the people?
Yes ()
No ()
⊘ This is a preview!⊘
Do you want full access?
Subscribe today to unlock all pages.
Trusted by 1+ million students worldwide
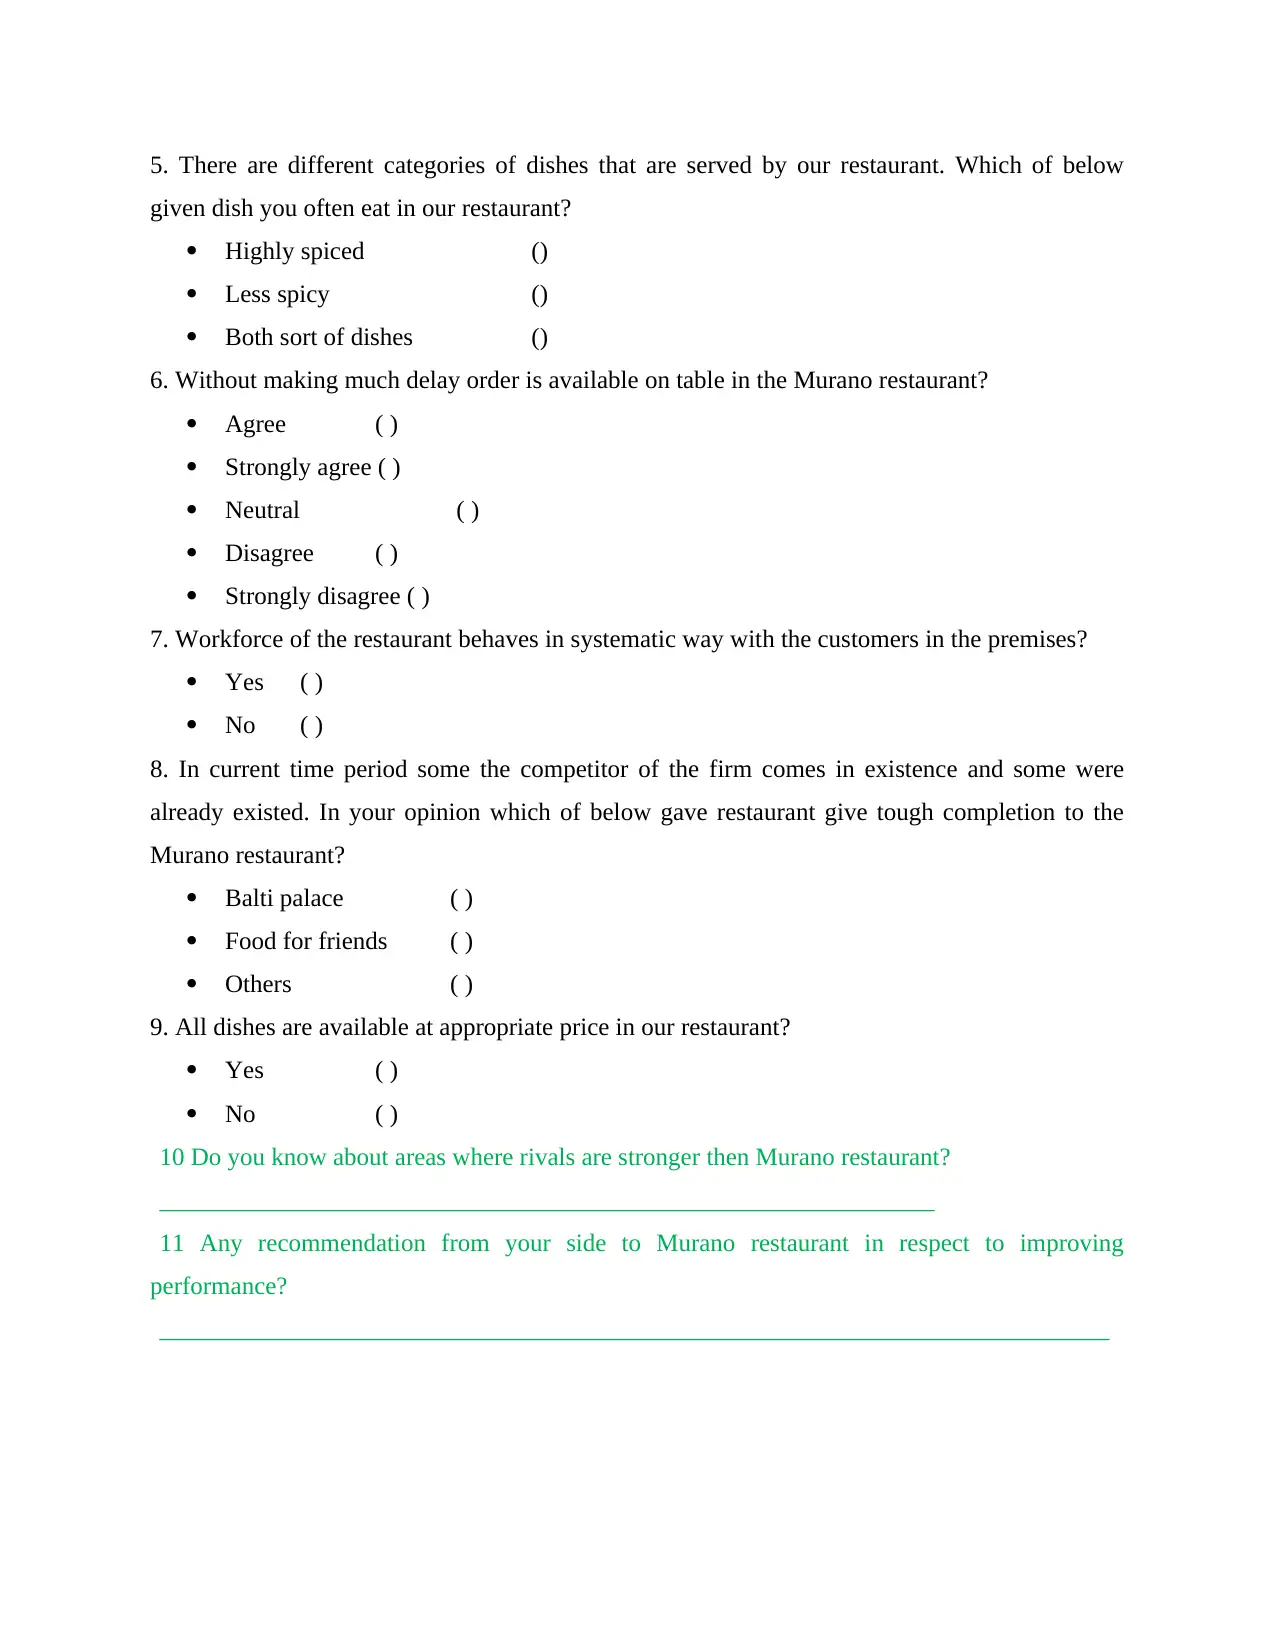
5. There are different categories of dishes that are served by our restaurant. Which of below
given dish you often eat in our restaurant?
Highly spiced ()
Less spicy ()
Both sort of dishes ()
6. Without making much delay order is available on table in the Murano restaurant?
Agree ( )
Strongly agree ( )
Neutral ( )
Disagree ( )
Strongly disagree ( )
7. Workforce of the restaurant behaves in systematic way with the customers in the premises?
Yes ( )
No ( )
8. In current time period some the competitor of the firm comes in existence and some were
already existed. In your opinion which of below gave restaurant give tough completion to the
Murano restaurant?
Balti palace ( )
Food for friends ( )
Others ( )
9. All dishes are available at appropriate price in our restaurant?
Yes ( )
No ( )
10 Do you know about areas where rivals are stronger then Murano restaurant?
______________________________________________________________
11 Any recommendation from your side to Murano restaurant in respect to improving
performance?
____________________________________________________________________________
Paraphrase This Document
Need a fresh take? Get an instant paraphrase of this document with our AI Paraphraser
TASK 2
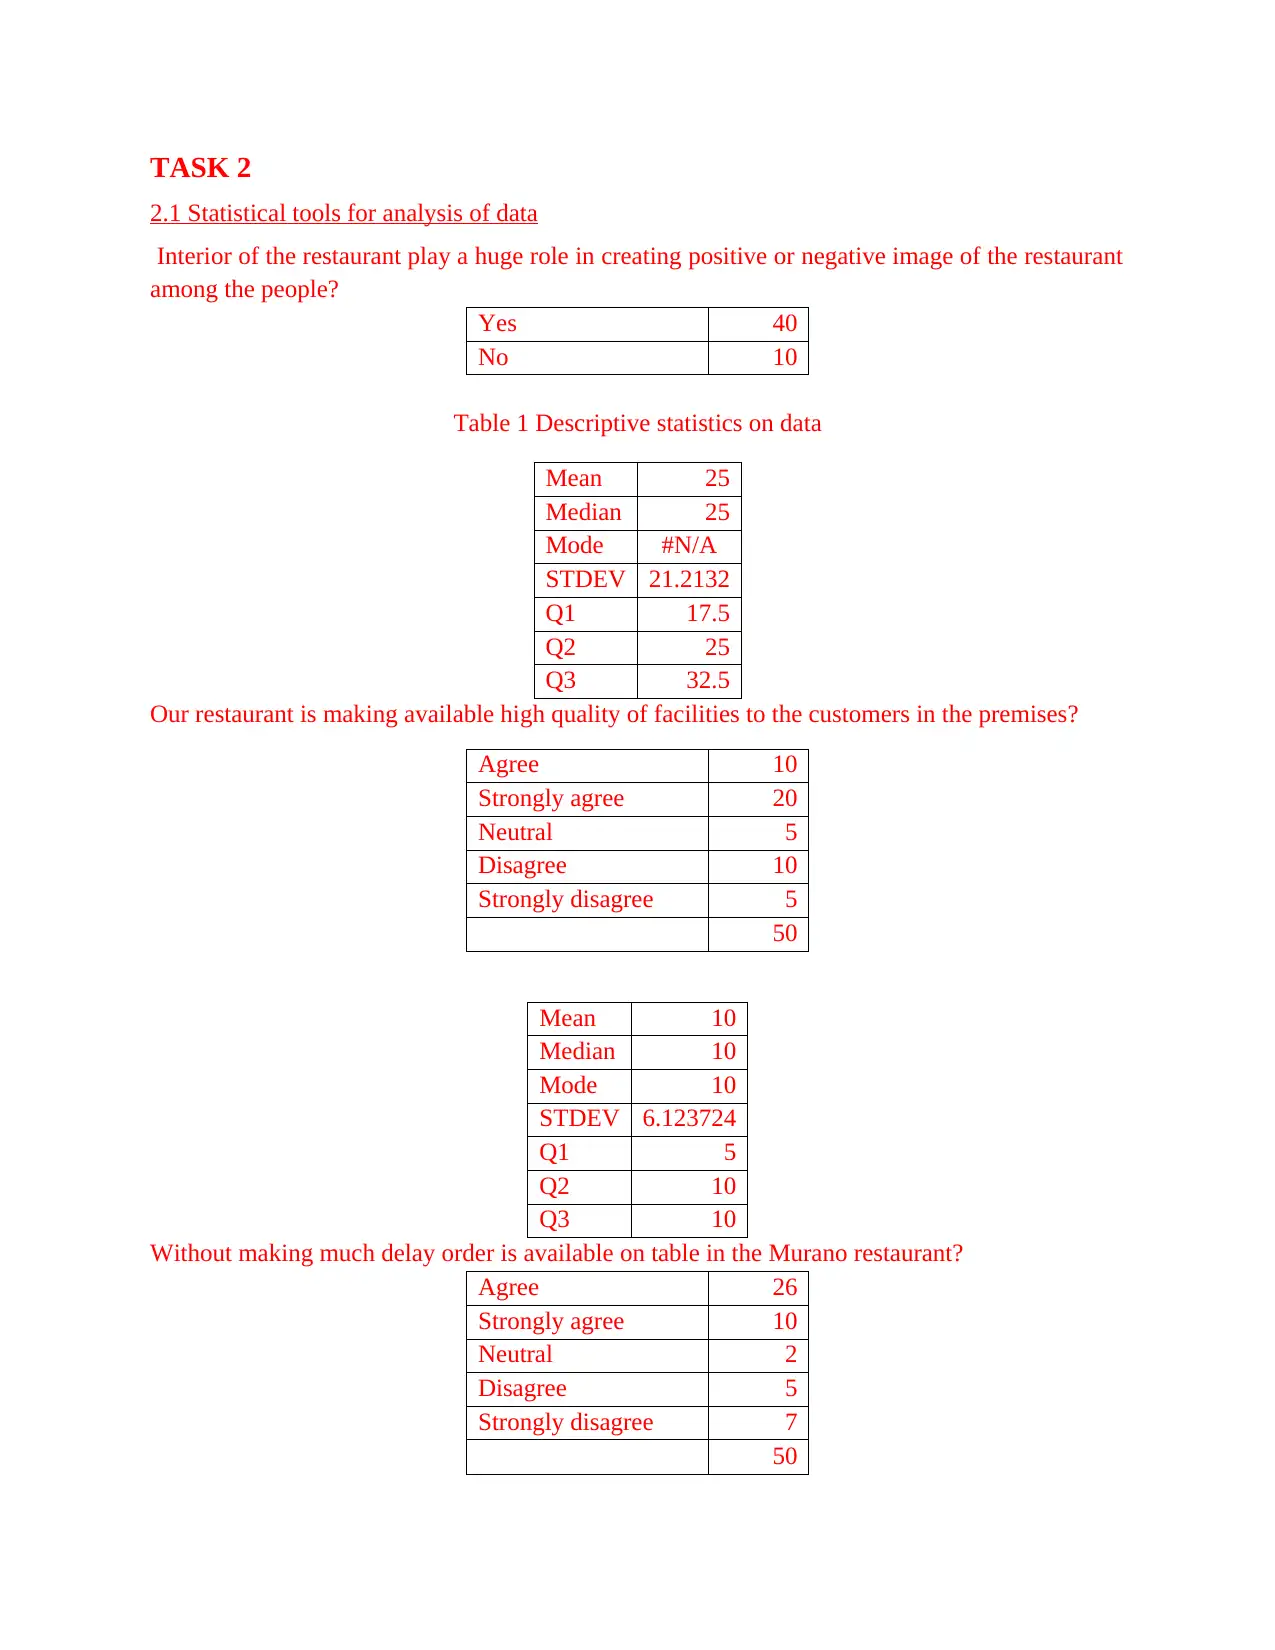
2.1 Statistical tools for analysis of data
Interior of the restaurant play a huge role in creating positive or negative image of the restaurant
among the people?
Yes 40
No 10
Table 1 Descriptive statistics on data
Mean 25
Median 25
Mode #N/A
STDEV 21.2132
Q1 17.5
Q2 25
Q3 32.5
Our restaurant is making available high quality of facilities to the customers in the premises?
Agree 10
Strongly agree 20
Neutral 5
Disagree 10
Strongly disagree 5
50
Mean 10
Median 10
Mode 10
STDEV 6.123724
Q1 5
Q2 10
Q3 10
Without making much delay order is available on table in the Murano restaurant?
Agree 26
Strongly agree 10
Neutral 2
Disagree 5
Strongly disagree 7
50
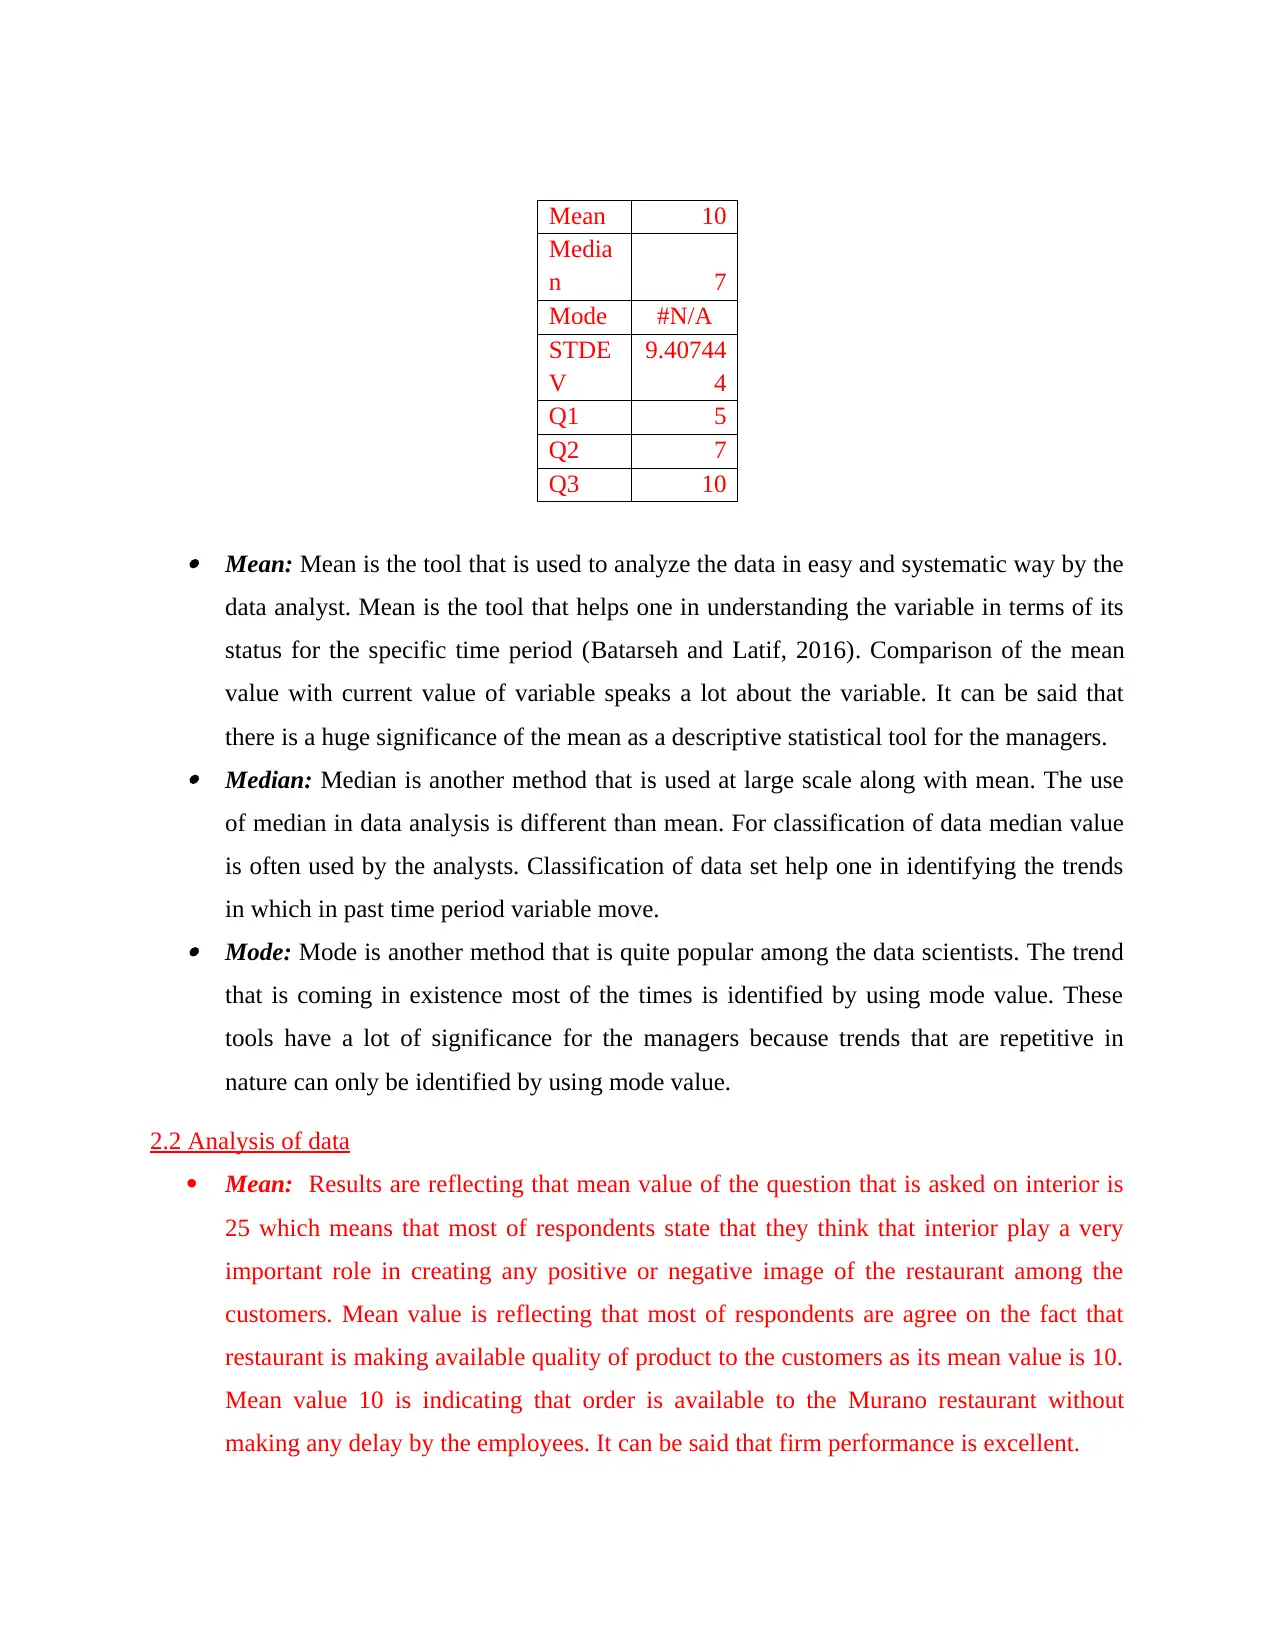
Mean 10
Media
n 7
Mode #N/A
STDE
V
9.40744
4
Q1 5
Q2 7
Q3 10
Mean: Mean is the tool that is used to analyze the data in easy and systematic way by the
data analyst. Mean is the tool that helps one in understanding the variable in terms of its
status for the specific time period (Batarseh and Latif, 2016). Comparison of the mean
value with current value of variable speaks a lot about the variable. It can be said that
there is a huge significance of the mean as a descriptive statistical tool for the managers. Median: Median is another method that is used at large scale along with mean. The use
of median in data analysis is different than mean. For classification of data median value
is often used by the analysts. Classification of data set help one in identifying the trends
in which in past time period variable move. Mode: Mode is another method that is quite popular among the data scientists. The trend
that is coming in existence most of the times is identified by using mode value. These
tools have a lot of significance for the managers because trends that are repetitive in
nature can only be identified by using mode value.
2.2 Analysis of data
Mean: Results are reflecting that mean value of the question that is asked on interior is
25 which means that most of respondents state that they think that interior play a very
important role in creating any positive or negative image of the restaurant among the
customers. Mean value is reflecting that most of respondents are agree on the fact that
restaurant is making available quality of product to the customers as its mean value is 10.
Mean value 10 is indicating that order is available to the Murano restaurant without
making any delay by the employees. It can be said that firm performance is excellent.
⊘ This is a preview!⊘
Do you want full access?
Subscribe today to unlock all pages.
Trusted by 1+ million students worldwide
Median: Median value is 25 in case of the question that is asked about the interior. This
means that it is the value that is separating data in to multiple parts. On other hand, in
case of quality of facilities median value is 10 and same for the delay in order variable
median value is 7. This is reflecting majority of respondents are agree on the fact that
firm is providing excellent quality of service to the customers.
Mode: There is value of mode and due to this reason it is concluded majority of
respondents think that restaurant is making available quality of product to the customers
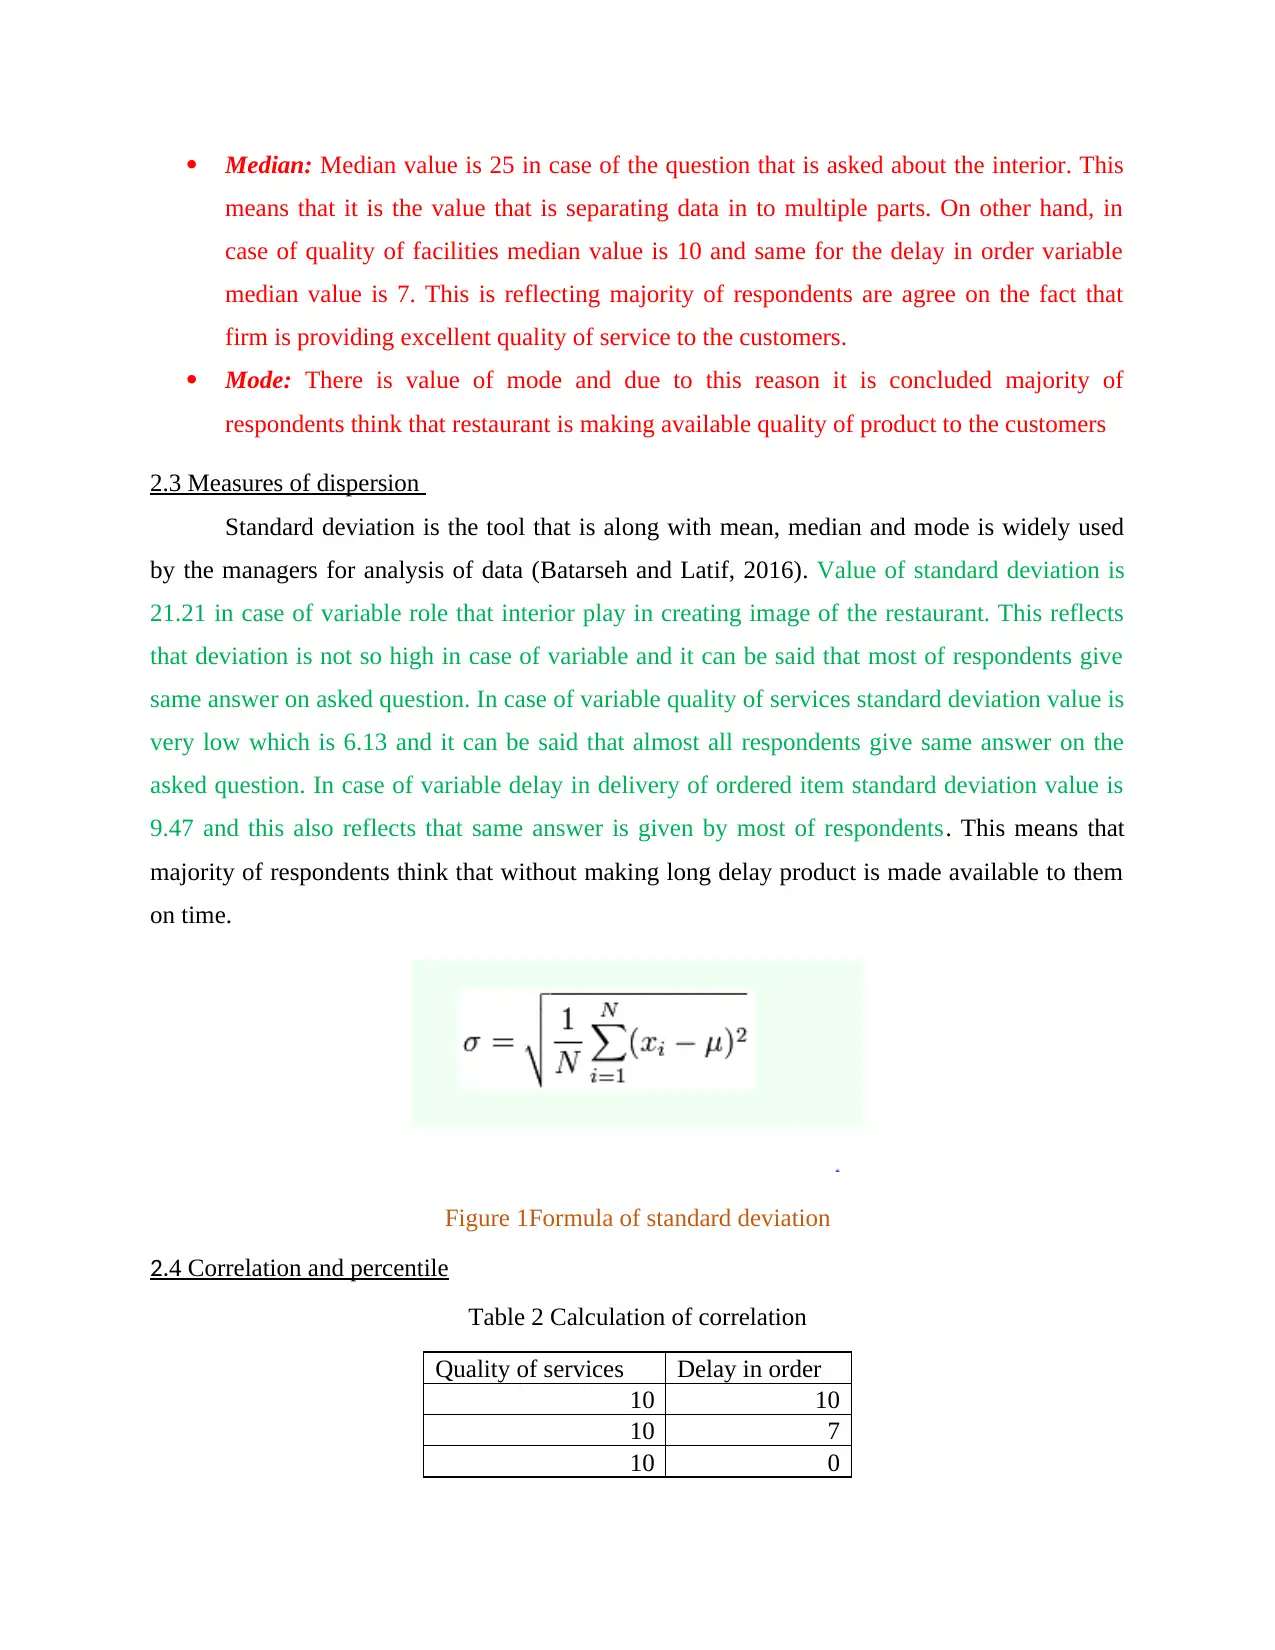
2.3 Measures of dispersion
Standard deviation is the tool that is along with mean, median and mode is widely used
by the managers for analysis of data (Batarseh and Latif, 2016). Value of standard deviation is
21.21 in case of variable role that interior play in creating image of the restaurant. This reflects
that deviation is not so high in case of variable and it can be said that most of respondents give
same answer on asked question. In case of variable quality of services standard deviation value is
very low which is 6.13 and it can be said that almost all respondents give same answer on the
asked question. In case of variable delay in delivery of ordered item standard deviation value is
9.47 and this also reflects that same answer is given by most of respondents. This means that
majority of respondents think that without making long delay product is made available to them
on time.
Figure 1Formula of standard deviation
2.4 Correlation and percentile
Table 2 Calculation of correlation
Quality of services Delay in order
10 10
10 7
10 0
means that it is the value that is separating data in to multiple parts. On other hand, in
case of quality of facilities median value is 10 and same for the delay in order variable
median value is 7. This is reflecting majority of respondents are agree on the fact that
firm is providing excellent quality of service to the customers.
Mode: There is value of mode and due to this reason it is concluded majority of
respondents think that restaurant is making available quality of product to the customers
2.3 Measures of dispersion
Standard deviation is the tool that is along with mean, median and mode is widely used
by the managers for analysis of data (Batarseh and Latif, 2016). Value of standard deviation is
21.21 in case of variable role that interior play in creating image of the restaurant. This reflects
that deviation is not so high in case of variable and it can be said that most of respondents give
same answer on asked question. In case of variable quality of services standard deviation value is
very low which is 6.13 and it can be said that almost all respondents give same answer on the
asked question. In case of variable delay in delivery of ordered item standard deviation value is
9.47 and this also reflects that same answer is given by most of respondents. This means that
majority of respondents think that without making long delay product is made available to them
on time.
Figure 1Formula of standard deviation
2.4 Correlation and percentile
Table 2 Calculation of correlation
Quality of services Delay in order
10 10
10 7
10 0
Paraphrase This Document
Need a fresh take? Get an instant paraphrase of this document with our AI Paraphraser
6.123724357 9.407443861
5 5
10 7
10 10
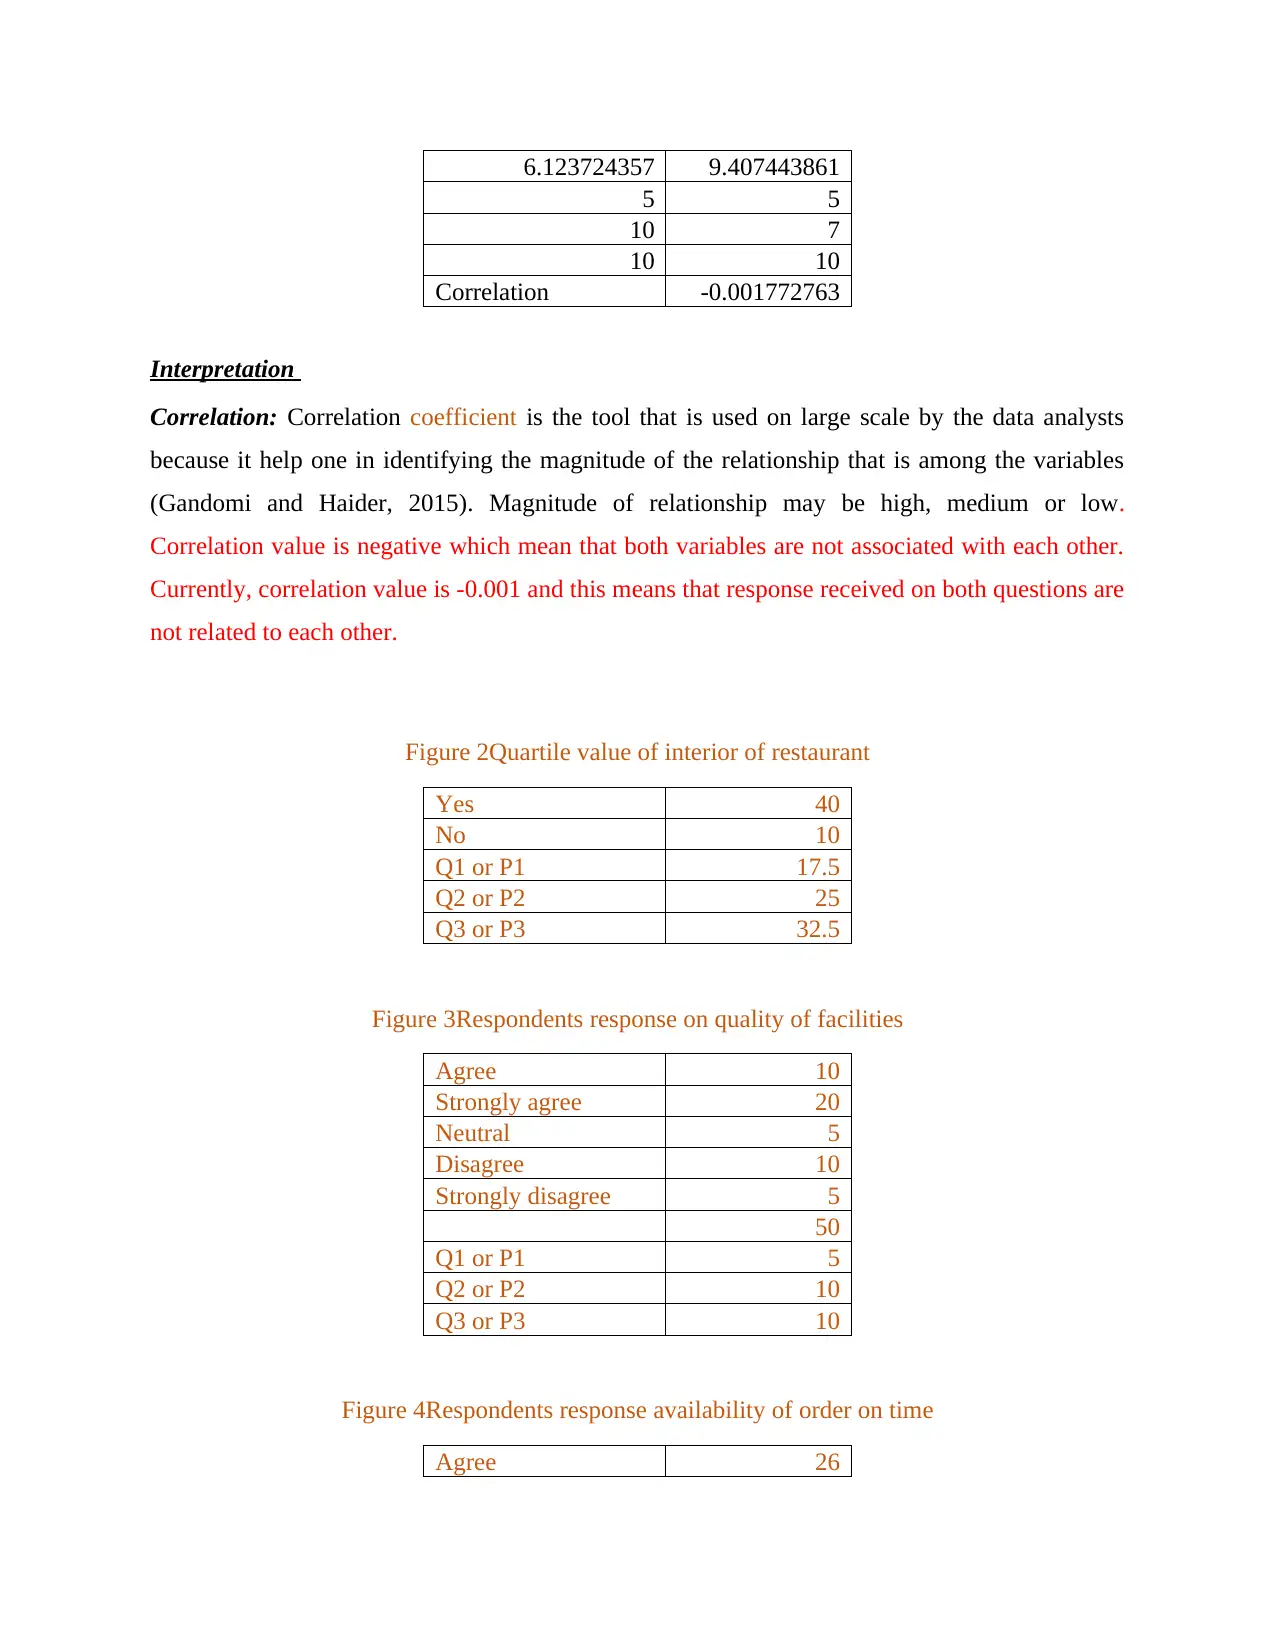
Correlation -0.001772763
Interpretation
Correlation: Correlation coefficient is the tool that is used on large scale by the data analysts
because it help one in identifying the magnitude of the relationship that is among the variables
(Gandomi and Haider, 2015). Magnitude of relationship may be high, medium or low.
Correlation value is negative which mean that both variables are not associated with each other.
Currently, correlation value is -0.001 and this means that response received on both questions are
not related to each other.
Figure 2Quartile value of interior of restaurant
Yes 40
No 10
Q1 or P1 17.5
Q2 or P2 25
Q3 or P3 32.5
Figure 3Respondents response on quality of facilities
Agree 10
Strongly agree 20
Neutral 5
Disagree 10
Strongly disagree 5
50
Q1 or P1 5
Q2 or P2 10
Q3 or P3 10
Figure 4Respondents response availability of order on time
Agree 26
5 5
10 7
10 10
Correlation -0.001772763
Interpretation
Correlation: Correlation coefficient is the tool that is used on large scale by the data analysts
because it help one in identifying the magnitude of the relationship that is among the variables
(Gandomi and Haider, 2015). Magnitude of relationship may be high, medium or low.
Correlation value is negative which mean that both variables are not associated with each other.
Currently, correlation value is -0.001 and this means that response received on both questions are
not related to each other.
Figure 2Quartile value of interior of restaurant
Yes 40
No 10
Q1 or P1 17.5
Q2 or P2 25
Q3 or P3 32.5
Figure 3Respondents response on quality of facilities
Agree 10
Strongly agree 20
Neutral 5
Disagree 10
Strongly disagree 5
50
Q1 or P1 5
Q2 or P2 10
Q3 or P3 10
Figure 4Respondents response availability of order on time
Agree 26
Strongly agree 10
Neutral 2
Disagree 5
Strongly disagree 7
50
Q1 or P1 5
Q2 or P2 7
Q3 or P3 10
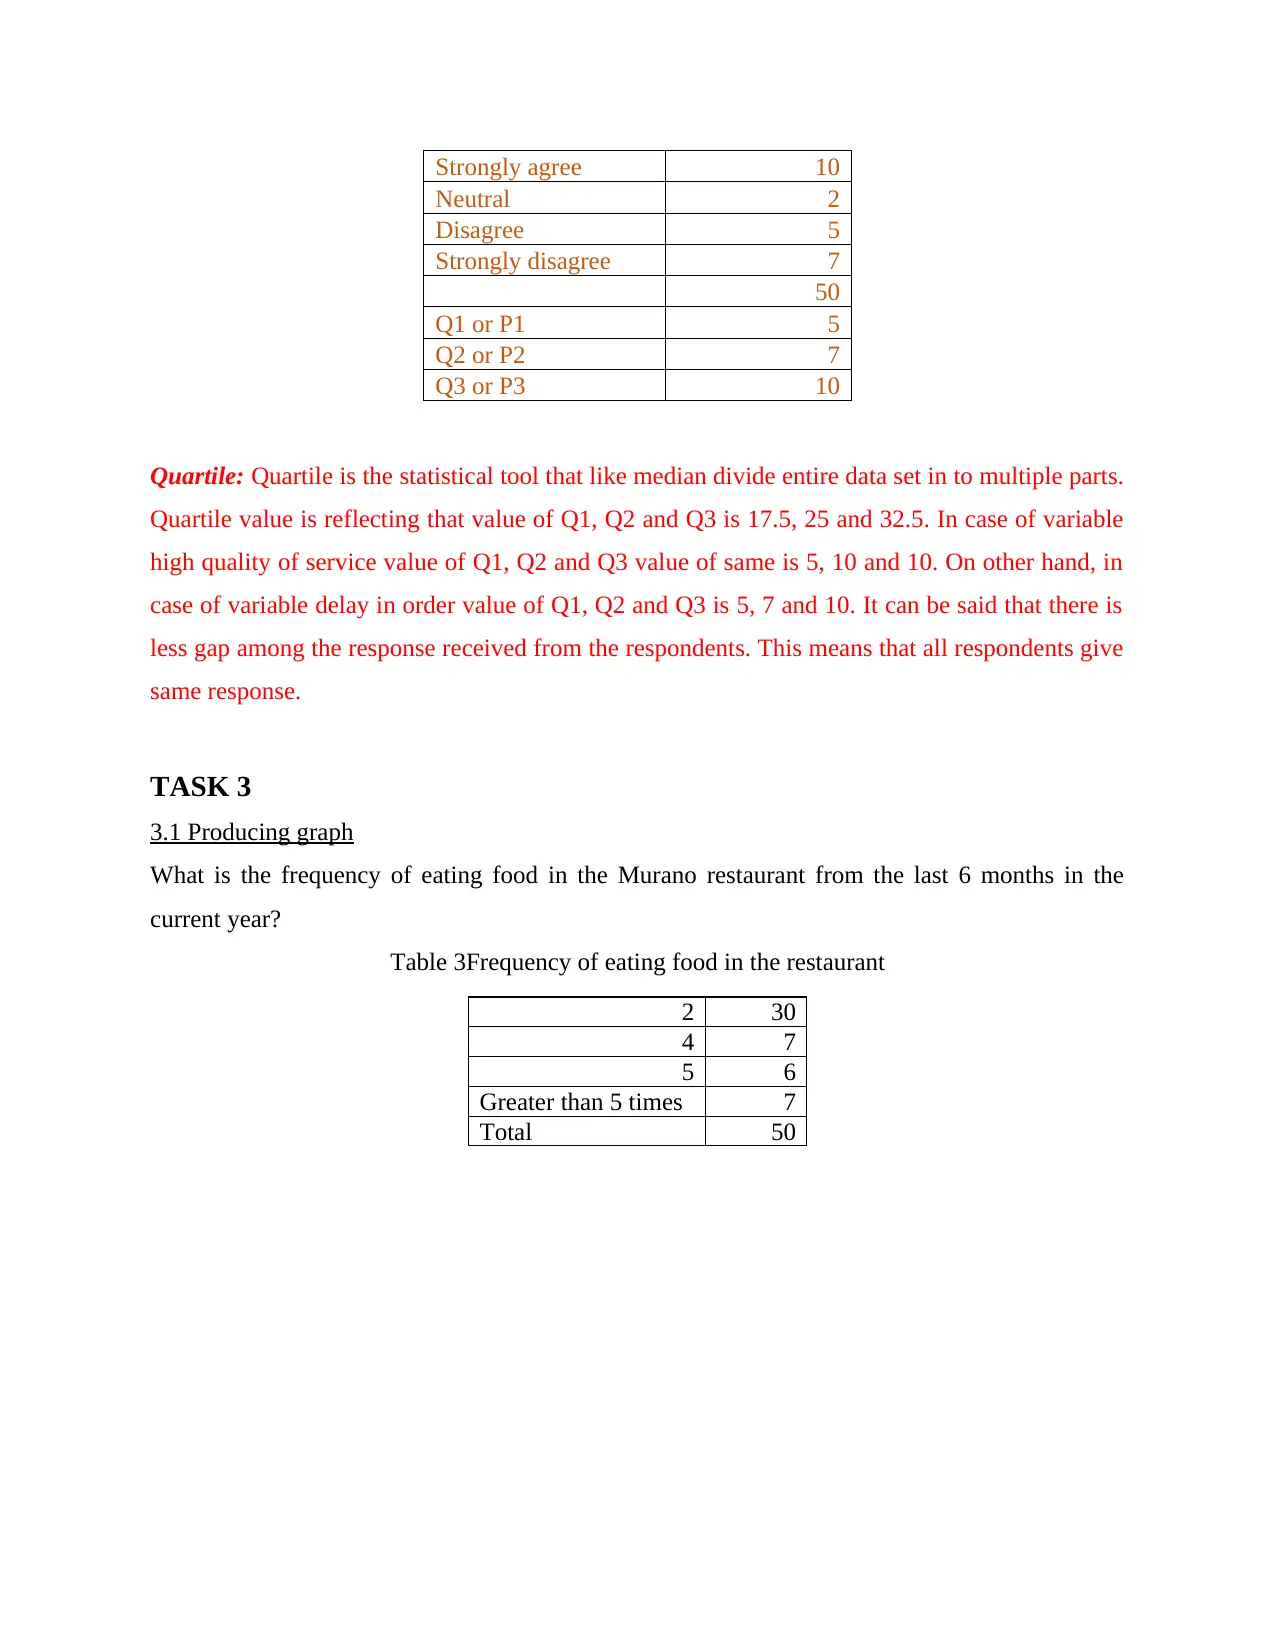
Quartile: Quartile is the statistical tool that like median divide entire data set in to multiple parts.
Quartile value is reflecting that value of Q1, Q2 and Q3 is 17.5, 25 and 32.5. In case of variable
high quality of service value of Q1, Q2 and Q3 value of same is 5, 10 and 10. On other hand, in
case of variable delay in order value of Q1, Q2 and Q3 is 5, 7 and 10. It can be said that there is
less gap among the response received from the respondents. This means that all respondents give
same response.
TASK 3
3.1 Producing graph
What is the frequency of eating food in the Murano restaurant from the last 6 months in the
current year?
Table 3Frequency of eating food in the restaurant
2 30
4 7
5 6
Greater than 5 times 7
Total 50
Neutral 2
Disagree 5
Strongly disagree 7
50
Q1 or P1 5
Q2 or P2 7
Q3 or P3 10
Quartile: Quartile is the statistical tool that like median divide entire data set in to multiple parts.
Quartile value is reflecting that value of Q1, Q2 and Q3 is 17.5, 25 and 32.5. In case of variable
high quality of service value of Q1, Q2 and Q3 value of same is 5, 10 and 10. On other hand, in
case of variable delay in order value of Q1, Q2 and Q3 is 5, 7 and 10. It can be said that there is
less gap among the response received from the respondents. This means that all respondents give
same response.
TASK 3
3.1 Producing graph
What is the frequency of eating food in the Murano restaurant from the last 6 months in the
current year?
Table 3Frequency of eating food in the restaurant
2 30
4 7
5 6
Greater than 5 times 7
Total 50
⊘ This is a preview!⊘
Do you want full access?
Subscribe today to unlock all pages.
Trusted by 1+ million students worldwide
1 out of 22
Related Documents


Your All-in-One AI-Powered Toolkit for Academic Success.
+13062052269
info@desklib.com
Available 24*7 on WhatsApp / Email
![[object Object]](/_next/static/media/star-bottom.7253800d.svg)
Unlock your academic potential
Copyright © 2020–2026 A2Z Services. All Rights Reserved. Developed and managed by ZUCOL.