Business Decision Making Report: Data Interpretation and Analysis
VerifiedAdded on 2020/01/21
|20
|4335
|88
Report
AI Summary
This report delves into the realm of business decision-making, employing a range of statistical tools and analytical techniques to assess firm performance and guide strategic choices. The report commences with a detailed plan for collecting both primary and secondary data, outlining survey methodologies, sampling frames, and the structure of questionnaires. It then proceeds to analyze data using statistical measures such as mean, median, mode, standard deviation, and correlation, interpreting the results to provide insights into sales trends and business performance. The report further incorporates graphical representations of primary data, trend analysis, and project evaluation techniques, including payback period, ARR, net present value, and IRR calculations, to facilitate informed decision-making. Ultimately, the report aims to provide a comprehensive overview of the application of data analysis and statistical tools in business decision-making, offering valuable insights for strategic planning and operational improvements.

BUSINESS DECISION
MAKING
MAKING
Paraphrase This Document
Need a fresh take? Get an instant paraphrase of this document with our AI Paraphraser
TABLE OF CONTENTS
INTRODUCTION...........................................................................................................................3
TASK 1............................................................................................................................................3
1.1 Plan for collection of primary data and secondary data........................................................3
1.2 Survey methodology and sampling frame.............................................................................3
1.3 Questionnaire for research....................................................................................................4
TASK 2............................................................................................................................................6
2.1 Information for decision making...........................................................................................6
2.2 Interpretation of results of statistical tools............................................................................7
2.3 Analysis of measure of dispersion........................................................................................8
2.4 Calculation of quartile, percentile and correlation................................................................8
TASK 3............................................................................................................................................9
3.1 Graphical representation of primary data..............................................................................9
3.2 Trend analysis chart............................................................................................................11
3.3 Covered in PPT...................................................................................................................12
3.4 Formal business report........................................................................................................12
TASK 4..........................................................................................................................................12
4.1 Information processing tools that are used in the business.................................................12
4.2 Network diagram.................................................................................................................13
4.3 Project evaluation technique...............................................................................................15
CONCLUSION..............................................................................................................................17
REFERENCES..............................................................................................................................18
INDEX OF TABLES
Table 1: Calculation of mean, median and mode............................................................................7
Table 2: Percentage change in value of variable.............................................................................8
Table 3: Calculation of standard deviation......................................................................................9
Table 4: Calculation of correlation..................................................................................................9
Table 5: Calculation of quartile and percentile.............................................................................10
Table 6: Table of activities............................................................................................................14
Table 7: Calculation of payback period method............................................................................17
Table 8: Calculation of ARR.........................................................................................................17
Table 9: Calculation of net present value......................................................................................18
Table 10: Calculation of IRR.........................................................................................................18
ILLUSTRATION INDEX
Illustration 1: People opinion on hike in price and its impact on their visits in restaurant............11
Illustration 2: People preference on different type of restaurants..................................................12
Illustration 3: Trend analysis for Aqua food..................................................................................12
Illustration 4: GANTT chart..........................................................................................................15
Illustration 5: Network diagram.....................................................................................................15
⊘ This is a preview!⊘
Do you want full access?
Subscribe today to unlock all pages.
Trusted by 1+ million students worldwide
INTRODUCTION
In today era, business condition's are very complex and it is very difficult to take
decisions. Managers are using facts and figures to analyses firm performance and to make sound
business decisions. In this regard they use statistical tools and in this report some of these tools
are applied on firm cash flows. In this report mean, median, mode, standard deviation and
correlation are applied on sales figures in order to analyze same from different sides. In the
middle part of report charting of collected primary data is done and their results are interpreted.
At end of the report, project evaluation techniques are applied and best project is selected for the
firm.
TASK 1
1.1 Plan for collection of primary data and secondary data
In order to conduct research it is necessary to collect primary and secondary data.
Primary data refers to the facts and figures that are never published in any reading materiel and
collected for the first time by the research through field work. Secondary data is a set of facts and
figures that were already published in any publication and collected by other person. It is
necessary to collect both type of data because both helps researcher in conducting research in
better (Silverman, 2010). Before conducting a research it is imperative to determine a direction
in which research must be carried out. For this researcher needs to understand past and current
scenario related to the research topic. If one will collect information related to past then he will
comprehend past condition's related to the research topic and will come to know about the past
trends. By comparing past trends with current situation researcher easily identify the direction in
which he must conduct research. In order to conduct this research secondary data will be
collected from books, journals and magazines etc (Kazdin, 2011). For collecting primary data
questionnaire will be distributed among 60 respondents that resides in different areas of London
and are different from each other on the basis of demographic features.
1.2 Survey methodology and sampling frame
In order to do this research data will be collected by using specific survey methodology
method. There are various methods of sampling and some of them are as follows:- Simple random sampling- This is a specific sampling method and under this all sample
unit are taken from the population on random basis. This sampling method is employed
Paraphrase This Document
Need a fresh take? Get an instant paraphrase of this document with our AI Paraphraser
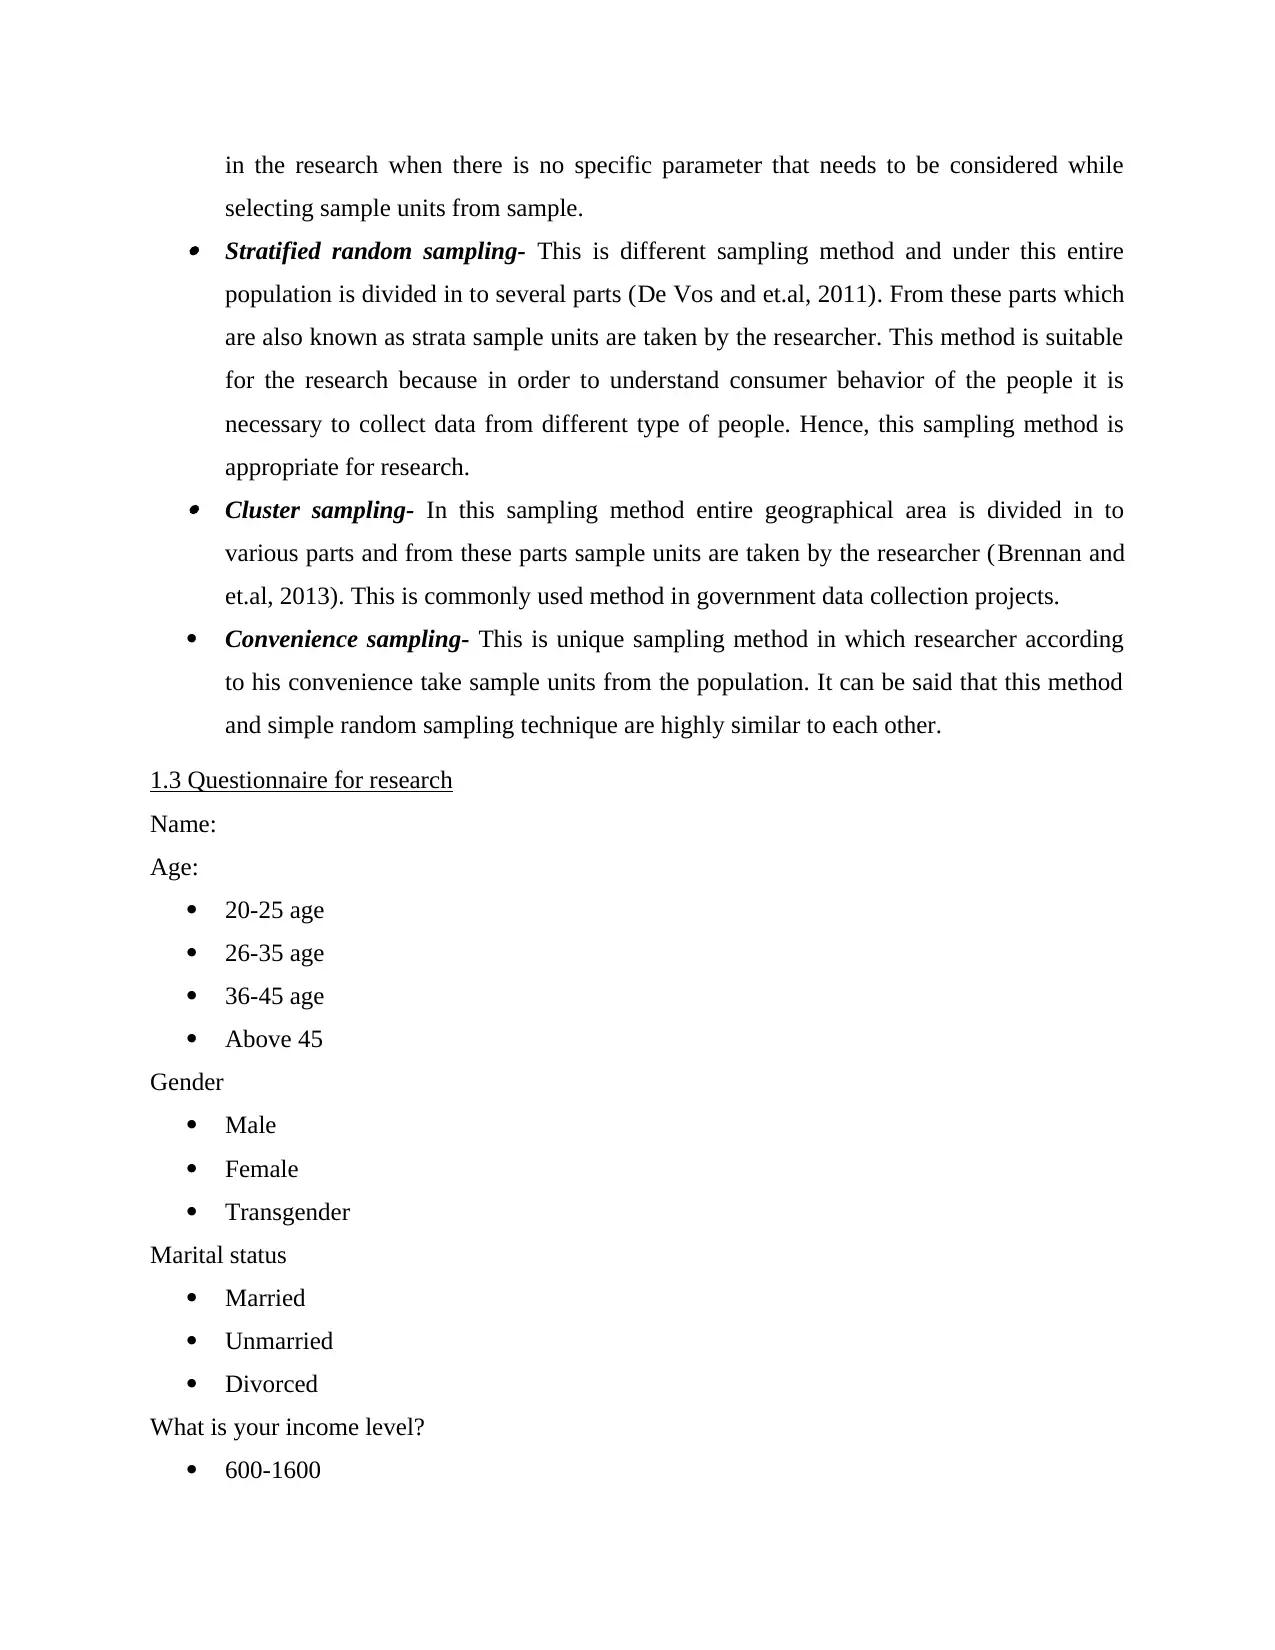
in the research when there is no specific parameter that needs to be considered while
selecting sample units from sample. Stratified random sampling- This is different sampling method and under this entire
population is divided in to several parts (De Vos and et.al, 2011). From these parts which
are also known as strata sample units are taken by the researcher. This method is suitable
for the research because in order to understand consumer behavior of the people it is
necessary to collect data from different type of people. Hence, this sampling method is
appropriate for research. Cluster sampling- In this sampling method entire geographical area is divided in to
various parts and from these parts sample units are taken by the researcher (Brennan and
et.al, 2013). This is commonly used method in government data collection projects.
Convenience sampling- This is unique sampling method in which researcher according
to his convenience take sample units from the population. It can be said that this method
and simple random sampling technique are highly similar to each other.
1.3 Questionnaire for research
Name:
Age:
20-25 age
26-35 age
36-45 age
Above 45
Gender
Male
Female
Transgender
Marital status
Married
Unmarried
Divorced
What is your income level?
600-1600
1700-2800
2900-3500
3600- 4000
Which of below given factors you think play decisive role in your purchase decision in the
restaurant?
Quality
Price
Both
Do you agree with the fact that there is high relationship between income level and people
pricing preference.
Strongly agree
Agree
Somewhat agree
Disagree
Strongly disagree
How many times do you visit Aqua food restaurant in a year?
5-10times
10-20 times
20-25 times
More than 25 times
If Aqua food restaurant hike its edible items price then you will visit mentioned restaurant?
Strongly agree
Agree
Somewhat agree
Disagree
Strongly disagree
In which type of restaurant you usually for go for taking lunch or dinner?
Traditional
Homey
Modern
⊘ This is a preview!⊘
Do you want full access?
Subscribe today to unlock all pages.
Trusted by 1+ million students worldwide
Which kind of dining Rooms you usually prefer in restaurants?”
Formal dining
Relaxed environment
Private rooms
What sort pf below given cuisine you often prefer?
Asian
French
Indian
European
Chinese
Other
Your feedback
_______________
TASK 2
2.1 Information for decision making
Table 1: Calculation of mean, median and mode
Sales
1 50000
2 53000
3 55000
4 60000
5 65000
Mean 56600
Median 55000
Mode #VALUE! Mean- It refers to average value of the specific variable. If current value of the variable is
above mean value then it can be assumed that variable is giving good or bad
performance. Interpretation of variable performance on the basis of mean value depend
on the variable (Devore, 2015). If in case of sales current value of variable is above mean
value then it can be said that firm performance is good. But if current value of loss is
Paraphrase This Document
Need a fresh take? Get an instant paraphrase of this document with our AI Paraphraser
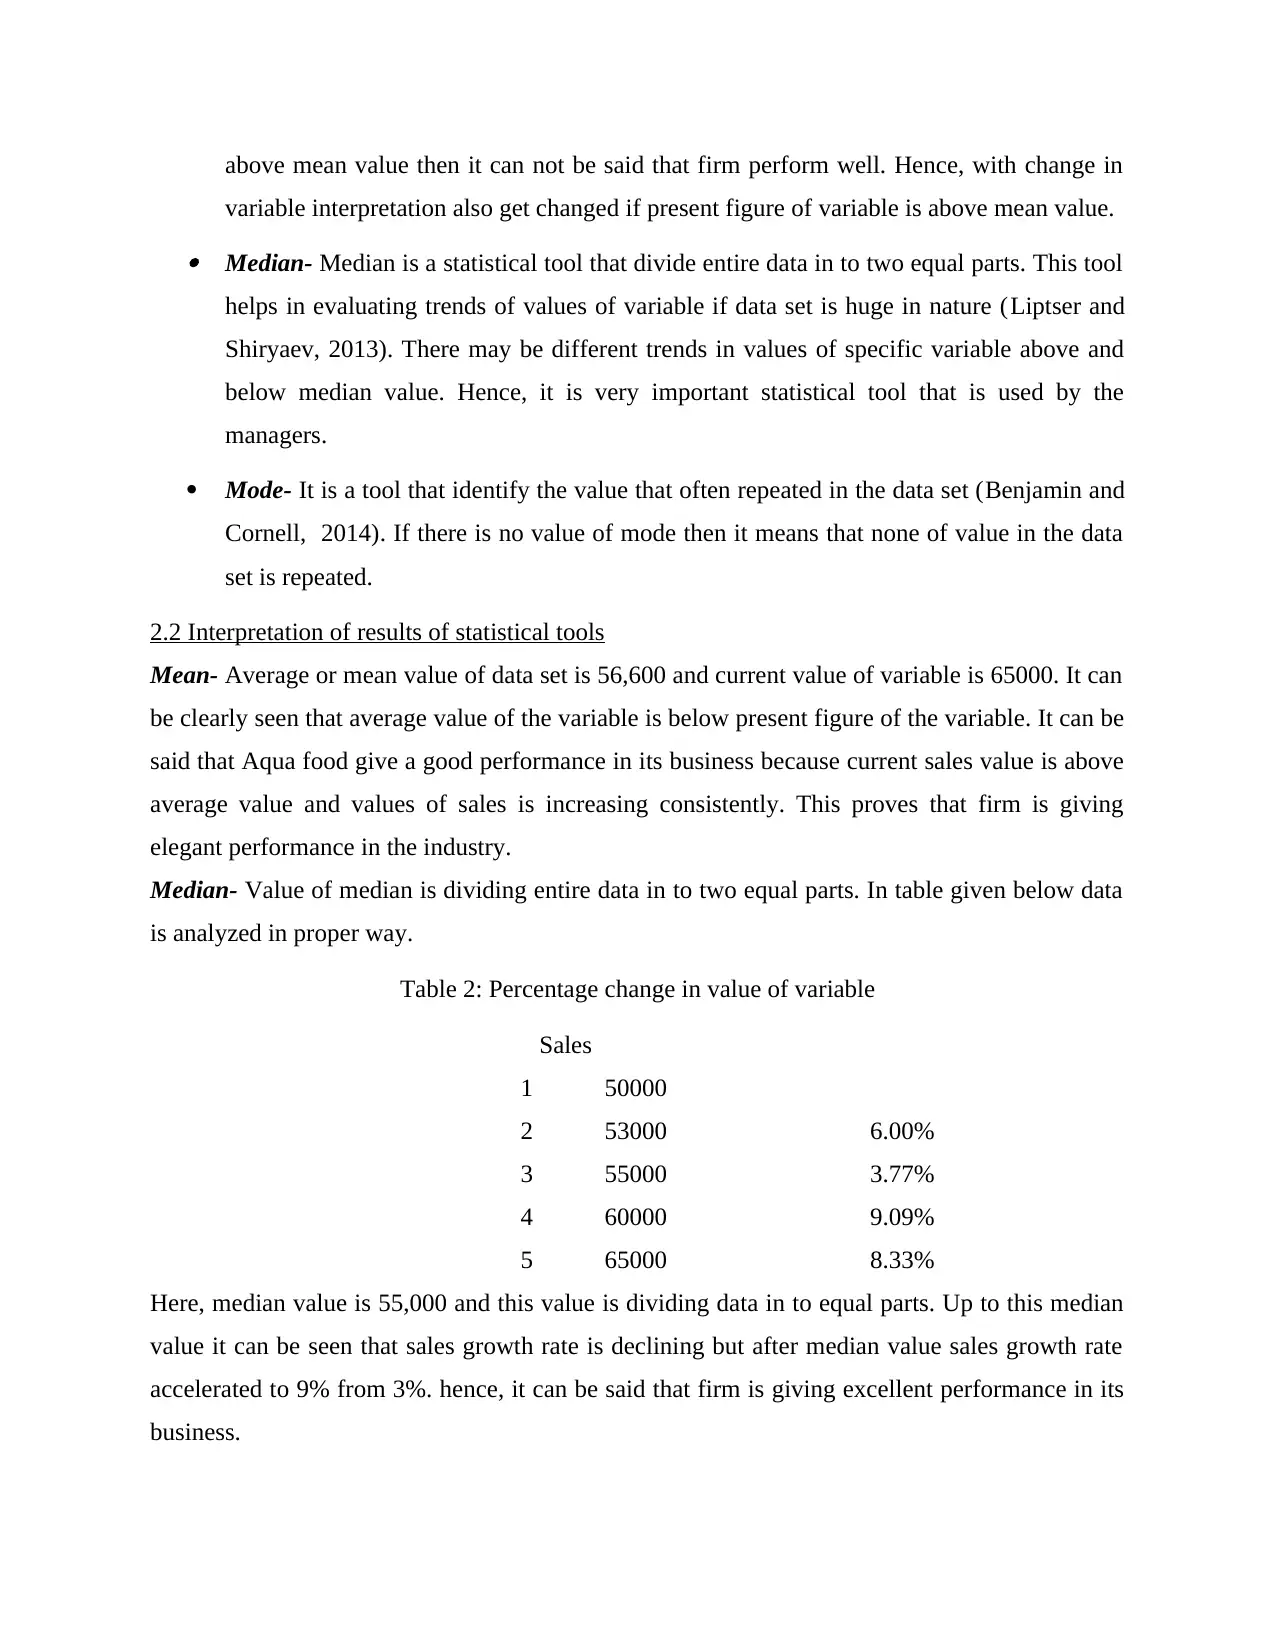
above mean value then it can not be said that firm perform well. Hence, with change in
variable interpretation also get changed if present figure of variable is above mean value. Median- Median is a statistical tool that divide entire data in to two equal parts. This tool
helps in evaluating trends of values of variable if data set is huge in nature (Liptser and
Shiryaev, 2013). There may be different trends in values of specific variable above and
below median value. Hence, it is very important statistical tool that is used by the
managers.
Mode- It is a tool that identify the value that often repeated in the data set (Benjamin and
Cornell, 2014). If there is no value of mode then it means that none of value in the data
set is repeated.
2.2 Interpretation of results of statistical tools
Mean- Average or mean value of data set is 56,600 and current value of variable is 65000. It can
be clearly seen that average value of the variable is below present figure of the variable. It can be
said that Aqua food give a good performance in its business because current sales value is above
average value and values of sales is increasing consistently. This proves that firm is giving
elegant performance in the industry.
Median- Value of median is dividing entire data in to two equal parts. In table given below data
is analyzed in proper way.
Table 2: Percentage change in value of variable
Sales
1 50000
2 53000 6.00%
3 55000 3.77%
4 60000 9.09%
5 65000 8.33%
Here, median value is 55,000 and this value is dividing data in to equal parts. Up to this median
value it can be seen that sales growth rate is declining but after median value sales growth rate
accelerated to 9% from 3%. hence, it can be said that firm is giving excellent performance in its
business.
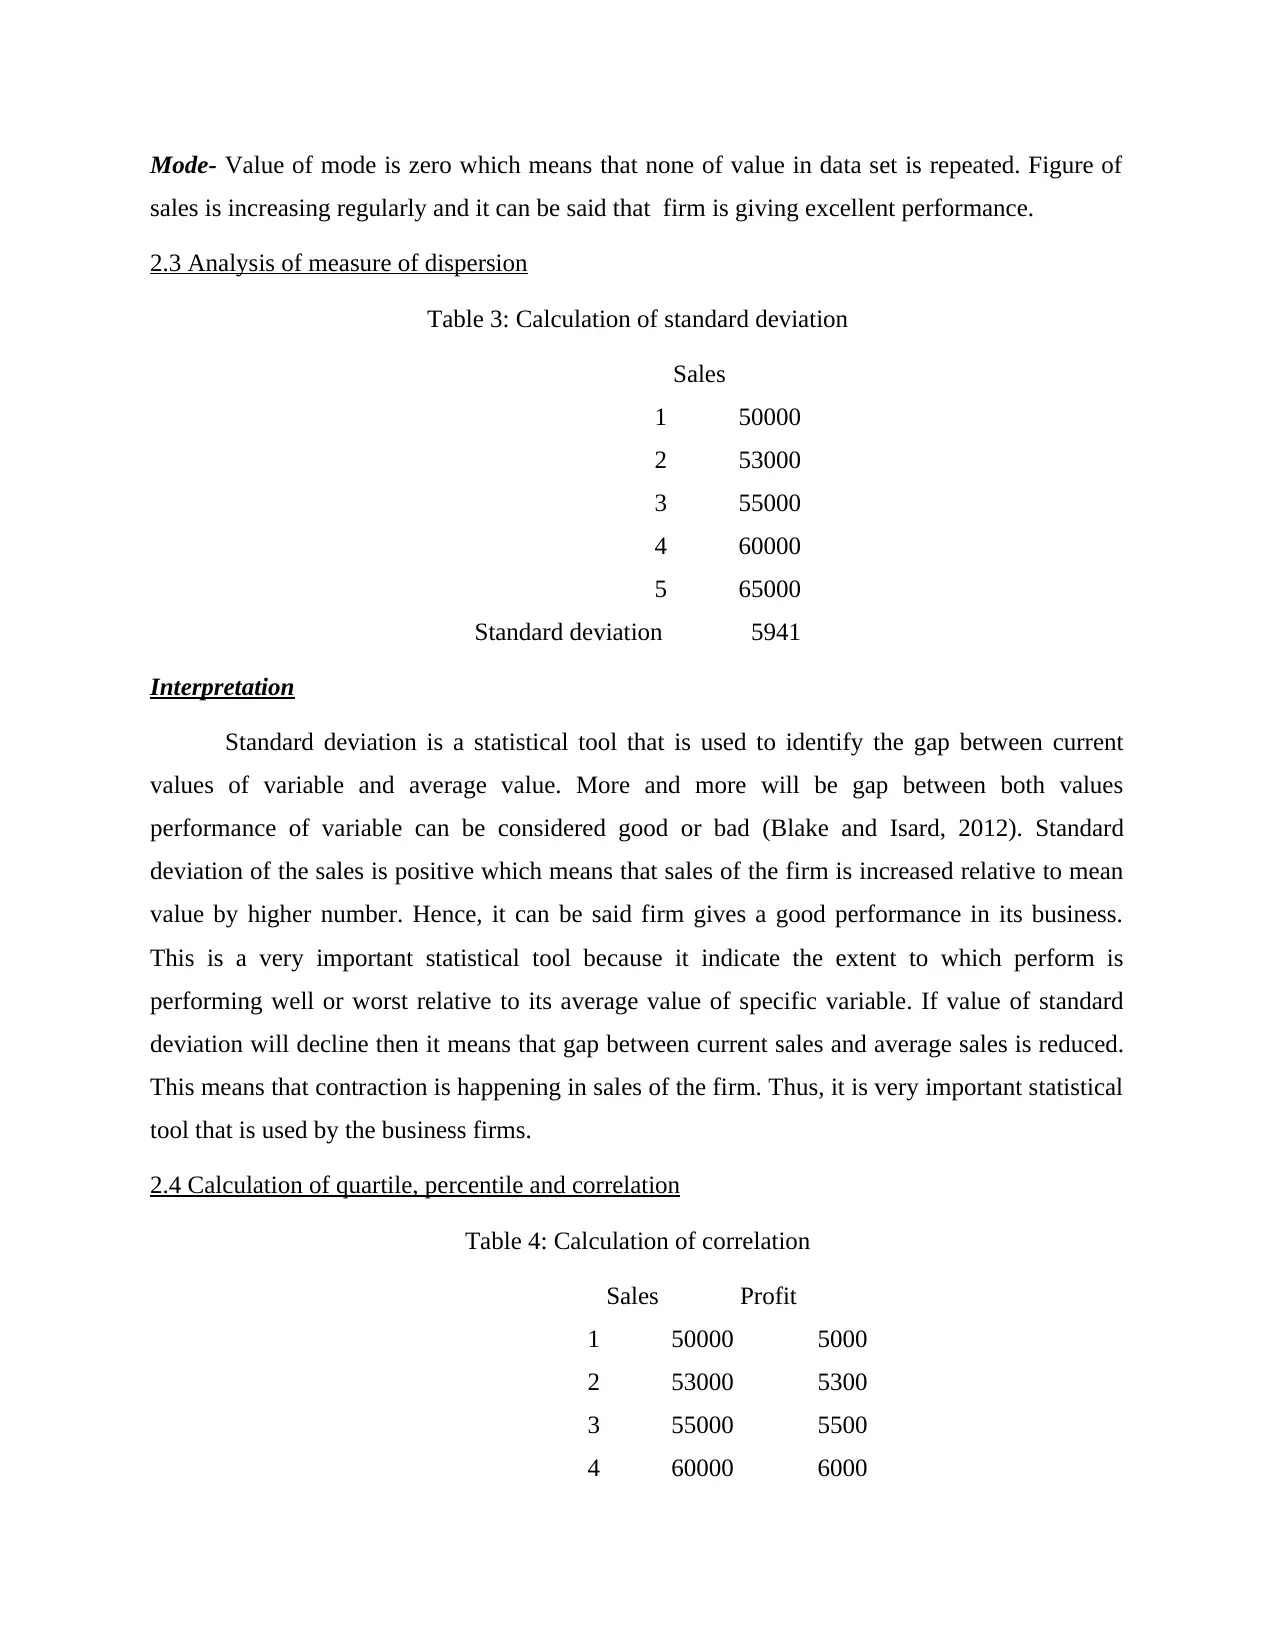
Mode- Value of mode is zero which means that none of value in data set is repeated. Figure of
sales is increasing regularly and it can be said that firm is giving excellent performance.
2.3 Analysis of measure of dispersion
Table 3: Calculation of standard deviation
Sales
1 50000
2 53000
3 55000
4 60000
5 65000
Standard deviation 5941
Interpretation
Standard deviation is a statistical tool that is used to identify the gap between current
values of variable and average value. More and more will be gap between both values
performance of variable can be considered good or bad (Blake and Isard, 2012). Standard
deviation of the sales is positive which means that sales of the firm is increased relative to mean
value by higher number. Hence, it can be said firm gives a good performance in its business.
This is a very important statistical tool because it indicate the extent to which perform is
performing well or worst relative to its average value of specific variable. If value of standard
deviation will decline then it means that gap between current sales and average sales is reduced.
This means that contraction is happening in sales of the firm. Thus, it is very important statistical
tool that is used by the business firms.
2.4 Calculation of quartile, percentile and correlation
Table 4: Calculation of correlation
Sales Profit
1 50000 5000
2 53000 5300
3 55000 5500
4 60000 6000
⊘ This is a preview!⊘
Do you want full access?
Subscribe today to unlock all pages.
Trusted by 1+ million students worldwide
5 65000 6500
Correlation 1
Interpretation
Correlation is a important statistical tool that is used by the business firms. This tool is
used to measure relationship between two variables. Value of correlation remain in range of -1,0
and +1. If value of correlation is +1 then it means that there is very high correlation between two
variables and with change in one variable equal change will be observed in other variable (Bland,
2015). If value of correlation is zero then it means that there is no relationship between two
variables and both are independent in terms of their impact on each other. If value of correlation
is -1 then it means that that there is relationship between both variables and both are moving in
inverse direction. Here, value of correlation is one and it means sales and profit of the firm are
perfectly correlated with each other. If sales will be changed by 20% then profit will also
changed by 20%.
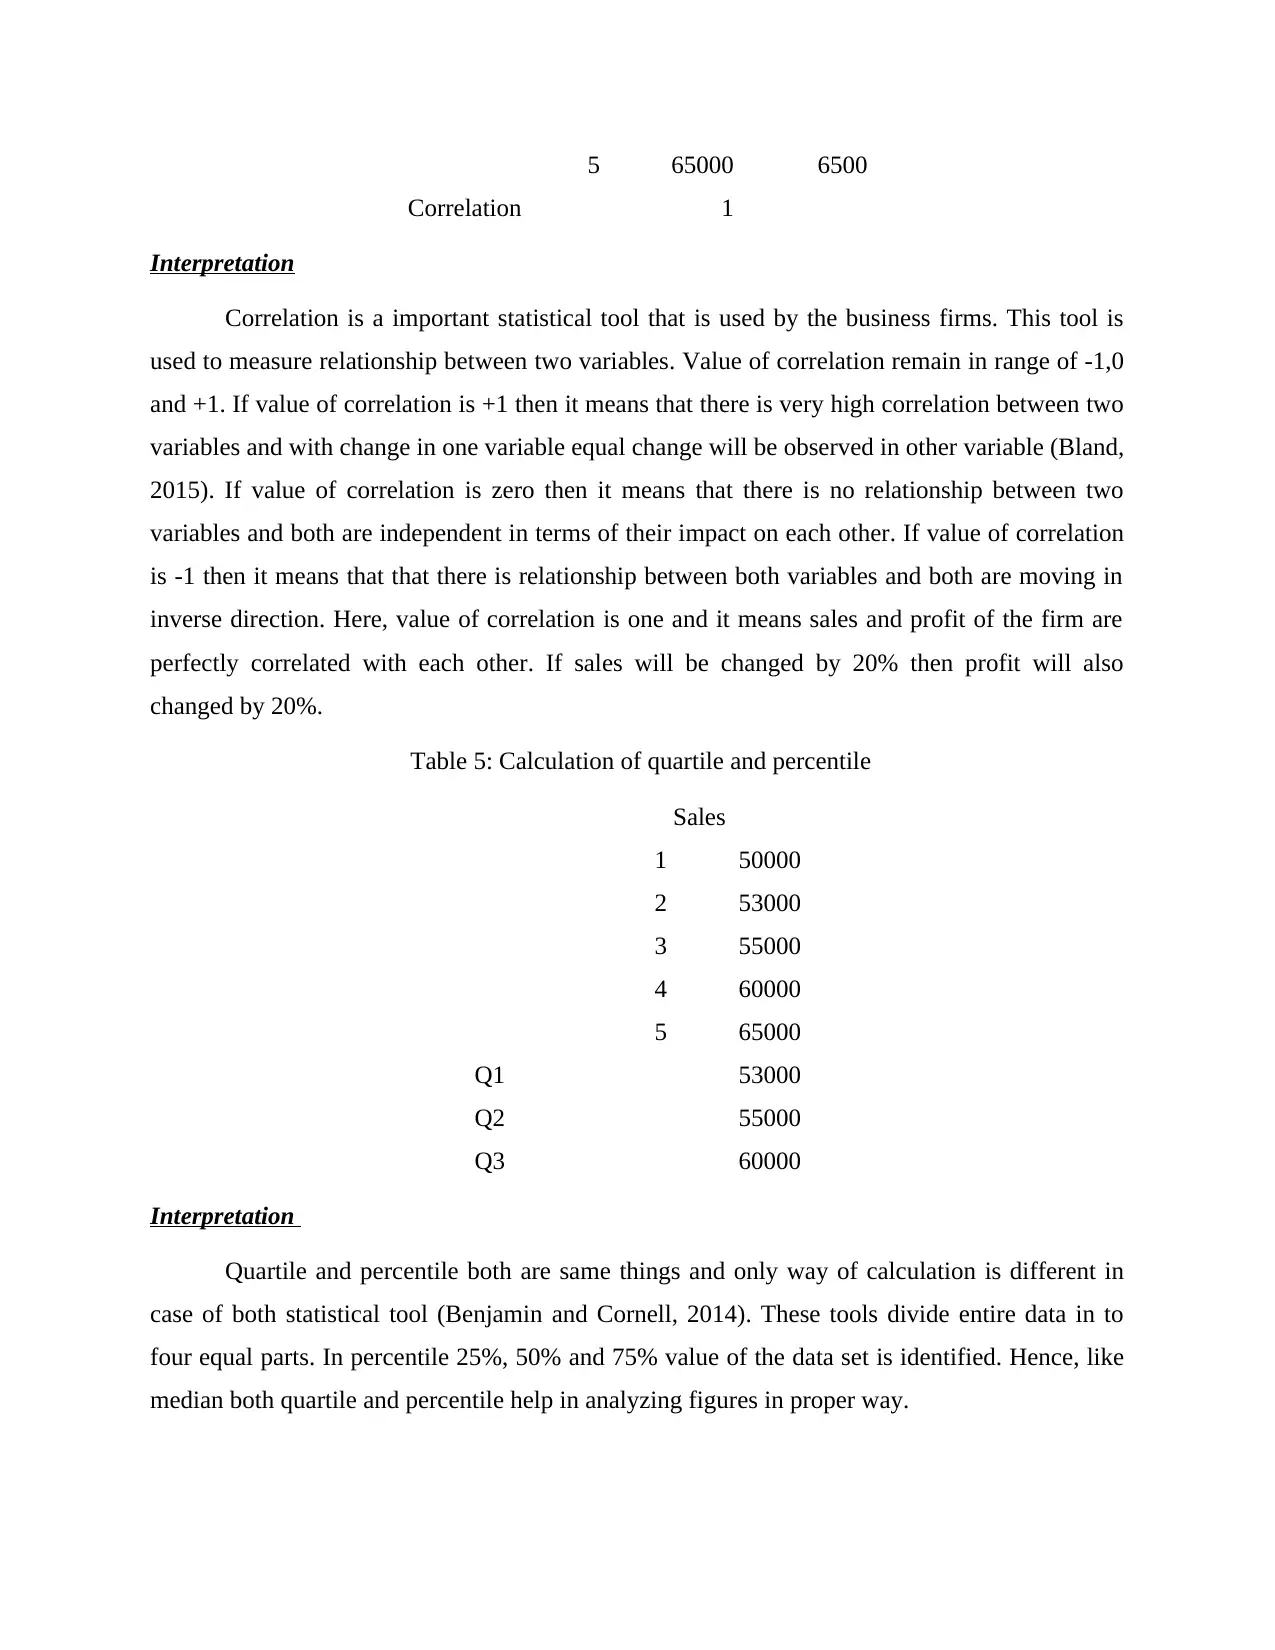
Table 5: Calculation of quartile and percentile
Sales
1 50000
2 53000
3 55000
4 60000
5 65000
Q1 53000
Q2 55000
Q3 60000
Interpretation
Quartile and percentile both are same things and only way of calculation is different in
case of both statistical tool (Benjamin and Cornell, 2014). These tools divide entire data in to
four equal parts. In percentile 25%, 50% and 75% value of the data set is identified. Hence, like
median both quartile and percentile help in analyzing figures in proper way.
Correlation 1
Interpretation
Correlation is a important statistical tool that is used by the business firms. This tool is
used to measure relationship between two variables. Value of correlation remain in range of -1,0
and +1. If value of correlation is +1 then it means that there is very high correlation between two
variables and with change in one variable equal change will be observed in other variable (Bland,
2015). If value of correlation is zero then it means that there is no relationship between two
variables and both are independent in terms of their impact on each other. If value of correlation
is -1 then it means that that there is relationship between both variables and both are moving in
inverse direction. Here, value of correlation is one and it means sales and profit of the firm are
perfectly correlated with each other. If sales will be changed by 20% then profit will also
changed by 20%.
Table 5: Calculation of quartile and percentile
Sales
1 50000
2 53000
3 55000
4 60000
5 65000
Q1 53000
Q2 55000
Q3 60000
Interpretation
Quartile and percentile both are same things and only way of calculation is different in
case of both statistical tool (Benjamin and Cornell, 2014). These tools divide entire data in to
four equal parts. In percentile 25%, 50% and 75% value of the data set is identified. Hence, like
median both quartile and percentile help in analyzing figures in proper way.
Paraphrase This Document
Need a fresh take? Get an instant paraphrase of this document with our AI Paraphraser
TASK 3
3.1 Graphical representation of primary data
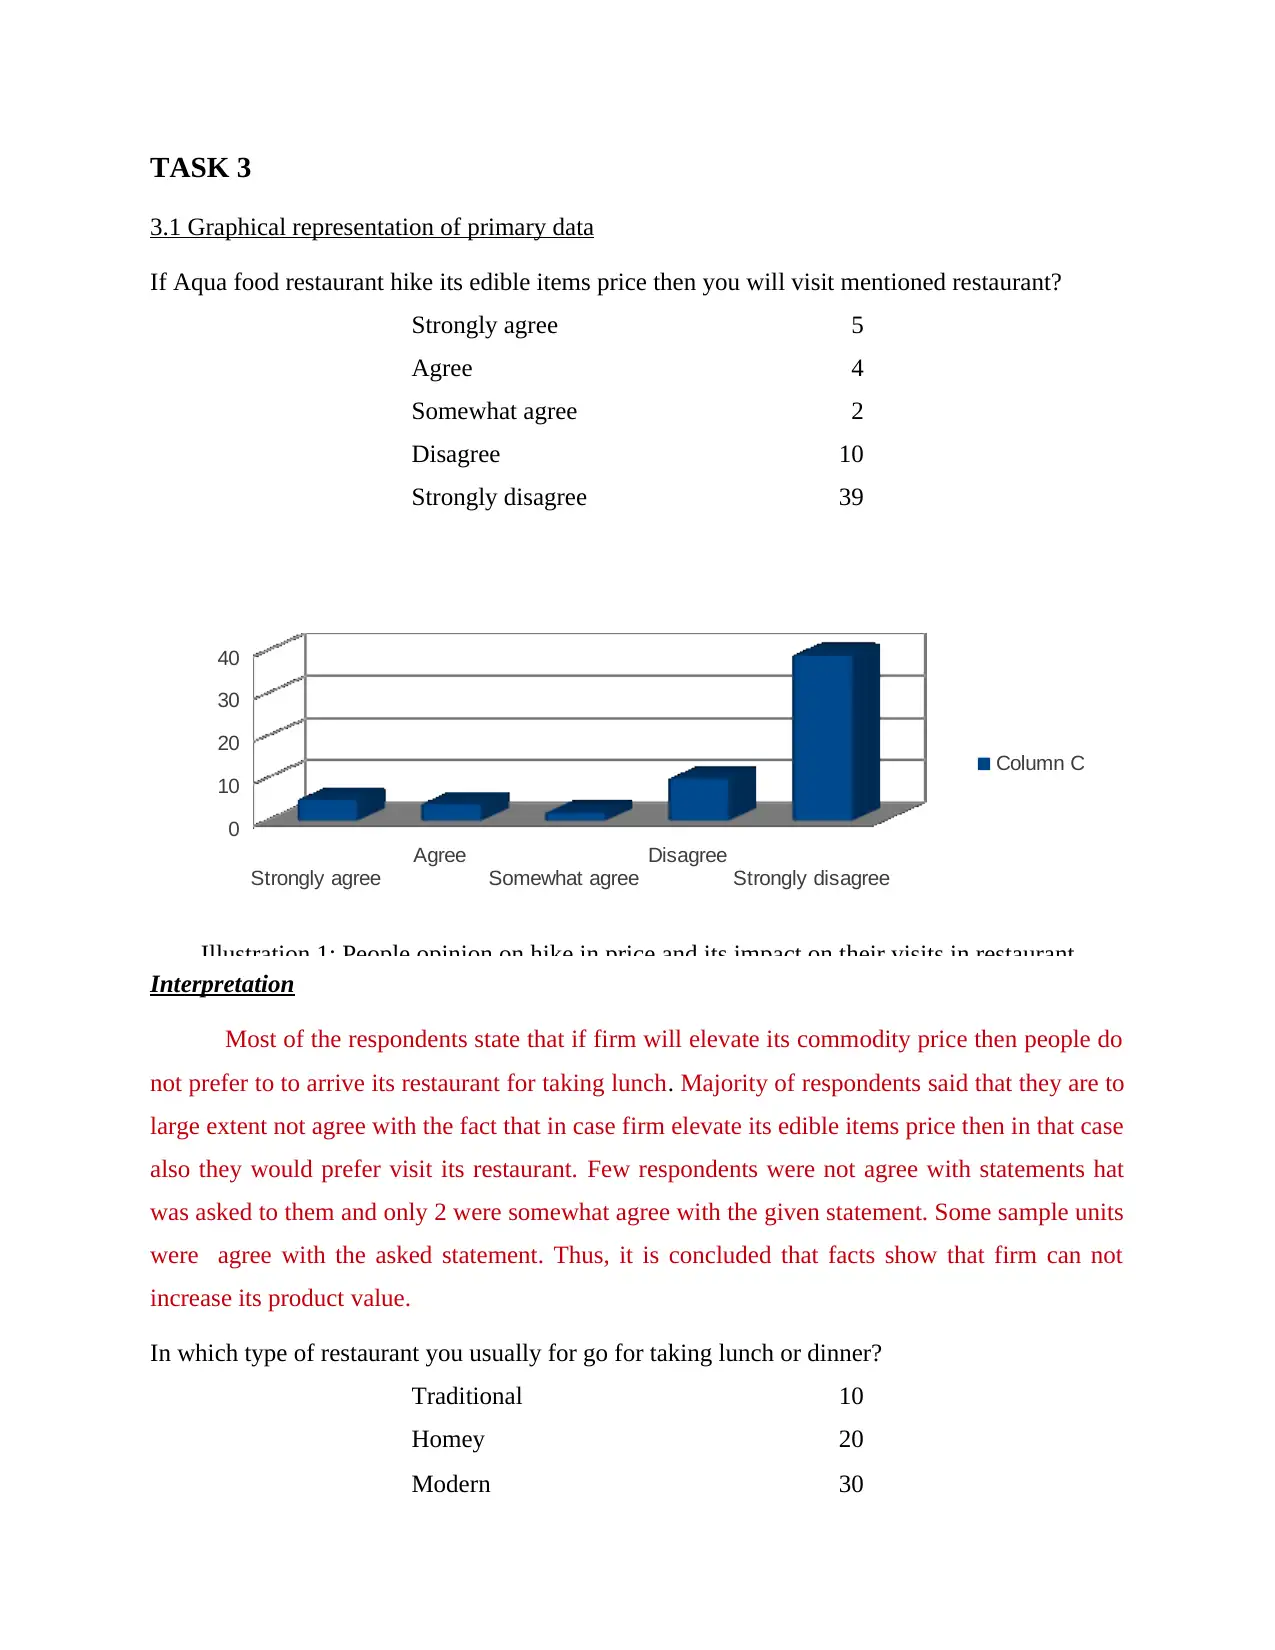
If Aqua food restaurant hike its edible items price then you will visit mentioned restaurant?
Strongly agree 5
Agree 4
Somewhat agree 2
Disagree 10
Strongly disagree 39
Interpretation
Most of the respondents state that if firm will elevate its commodity price then people do
not prefer to to arrive its restaurant for taking lunch. Majority of respondents said that they are to
large extent not agree with the fact that in case firm elevate its edible items price then in that case
also they would prefer visit its restaurant. Few respondents were not agree with statements hat
was asked to them and only 2 were somewhat agree with the given statement. Some sample units
were agree with the asked statement. Thus, it is concluded that facts show that firm can not
increase its product value.
In which type of restaurant you usually for go for taking lunch or dinner?
Traditional 10
Homey 20
Modern 30
Strongly agree
Agree
Somewhat agree
Disagree
Strongly disagree
0
10
20
30
40
Column C
Illustration 1: People opinion on hike in price and its impact on their visits in restaurant
3.1 Graphical representation of primary data
If Aqua food restaurant hike its edible items price then you will visit mentioned restaurant?
Strongly agree 5
Agree 4
Somewhat agree 2
Disagree 10
Strongly disagree 39
Interpretation
Most of the respondents state that if firm will elevate its commodity price then people do
not prefer to to arrive its restaurant for taking lunch. Majority of respondents said that they are to
large extent not agree with the fact that in case firm elevate its edible items price then in that case
also they would prefer visit its restaurant. Few respondents were not agree with statements hat
was asked to them and only 2 were somewhat agree with the given statement. Some sample units
were agree with the asked statement. Thus, it is concluded that facts show that firm can not
increase its product value.
In which type of restaurant you usually for go for taking lunch or dinner?
Traditional 10
Homey 20
Modern 30
Strongly agree
Agree
Somewhat agree
Disagree
Strongly disagree
0
10
20
30
40
Column C
Illustration 1: People opinion on hike in price and its impact on their visits in restaurant
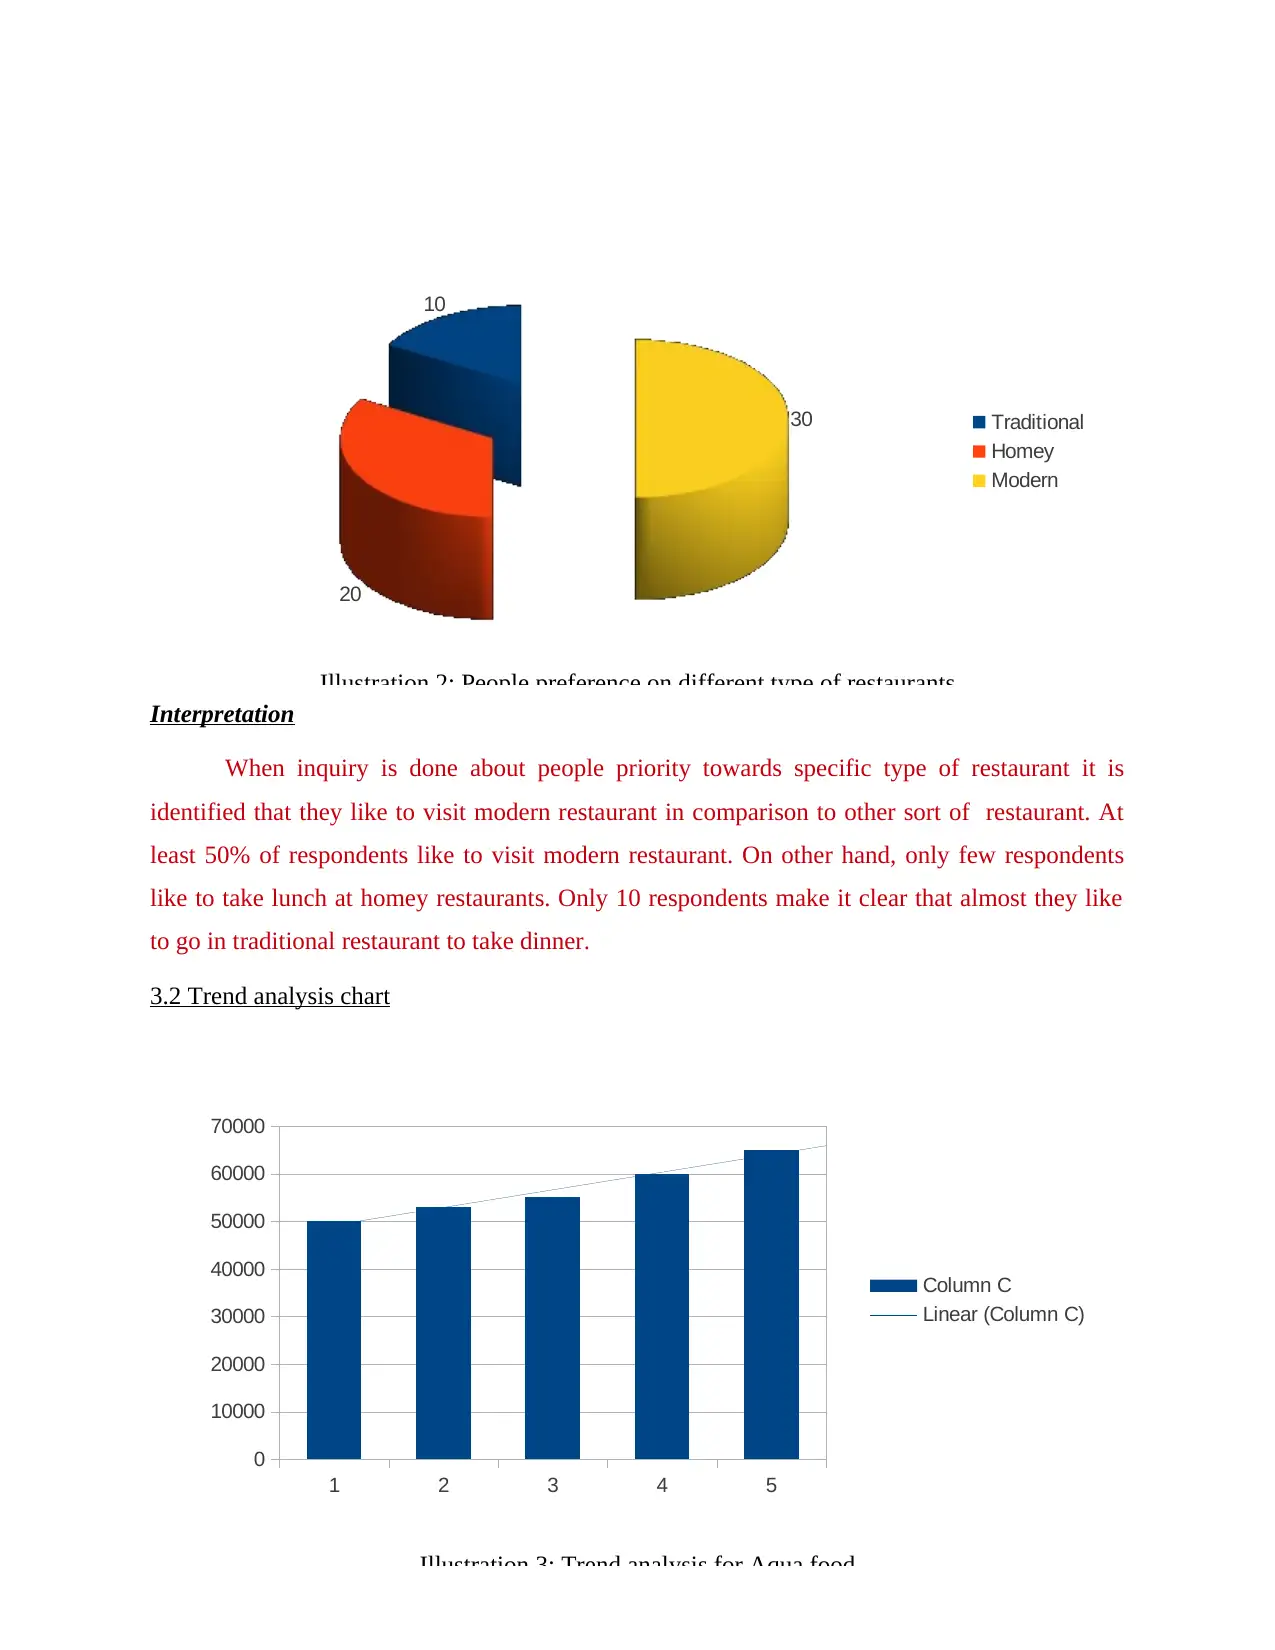
Interpretation
When inquiry is done about people priority towards specific type of restaurant it is
identified that they like to visit modern restaurant in comparison to other sort of restaurant. At
least 50% of respondents like to visit modern restaurant. On other hand, only few respondents
like to take lunch at homey restaurants. Only 10 respondents make it clear that almost they like
to go in traditional restaurant to take dinner.
3.2 Trend analysis chart
1 2 3 4 5
0
10000
20000
30000
40000
50000
60000
70000
Column C
Linear (Column C)
Illustration 3: Trend analysis for Aqua food
10
20
30 Traditional
Homey
Modern
Illustration 2: People preference on different type of restaurants
⊘ This is a preview!⊘
Do you want full access?
Subscribe today to unlock all pages.
Trusted by 1+ million students worldwide
1 out of 20