logo

BUSINESS DECISION MAKING Task 2.


Added on  2023-03-24

9 Pages444 Words27 Views
BUSINESS DECISION MAKING
Task 2
BUSINESS DECISION MAKING Task 2._1
3.3 BUSINESS PRESENTATION
Graphical presentation
BUSINESS DECISION MAKING Task 2._2
CONTINUED
Graphical presentation shows that sales revenue and
profit margin of F&F increased over the years. In 2011,
sales of F&F were £1350 significantly, whereas in 2017
revenue accounted for £1750.
Due to having positive relationship between the
variables profit margin of restaurant also inclined. Thus,
inclining trend of revenue and margin shows that
customers more frequently visit F&F and prefer its
services to a great extent.
BUSINESS DECISION MAKING Task 2._3

End of preview

Want to access all the pages? Upload your documents or become a member.

Related Documents
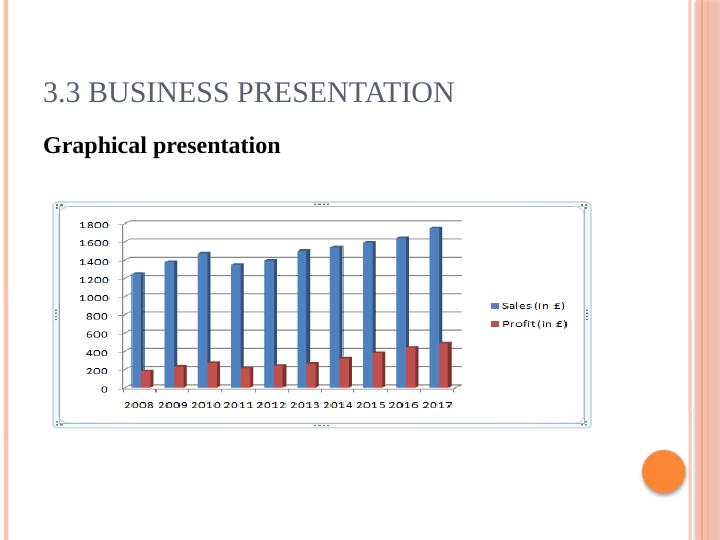
Graphical Presentation of Business Decision Making
|11
|520
|155

Business Decision Making - Presentation
|9
|641
|27

BUSINESS DECISION MAKING
|10
|475
|79

Business Decision Making Presentation
|11
|695
|35

Business Decision Making - Presentation
|11
|652
|486

Business Decision Making
|11
|467
|53