Business Decision Making Report - BA5F01, University Assignment
VerifiedAdded on 2023/01/03
|11
|2327
|41
Report
AI Summary
This report provides a detailed analysis of business decision-making techniques. It begins with an introduction to the topic, followed by a main body that addresses various questions related to statistical analysis and investment appraisal. The report includes the use of frequency distribution, calculation of mean, median, mode, range, variance, and standard deviation. It also covers critical path analysis and network diagrams. Furthermore, the report delves into investment appraisal methods, differentiating between non-discounting methods like payback period and accounting rate of return, and discounting methods such as net present value (NPV) and internal rate of return (IRR). The report concludes by summarizing the key findings and emphasizing the importance of these techniques in making informed business decisions, supported by relevant references.

BA5F01
BUSINESS DECISION-
MAKING
BUSINESS DECISION-
MAKING
Paraphrase This Document
Need a fresh take? Get an instant paraphrase of this document with our AI Paraphraser

Table of Contents
INTRODUCTION...........................................................................................................................3
MAIN BODY...................................................................................................................................3
QUESTION 1..............................................................................................................................3
QUESTION 2..............................................................................................................................3
QUESTION 3..............................................................................................................................5
QUESTION 4..............................................................................................................................6
QUESTION 5..............................................................................................................................7
QUESTION 6..............................................................................................................................8
CONCLUSION................................................................................................................................9
REFERENCES..............................................................................................................................10
INTRODUCTION
Business decision making involves a lot of evaluation of various available alternatives. The
proper and reliable evaluation must be done to arrive at a decision which fulfils the requirements
of business. The achievement of business motive to earn more profit with minimum costs can
only be possible through the use of those techniques which helps in deciding what to do and not
to do. Here in this report all such techniques which are helpful in business decision making are
discussed.
MAIN BODY
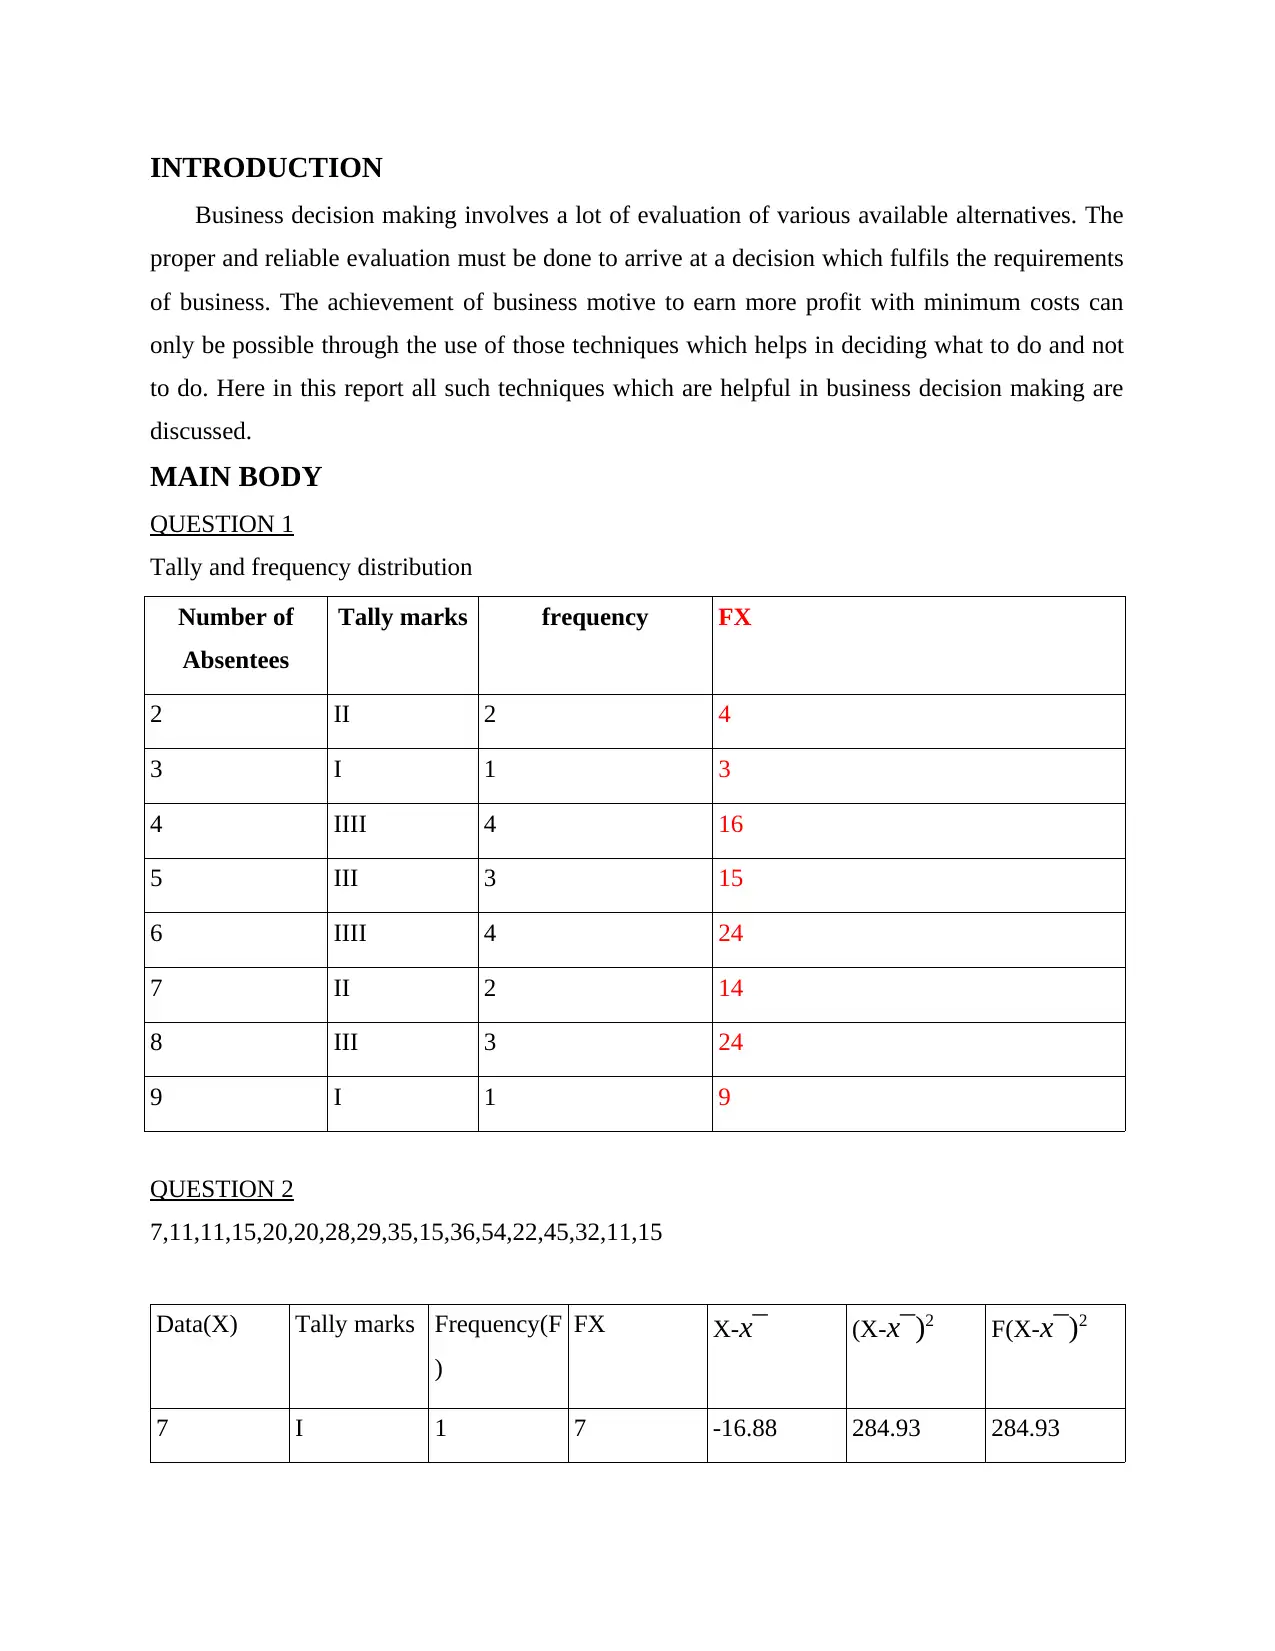
QUESTION 1
Tally and frequency distribution
Number of
Absentees
Tally marks frequency FX
2 II 2 4
3 I 1 3
4 IIII 4 16
5 III 3 15
6 IIII 4 24
7 II 2 14
8 III 3 24
9 I 1 9
QUESTION 2
7,11,11,15,20,20,28,29,35,15,36,54,22,45,32,11,15
Data(X) Tally marks Frequency(F
)
FX X-x¯ (X-x¯)2 F(X-x¯)2
7 I 1 7 -16.88 284.93 284.93
Business decision making involves a lot of evaluation of various available alternatives. The
proper and reliable evaluation must be done to arrive at a decision which fulfils the requirements
of business. The achievement of business motive to earn more profit with minimum costs can
only be possible through the use of those techniques which helps in deciding what to do and not
to do. Here in this report all such techniques which are helpful in business decision making are
discussed.
MAIN BODY
QUESTION 1
Tally and frequency distribution
Number of
Absentees
Tally marks frequency FX
2 II 2 4
3 I 1 3
4 IIII 4 16
5 III 3 15
6 IIII 4 24
7 II 2 14
8 III 3 24
9 I 1 9
QUESTION 2
7,11,11,15,20,20,28,29,35,15,36,54,22,45,32,11,15
Data(X) Tally marks Frequency(F
)
FX X-x¯ (X-x¯)2 F(X-x¯)2
7 I 1 7 -16.88 284.93 284.93
⊘ This is a preview!⊘
Do you want full access?
Subscribe today to unlock all pages.
Trusted by 1+ million students worldwide
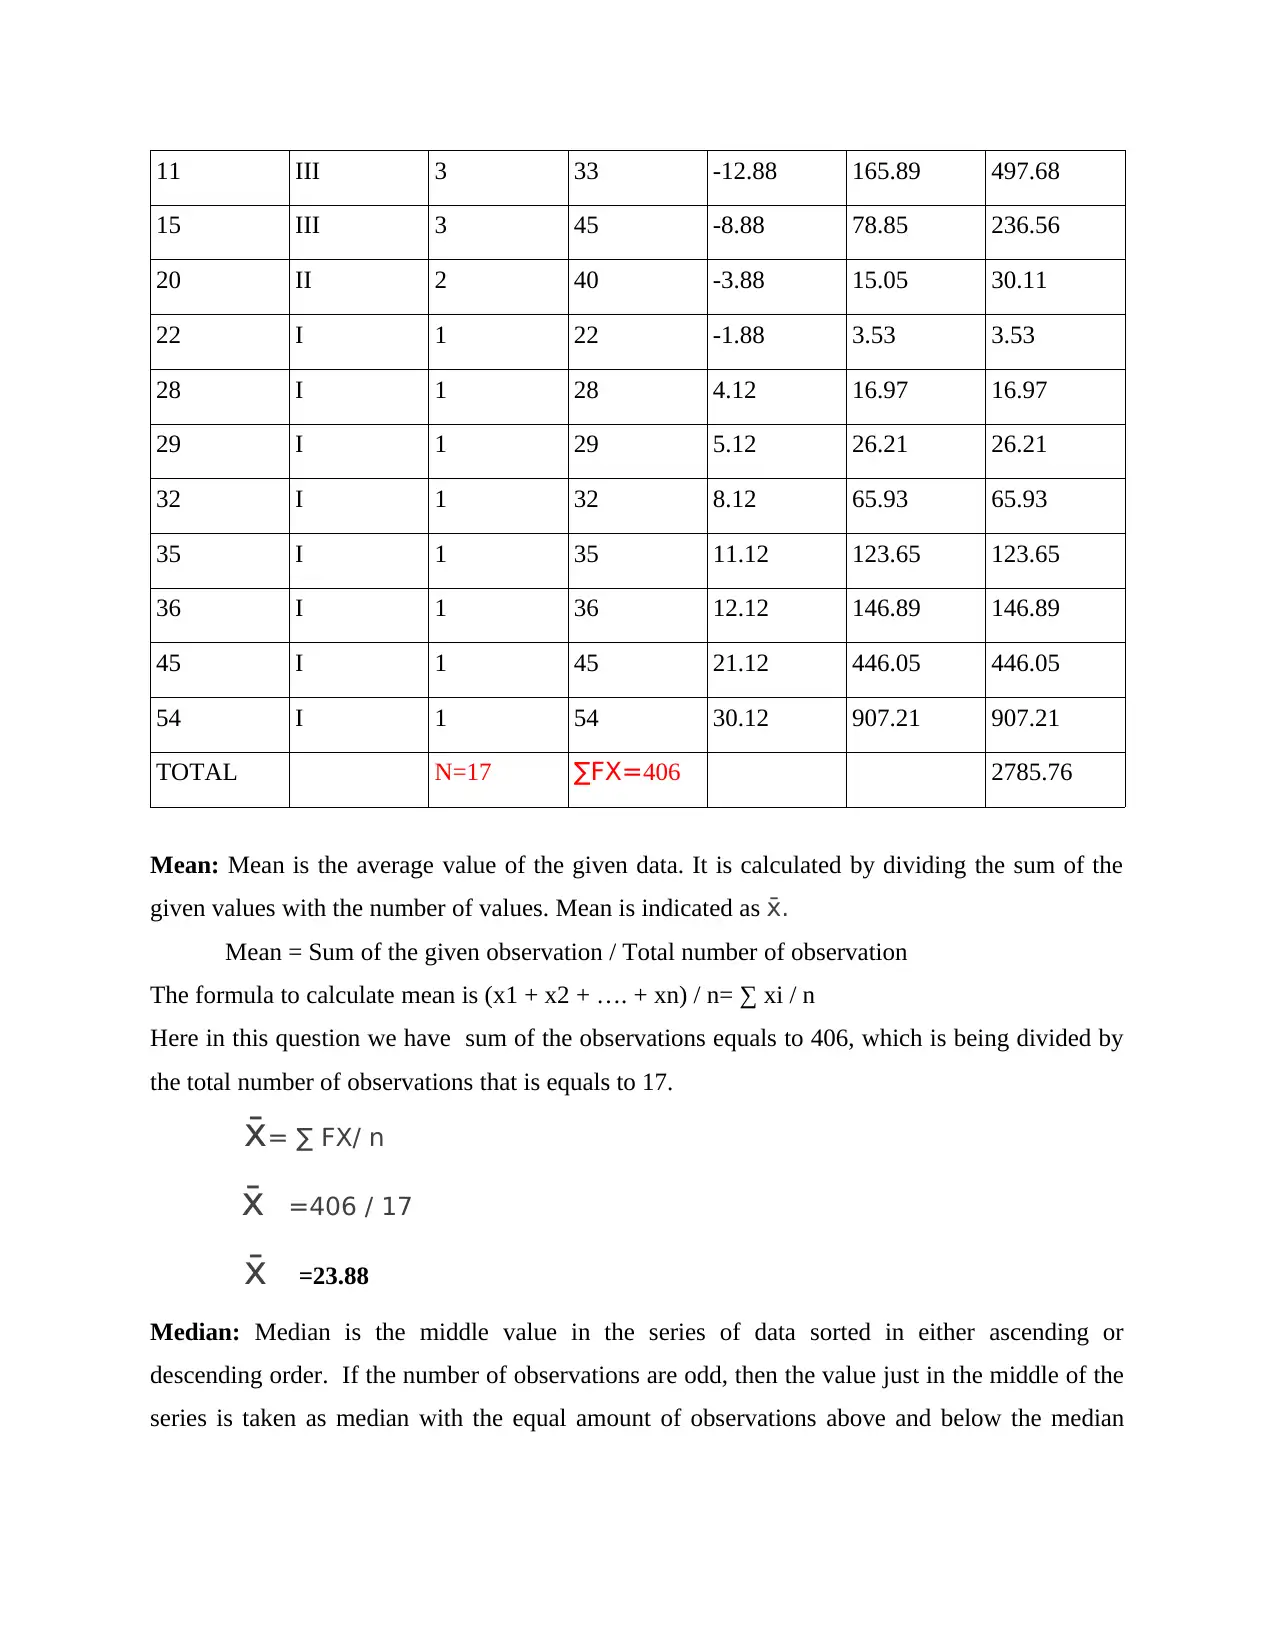
11 III 3 33 -12.88 165.89 497.68
15 III 3 45 -8.88 78.85 236.56
20 II 2 40 -3.88 15.05 30.11
22 I 1 22 -1.88 3.53 3.53
28 I 1 28 4.12 16.97 16.97
29 I 1 29 5.12 26.21 26.21
32 I 1 32 8.12 65.93 65.93
35 I 1 35 11.12 123.65 123.65
36 I 1 36 12.12 146.89 146.89
45 I 1 45 21.12 446.05 446.05
54 I 1 54 30.12 907.21 907.21
TOTAL N=17 ∑FX=406 2785.76
Mean: Mean is the average value of the given data. It is calculated by dividing the sum of the
given values with the number of values. Mean is indicated as x̄.
Mean = Sum of the given observation / Total number of observation
The formula to calculate mean is (x1 + x2 + …. + xn) / n= ∑ xi / n
Here in this question we have sum of the observations equals to 406, which is being divided by
the total number of observations that is equals to 17.
x̄= ∑ FX/ n
x̄ =406 / 17
x̄ =23.88
Median: Median is the middle value in the series of data sorted in either ascending or
descending order. If the number of observations are odd, then the value just in the middle of the
series is taken as median with the equal amount of observations above and below the median
Paraphrase This Document
Need a fresh take? Get an instant paraphrase of this document with our AI Paraphraser
value. If the number of observations are even then the pair just in the middle is taken, added
together and divided by 2, to find the median value. Median is indicated by (MJiang, 2016).
Here in this question median is calculated as follows:
There are 17 number of observations given above where the median can easily be
found out by picking up the ninth value that is equals to 20. So the median is equals to 20.
Mode: It is the number or value or observation which occur most of the time in the given series
of data. We can have more than one value as mode as is the case in this question where we have
two modes and it is called bimodal series and if there are more than two modes it is known as
multimodal series. In the given series there are two modes, that is 11 and 15 which is occurring
most of the times.
Range: Difference between the highest value and the lowest value in the given series of data is
known as range. In this question range is calculated as the difference between the highest value
that is equals to 54 and the lowest value which is equals to 7. So the range is 54 – 7 = 47.
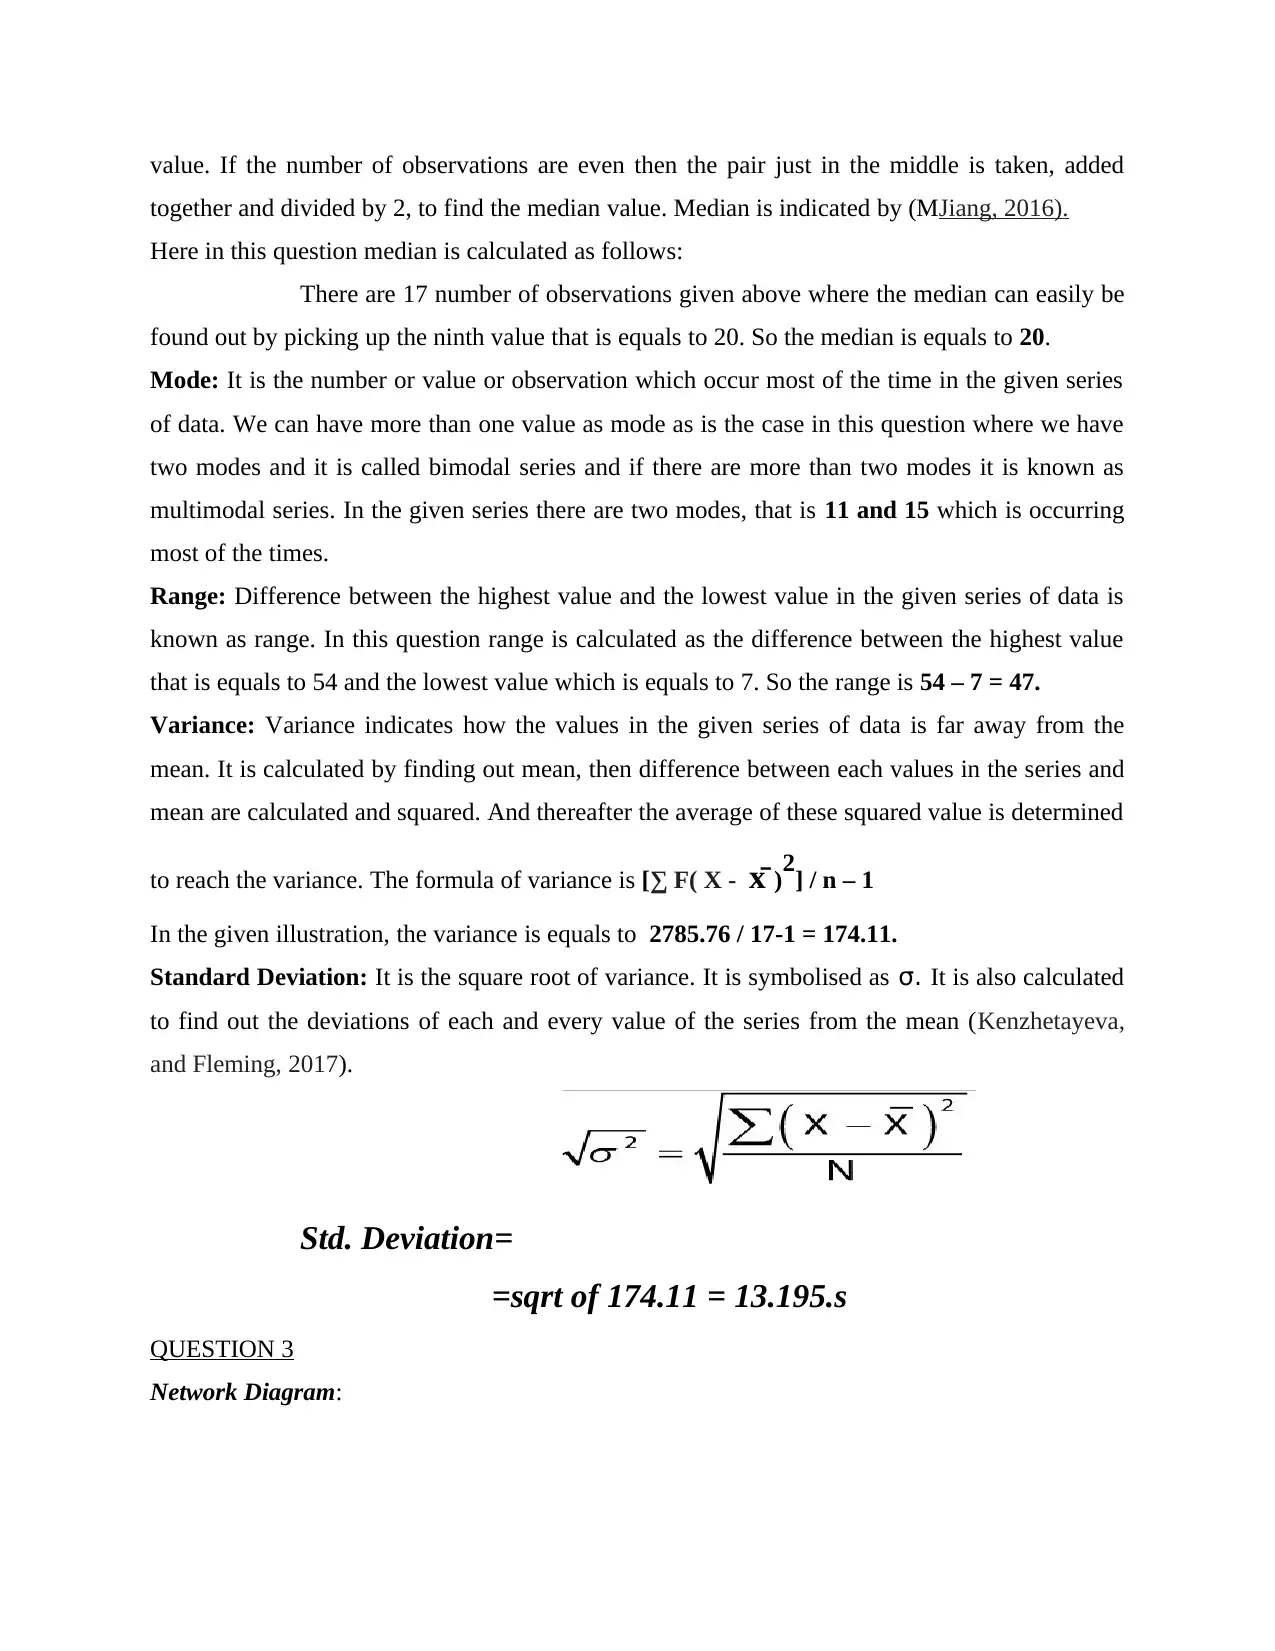
Variance: Variance indicates how the values in the given series of data is far away from the
mean. It is calculated by finding out mean, then difference between each values in the series and
mean are calculated and squared. And thereafter the average of these squared value is determined
to reach the variance. The formula of variance is [∑ F( X - x̄ )2] / n – 1
In the given illustration, the variance is equals to 2785.76 / 17-1 = 174.11.
Standard Deviation: It is the square root of variance. It is symbolised as σ. It is also calculated
to find out the deviations of each and every value of the series from the mean (Kenzhetayeva,
and Fleming, 2017).
Std. Deviation=
=sqrt of 174.11 = 13.195.s
QUESTION 3
Network Diagram:
together and divided by 2, to find the median value. Median is indicated by (MJiang, 2016).
Here in this question median is calculated as follows:
There are 17 number of observations given above where the median can easily be
found out by picking up the ninth value that is equals to 20. So the median is equals to 20.
Mode: It is the number or value or observation which occur most of the time in the given series
of data. We can have more than one value as mode as is the case in this question where we have
two modes and it is called bimodal series and if there are more than two modes it is known as
multimodal series. In the given series there are two modes, that is 11 and 15 which is occurring
most of the times.
Range: Difference between the highest value and the lowest value in the given series of data is
known as range. In this question range is calculated as the difference between the highest value
that is equals to 54 and the lowest value which is equals to 7. So the range is 54 – 7 = 47.
Variance: Variance indicates how the values in the given series of data is far away from the
mean. It is calculated by finding out mean, then difference between each values in the series and
mean are calculated and squared. And thereafter the average of these squared value is determined
to reach the variance. The formula of variance is [∑ F( X - x̄ )2] / n – 1
In the given illustration, the variance is equals to 2785.76 / 17-1 = 174.11.
Standard Deviation: It is the square root of variance. It is symbolised as σ. It is also calculated
to find out the deviations of each and every value of the series from the mean (Kenzhetayeva,
and Fleming, 2017).
Std. Deviation=
=sqrt of 174.11 = 13.195.s
QUESTION 3
Network Diagram:
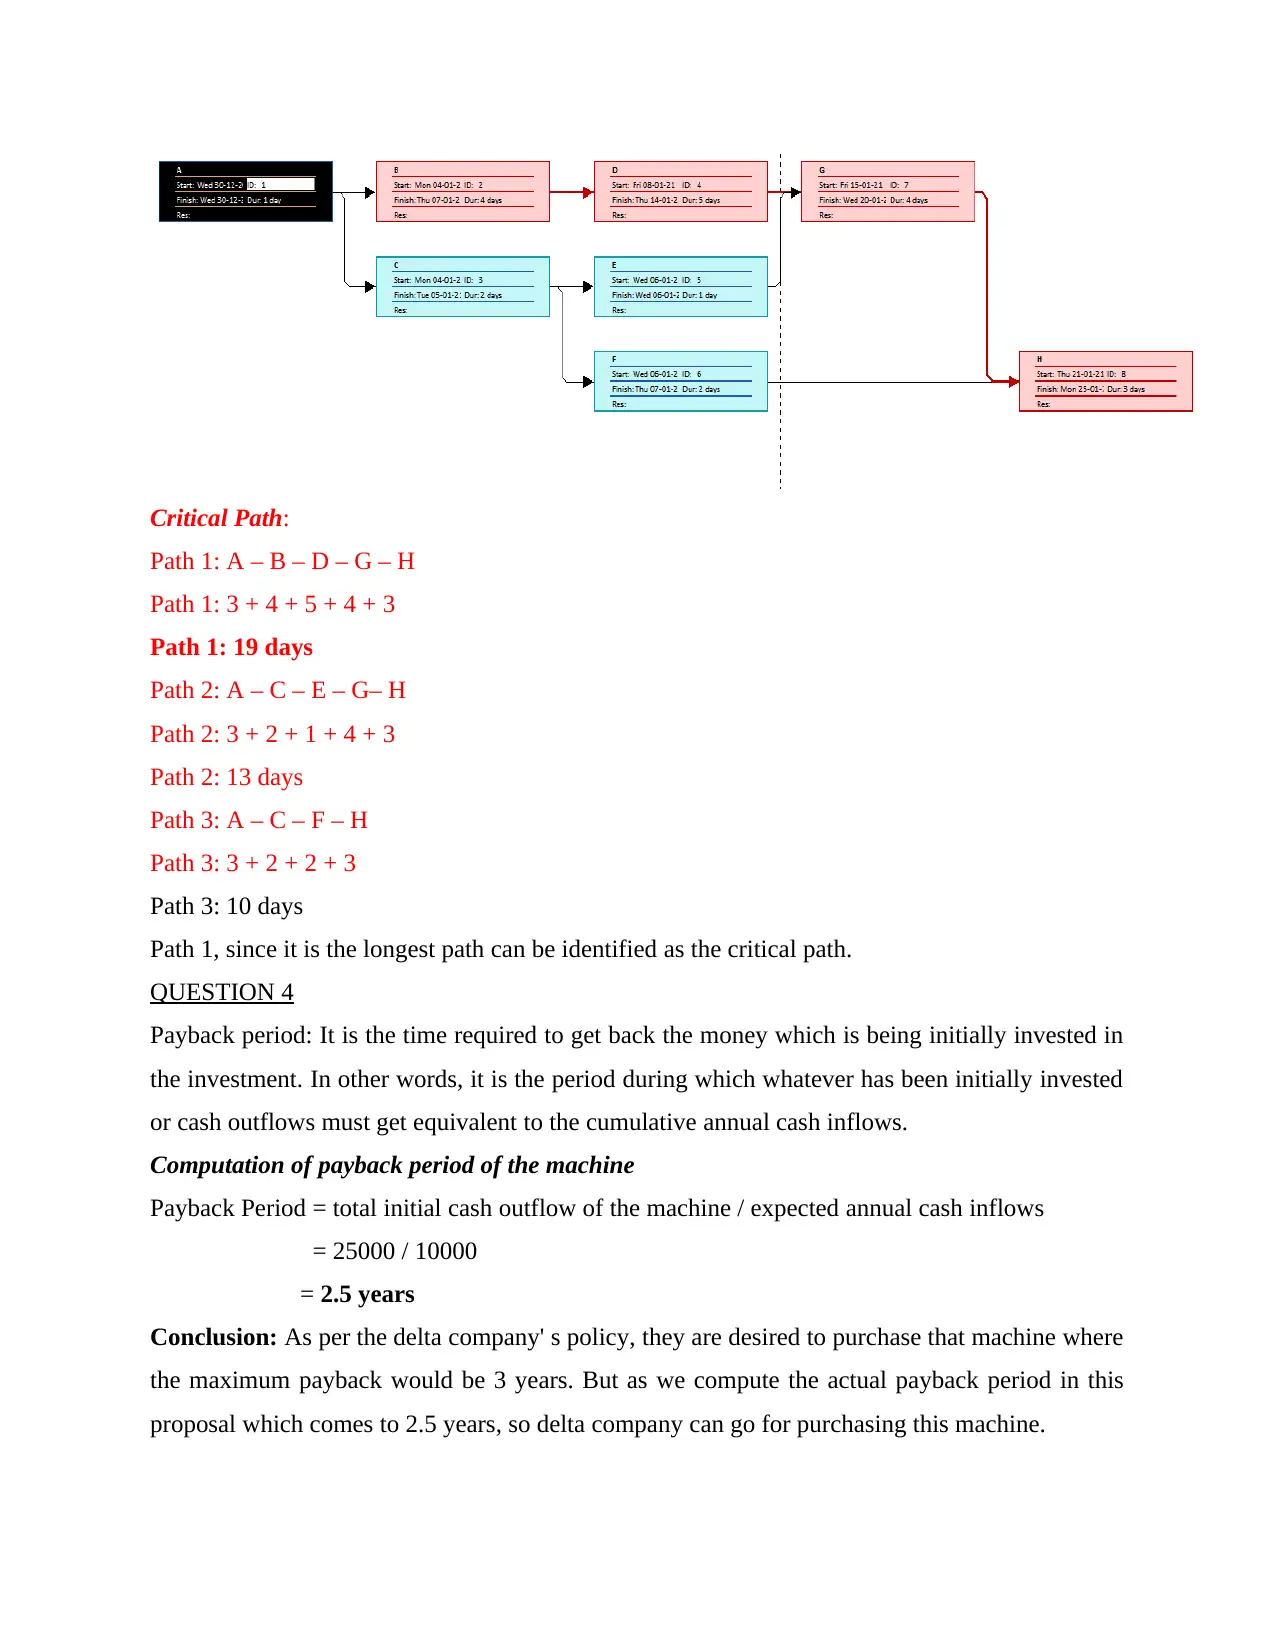
Critical Path:
Path 1: A – B – D – G – H
Path 1: 3 + 4 + 5 + 4 + 3
Path 1: 19 days
Path 2: A – C – E – G– H
Path 2: 3 + 2 + 1 + 4 + 3
Path 2: 13 days
Path 3: A – C – F – H
Path 3: 3 + 2 + 2 + 3
Path 3: 10 days
Path 1, since it is the longest path can be identified as the critical path.
QUESTION 4
Payback period: It is the time required to get back the money which is being initially invested in
the investment. In other words, it is the period during which whatever has been initially invested
or cash outflows must get equivalent to the cumulative annual cash inflows.
Computation of payback period of the machine
Payback Period = total initial cash outflow of the machine / expected annual cash inflows
= 25000 / 10000
= 2.5 years
Conclusion: As per the delta company' s policy, they are desired to purchase that machine where
the maximum payback would be 3 years. But as we compute the actual payback period in this
proposal which comes to 2.5 years, so delta company can go for purchasing this machine.
⊘ This is a preview!⊘
Do you want full access?
Subscribe today to unlock all pages.
Trusted by 1+ million students worldwide
QUESTION 5
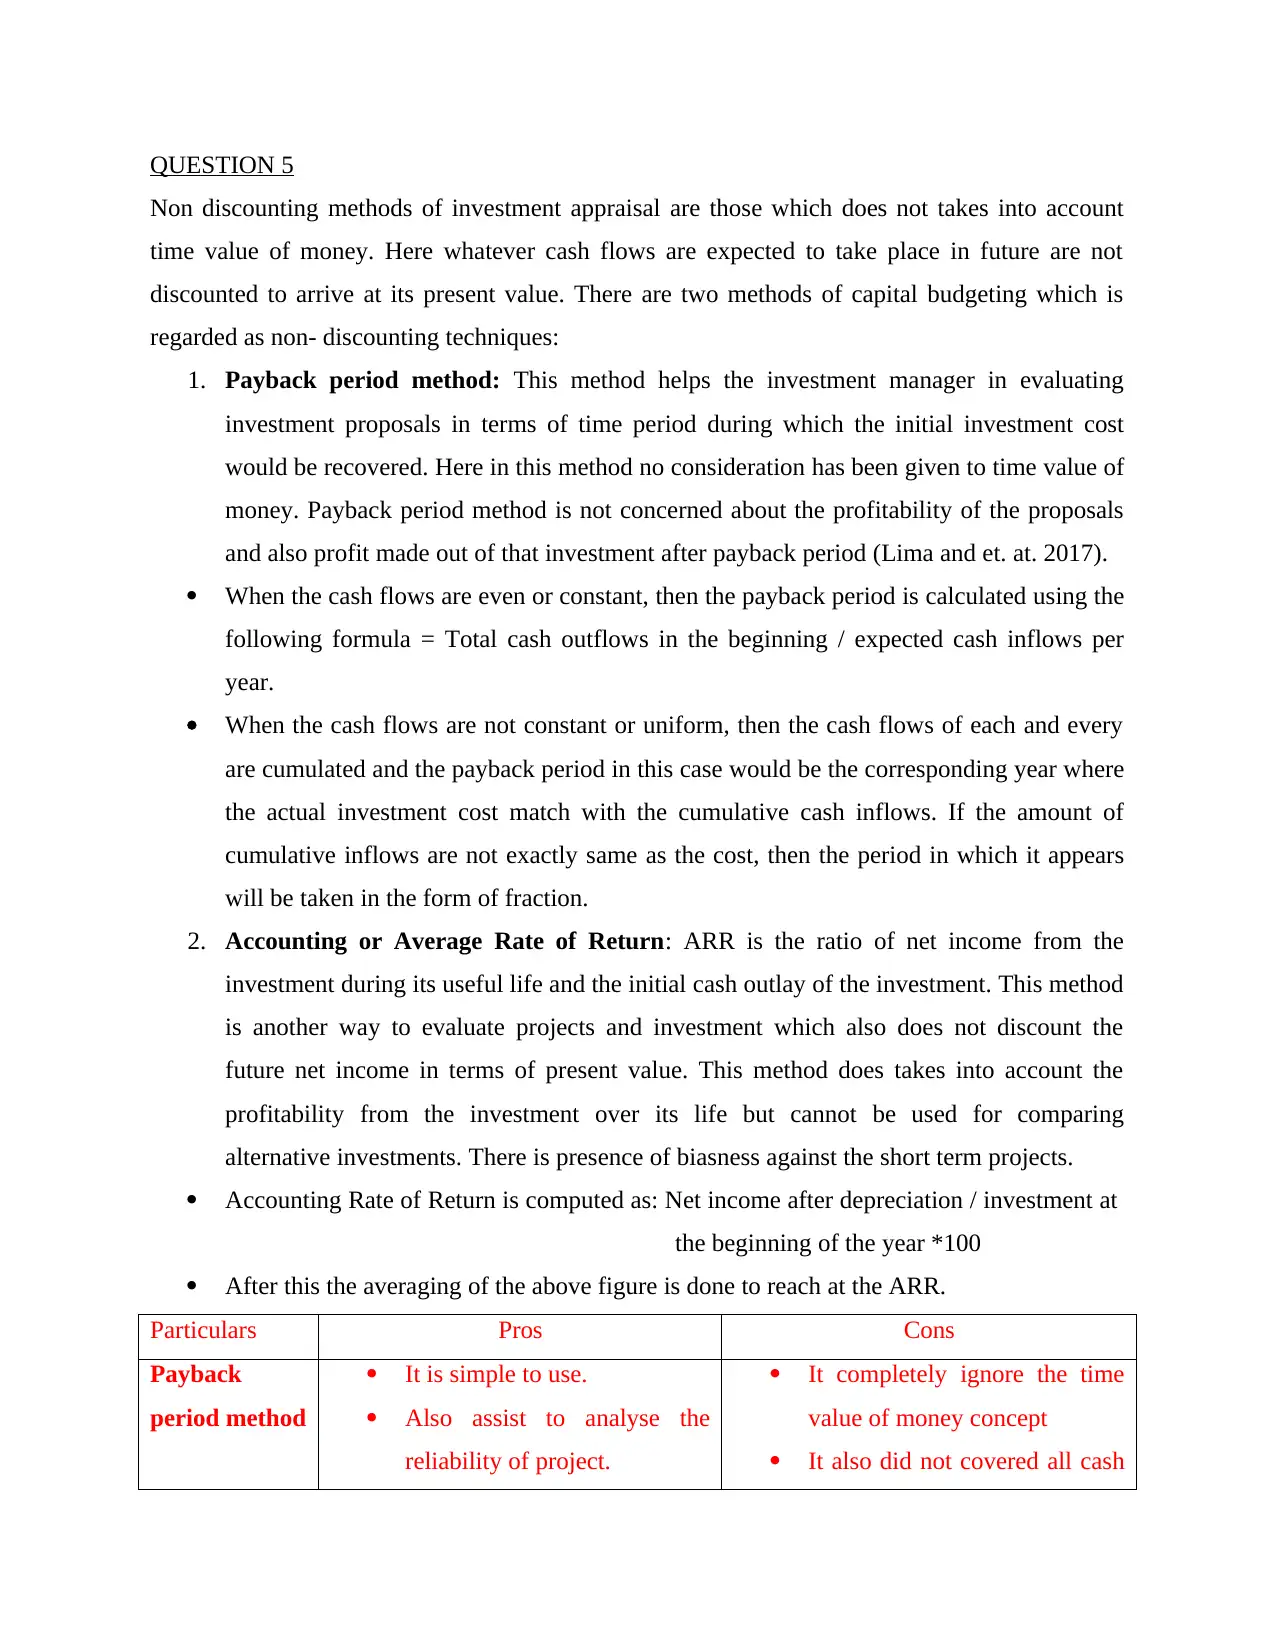
Non discounting methods of investment appraisal are those which does not takes into account
time value of money. Here whatever cash flows are expected to take place in future are not
discounted to arrive at its present value. There are two methods of capital budgeting which is
regarded as non- discounting techniques:
1. Payback period method: This method helps the investment manager in evaluating
investment proposals in terms of time period during which the initial investment cost
would be recovered. Here in this method no consideration has been given to time value of
money. Payback period method is not concerned about the profitability of the proposals
and also profit made out of that investment after payback period (Lima and et. at. 2017).
When the cash flows are even or constant, then the payback period is calculated using the
following formula = Total cash outflows in the beginning / expected cash inflows per
year.
When the cash flows are not constant or uniform, then the cash flows of each and every
are cumulated and the payback period in this case would be the corresponding year where
the actual investment cost match with the cumulative cash inflows. If the amount of
cumulative inflows are not exactly same as the cost, then the period in which it appears
will be taken in the form of fraction.
2. Accounting or Average Rate of Return: ARR is the ratio of net income from the
investment during its useful life and the initial cash outlay of the investment. This method
is another way to evaluate projects and investment which also does not discount the
future net income in terms of present value. This method does takes into account the
profitability from the investment over its life but cannot be used for comparing
alternative investments. There is presence of biasness against the short term projects.
Accounting Rate of Return is computed as: Net income after depreciation / investment at
the beginning of the year *100
After this the averaging of the above figure is done to reach at the ARR.
Particulars Pros Cons
Payback
period method
It is simple to use.
Also assist to analyse the
reliability of project.
It completely ignore the time
value of money concept
It also did not covered all cash
Paraphrase This Document
Need a fresh take? Get an instant paraphrase of this document with our AI Paraphraser
flows.
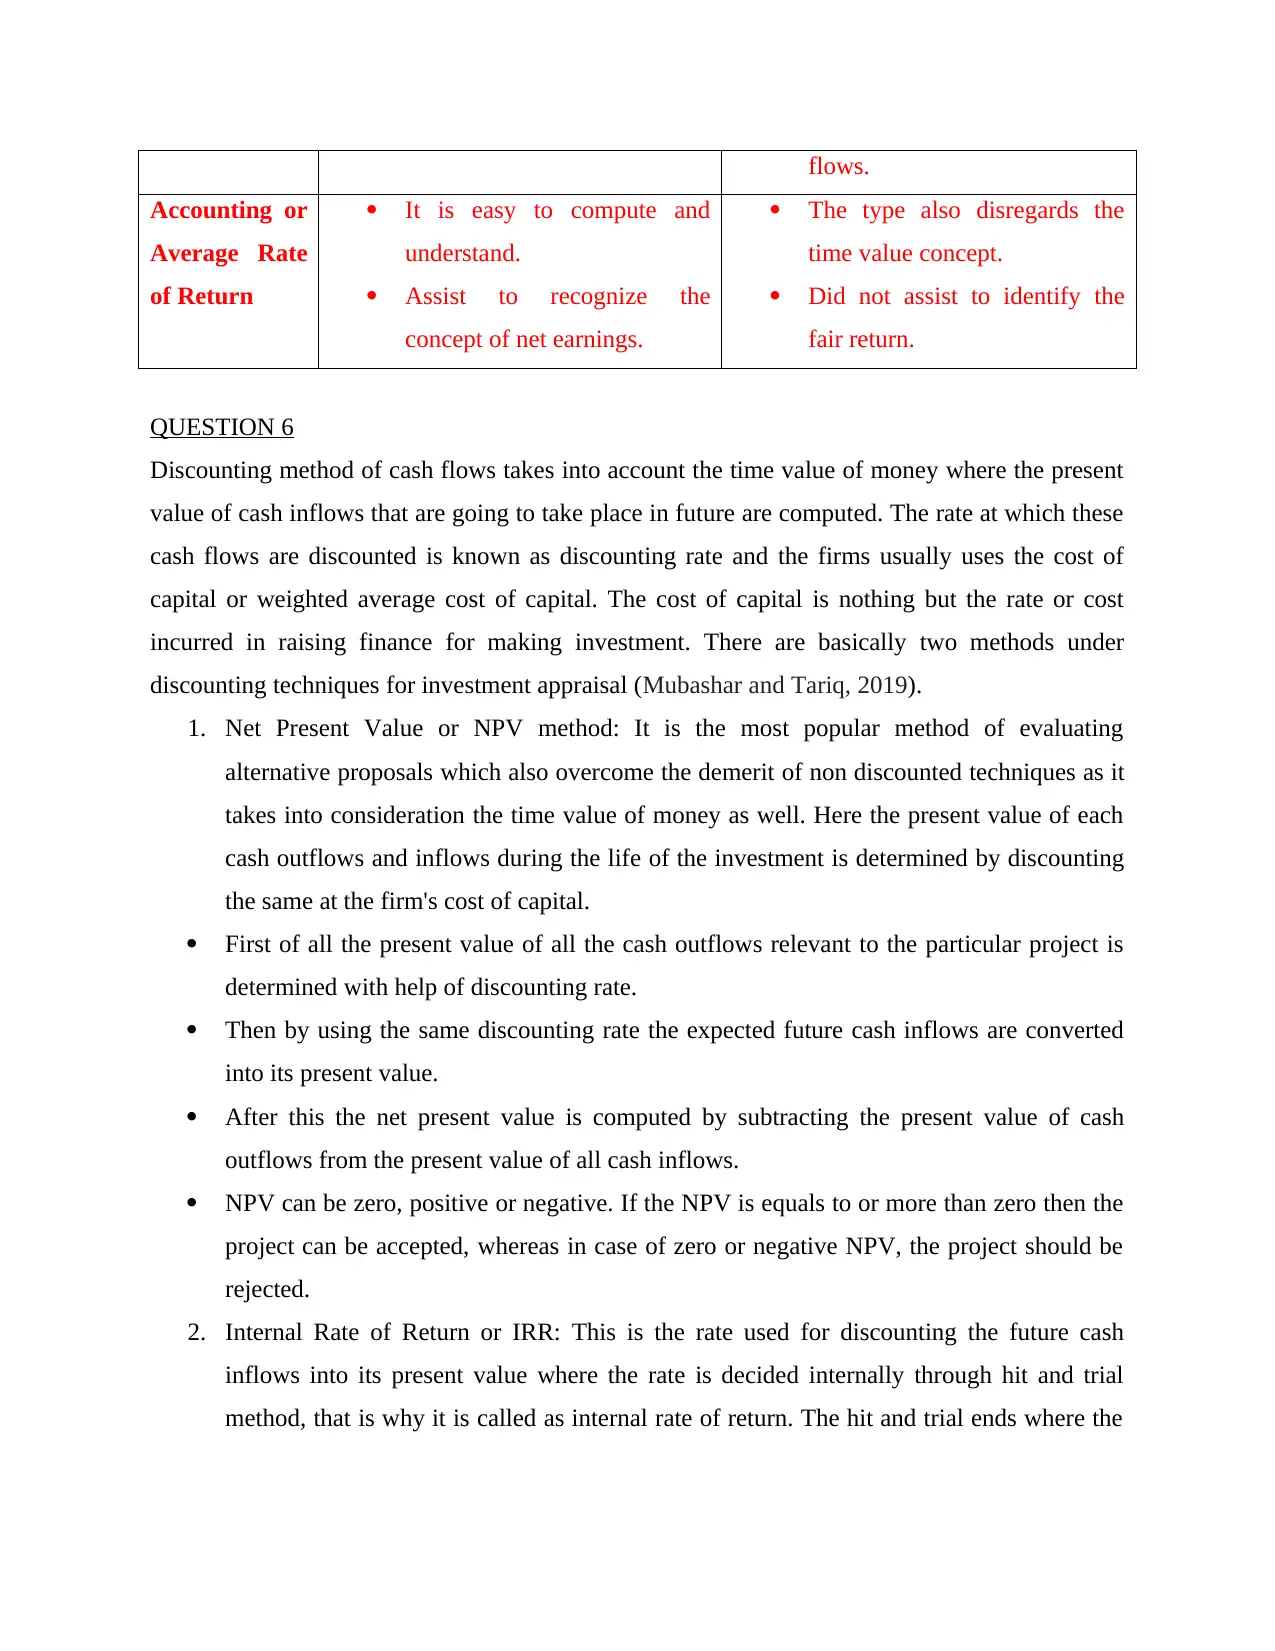
Accounting or
Average Rate
of Return
It is easy to compute and
understand.
Assist to recognize the
concept of net earnings.
The type also disregards the
time value concept.
Did not assist to identify the
fair return.
QUESTION 6
Discounting method of cash flows takes into account the time value of money where the present
value of cash inflows that are going to take place in future are computed. The rate at which these
cash flows are discounted is known as discounting rate and the firms usually uses the cost of
capital or weighted average cost of capital. The cost of capital is nothing but the rate or cost
incurred in raising finance for making investment. There are basically two methods under
discounting techniques for investment appraisal (Mubashar and Tariq, 2019).
1. Net Present Value or NPV method: It is the most popular method of evaluating
alternative proposals which also overcome the demerit of non discounted techniques as it
takes into consideration the time value of money as well. Here the present value of each
cash outflows and inflows during the life of the investment is determined by discounting
the same at the firm's cost of capital.
First of all the present value of all the cash outflows relevant to the particular project is
determined with help of discounting rate.
Then by using the same discounting rate the expected future cash inflows are converted
into its present value.
After this the net present value is computed by subtracting the present value of cash
outflows from the present value of all cash inflows.
NPV can be zero, positive or negative. If the NPV is equals to or more than zero then the
project can be accepted, whereas in case of zero or negative NPV, the project should be
rejected.
2. Internal Rate of Return or IRR: This is the rate used for discounting the future cash
inflows into its present value where the rate is decided internally through hit and trial
method, that is why it is called as internal rate of return. The hit and trial ends where the
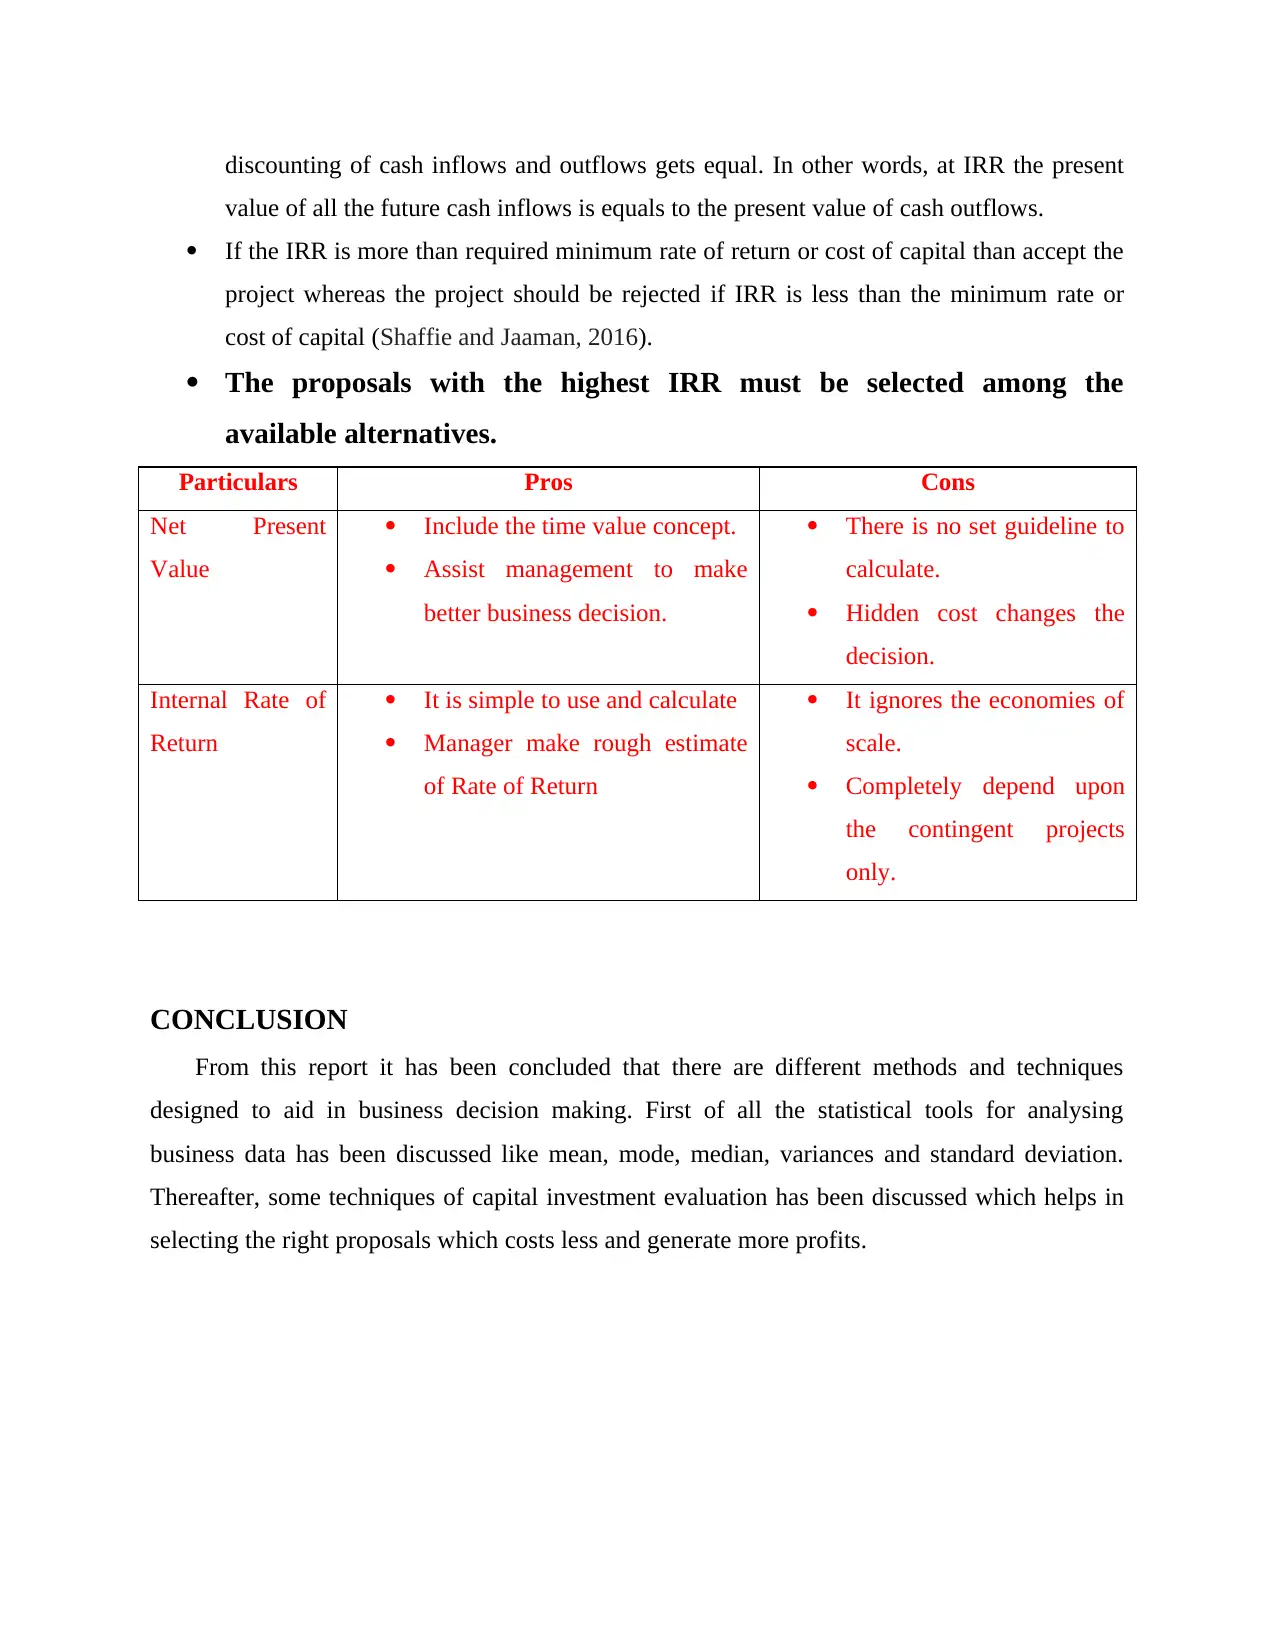
discounting of cash inflows and outflows gets equal. In other words, at IRR the present
value of all the future cash inflows is equals to the present value of cash outflows.
If the IRR is more than required minimum rate of return or cost of capital than accept the
project whereas the project should be rejected if IRR is less than the minimum rate or
cost of capital (Shaffie and Jaaman, 2016).
The proposals with the highest IRR must be selected among the
available alternatives.
Particulars Pros Cons
Net Present
Value
Include the time value concept.
Assist management to make
better business decision.
There is no set guideline to
calculate.
Hidden cost changes the
decision.
Internal Rate of
Return
It is simple to use and calculate
Manager make rough estimate
of Rate of Return
It ignores the economies of
scale.
Completely depend upon
the contingent projects
only.
CONCLUSION
From this report it has been concluded that there are different methods and techniques
designed to aid in business decision making. First of all the statistical tools for analysing
business data has been discussed like mean, mode, median, variances and standard deviation.
Thereafter, some techniques of capital investment evaluation has been discussed which helps in
selecting the right proposals which costs less and generate more profits.
⊘ This is a preview!⊘
Do you want full access?
Subscribe today to unlock all pages.
Trusted by 1+ million students worldwide
REFERENCES
Books and journals
Jiang, L., 2016. Application Analysis on Internal Rate of Return Rule for Investment Decision.
In 2016 International Conference on Humanity, Education and Social Science. Atlantis
Press.
Kenzhetayeva, Z. and Fleming, R., 2017. Building Synergies, Strengthening Fundamentals, and
Driving Leadership in Investment Decision Process within Petroleum Fields. In Abu Dhabi
International Petroleum Exhibition & Conference. Society of Petroleum Engineers.
Lima, A. C., and et. at. 2017. A qualitative analysis of capital budgeting in cotton ginning
plants. Qualitative Research in Accounting & Management.
Mubashar, A. and Tariq, Y. B., 2019. Capital budgeting decision-making practices: evidence
from Pakistan. Journal of Advances in Management Research.
Shaffie, S. S. and Jaaman, S. H., 2016. Monte Carlo on net present value for capital investment
in Malaysia. Procedia-Social and Behavioral Sciences. 219.pp.688-693.
Online
Investment decisions. 2020. [ONLINE] Available Through
<https://resource.cdn.icai.org/56019bosinter45376-p8-seca-cp7.pdf>
Methods of capital budgeting: Financial Analysis.2020. [ONLINE] Available Through
<https://www.yourarticlelibrary.com/accounting/capital-budgeting/methods-of-evaluation/
discounted-methods-of-capital-budgeting-financial-analysis/68000>
10
Paraphrase This Document
Need a fresh take? Get an instant paraphrase of this document with our AI Paraphraser

11
1 out of 11
Related Documents


Your All-in-One AI-Powered Toolkit for Academic Success.
+13062052269
info@desklib.com
Available 24*7 on WhatsApp / Email
![[object Object]](/_next/static/media/star-bottom.7253800d.svg)
Unlock your academic potential
Copyright © 2020–2026 A2Z Services. All Rights Reserved. Developed and managed by ZUCOL.