Ungrouped Descriptive Statistics for Decision Making
8 Pages1232 Words118 Views
Added on 2022-12-15
About This Document
This study material provides information on ungrouped descriptive statistics for decision making. It covers the calculation of mean, minimum, standard deviation, and coefficient of variation. It also explains the concept of spread of data and the difference between mean and median. The material is relevant for the subject of Decision Making.
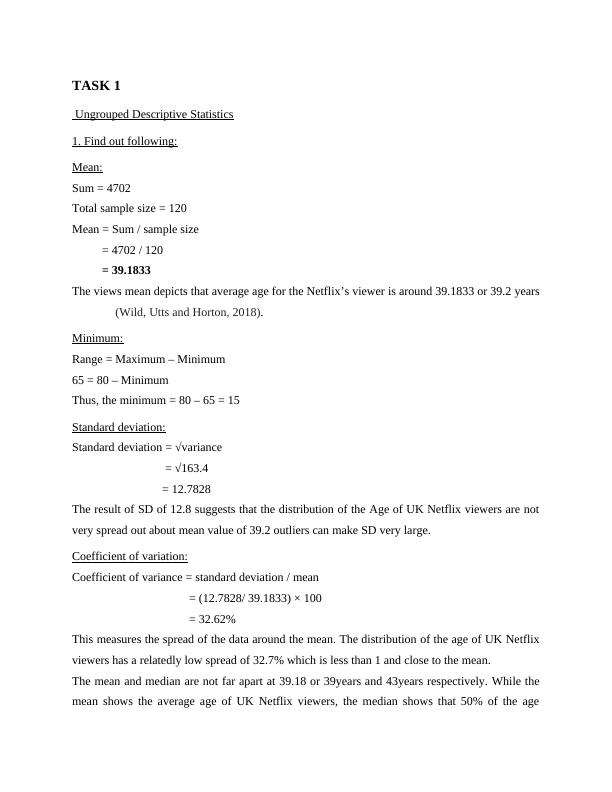
Ungrouped Descriptive Statistics for Decision Making
Added on 2022-12-15
ShareRelated Documents

End of preview
Want to access all the pages? Upload your documents or become a member.
Business Decision Making
|9
|1114
|177
Business Decision Making
|7
|894
|63
Business Decision: Analysis of Statistics and Decision Making
|9
|1055
|342
Statistical Analysis of UK Netflix Viewers: Descriptive and Inferential Statistics
|10
|1411
|89
Business Decision Making
|8
|1012
|481
Creation of Scatter Graph with Trend, Regression Equation and Coefficient of Determination
|11
|2016
|40