Arden University DAT0001B: Business Numeracy, Data and IT Assessment
VerifiedAdded on 2023/01/10
|13
|2905
|83
Homework Assignment
AI Summary
This assignment solution addresses a business numeracy, data, and IT assessment, likely for a course like DAT0001B at Arden University. It covers various aspects including basic numerical operations, calculations of central tendency, and compound interest. The solution includes detailed answers to questions involving fractions, percentages, and financial calculations. It also features a managerial report that summarizes data analysis, determining correlations between social media usage (Snapchat, Instagram, Facebook, and Twitter) using scatter diagrams, and provides graphical and numerical summaries of the data. The report includes descriptive statistics like mean, standard deviation, maximum, and minimum values for variables such as age and social media usage, with interpretations. The solution also utilizes spreadsheet applications to record and analyze numerical data, including formulas for calculations and sorting. Probability calculations are also present. The assignment requires the use of graphical techniques to present data, as well as the application of spreadsheet functions to analyze the data effectively. Overall, this assignment demonstrates a practical application of numerical and analytical skills in a business context.
Business
1
1
Paraphrase This Document
Need a fresh take? Get an instant paraphrase of this document with our AI Paraphraser
Contents
Assessment Part 1 (Section 1).........................................................................................................1
Question 1....................................................................................................................................1
Question 2....................................................................................................................................1
Question 3....................................................................................................................................1
Question 4....................................................................................................................................1
Question 5....................................................................................................................................2
Question 6....................................................................................................................................2
Question 7....................................................................................................................................2
Question 8....................................................................................................................................3
Question 9....................................................................................................................................3
Question 10..................................................................................................................................3
Assessment Part 1 (Section 2).........................................................................................................4
Question 11..................................................................................................................................4
Question 12..................................................................................................................................4
Assessment Part 2 (Managerial Report)..........................................................................................5
1. Summary for each variable and commentary based on maximums, minimums, means and
standard deviations......................................................................................................................5
2. Determining if there is any correlation between Snap Chat and Instagram users, and
between Instagram and Facebook users using scatter diagrams..................................................7
3. Additional graphical and numerical summaries......................................................................9
4. Determining probability that a student chosen at random will be studying in London and be
spending at least 2 hours on social media daily.........................................................................11
2
Assessment Part 1 (Section 1)
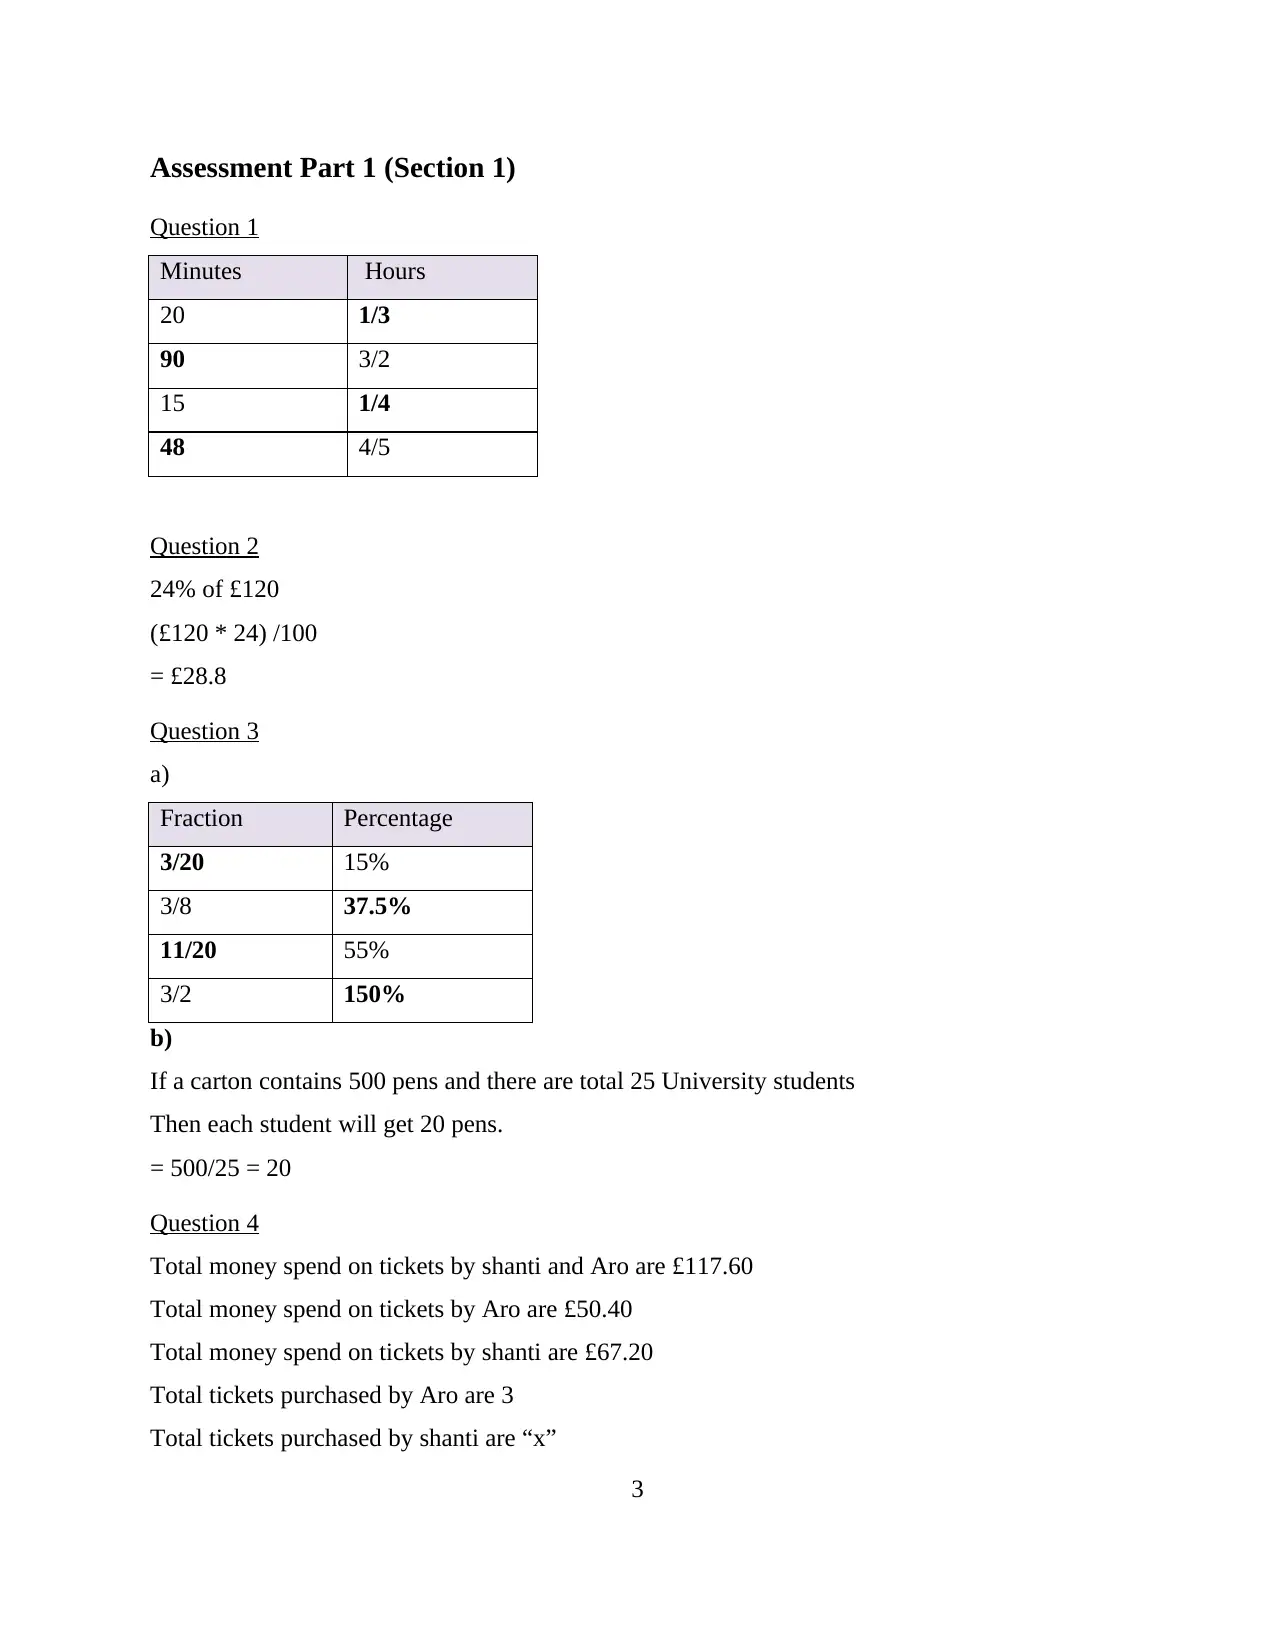
Question 1
Minutes Hours
20 1/3
90 3/2
15 1/4
48 4/5
Question 2
24% of £120
(£120 * 24) /100
= £28.8
Question 3
a)
Fraction Percentage
3/20 15%
3/8 37.5%
11/20 55%
3/2 150%
b)
If a carton contains 500 pens and there are total 25 University students
Then each student will get 20 pens.
= 500/25 = 20
Question 4
Total money spend on tickets by shanti and Aro are £117.60
Total money spend on tickets by Aro are £50.40
Total money spend on tickets by shanti are £67.20
Total tickets purchased by Aro are 3
Total tickets purchased by shanti are “x”
3
⊘ This is a preview!⊘
Do you want full access?
Subscribe today to unlock all pages.
Trusted by 1+ million students worldwide
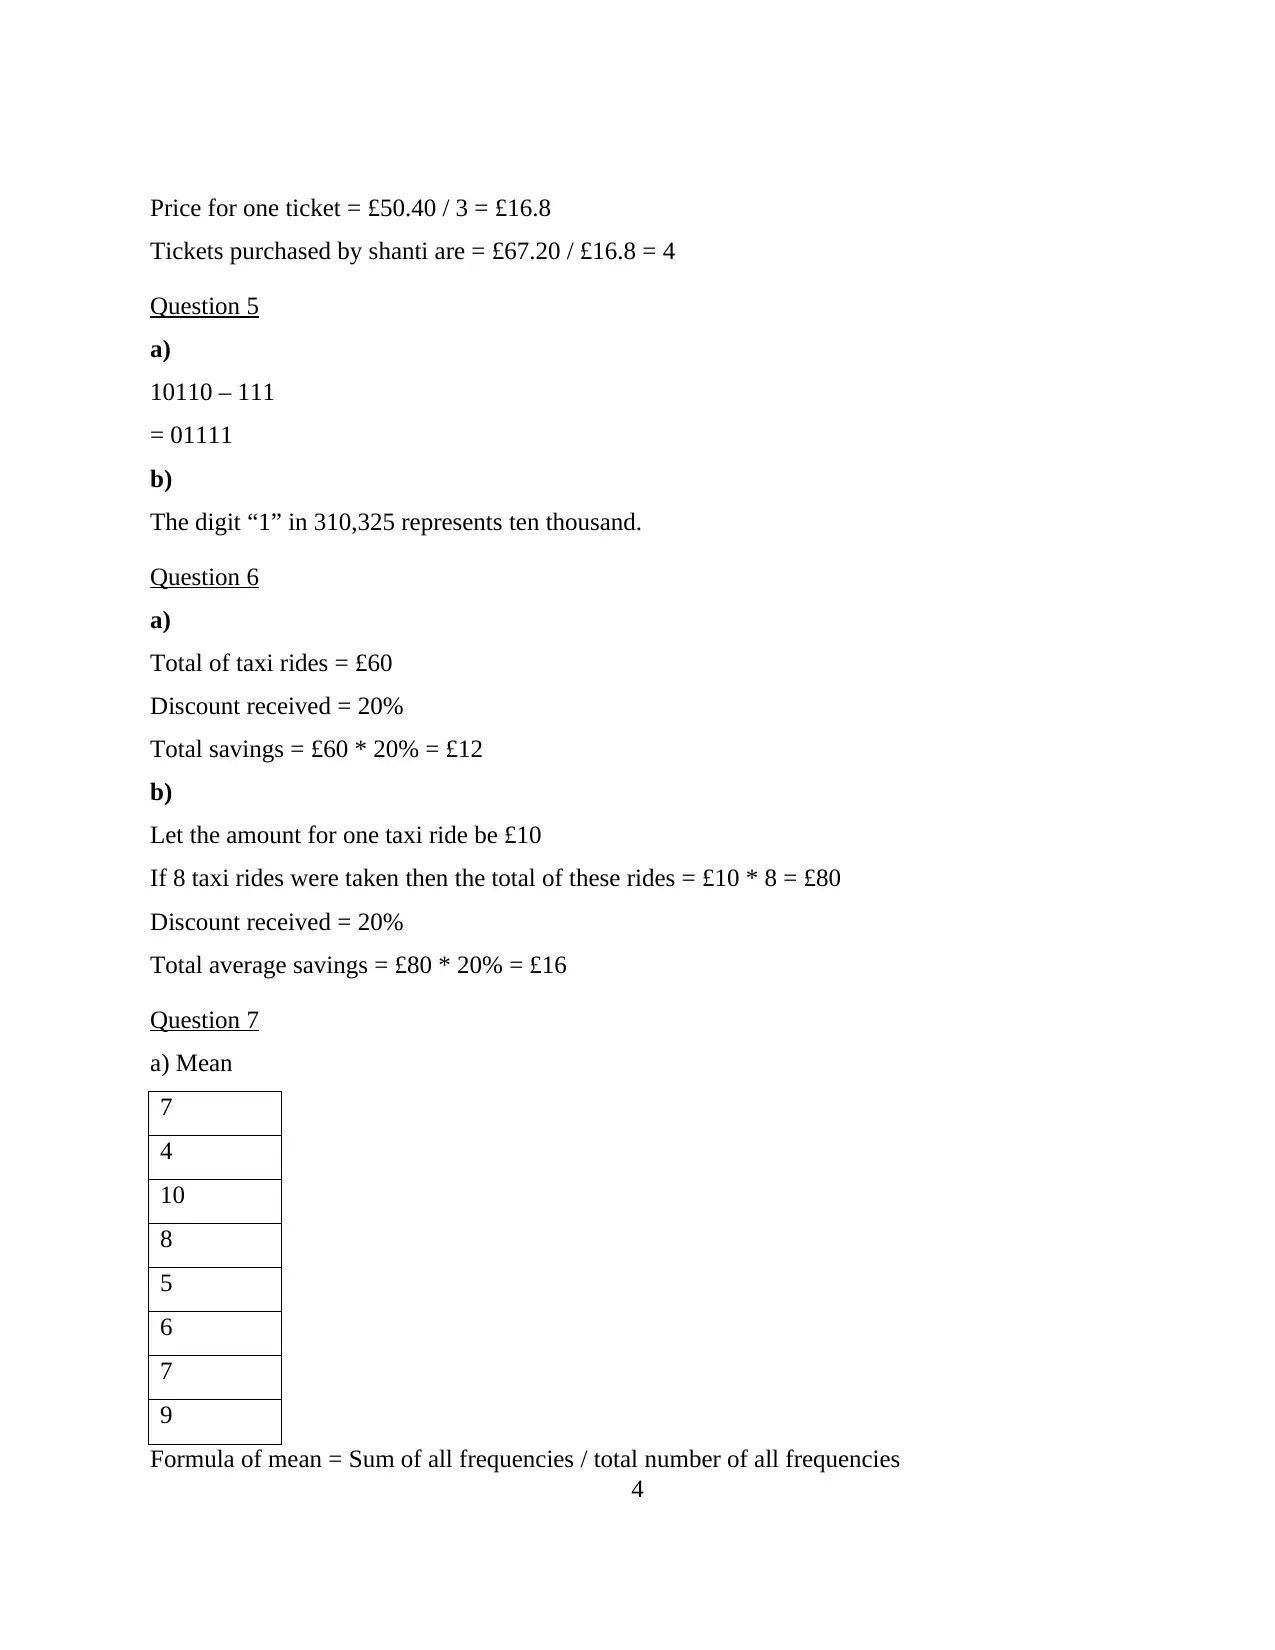
Price for one ticket = £50.40 / 3 = £16.8
Tickets purchased by shanti are = £67.20 / £16.8 = 4
Question 5
a)
10110 – 111
= 01111
b)
The digit “1” in 310,325 represents ten thousand.
Question 6
a)
Total of taxi rides = £60
Discount received = 20%
Total savings = £60 * 20% = £12
b)
Let the amount for one taxi ride be £10
If 8 taxi rides were taken then the total of these rides = £10 * 8 = £80
Discount received = 20%
Total average savings = £80 * 20% = £16
Question 7
a) Mean
7
4
10
8
5
6
7
9
Formula of mean = Sum of all frequencies / total number of all frequencies
4
Paraphrase This Document
Need a fresh take? Get an instant paraphrase of this document with our AI Paraphraser
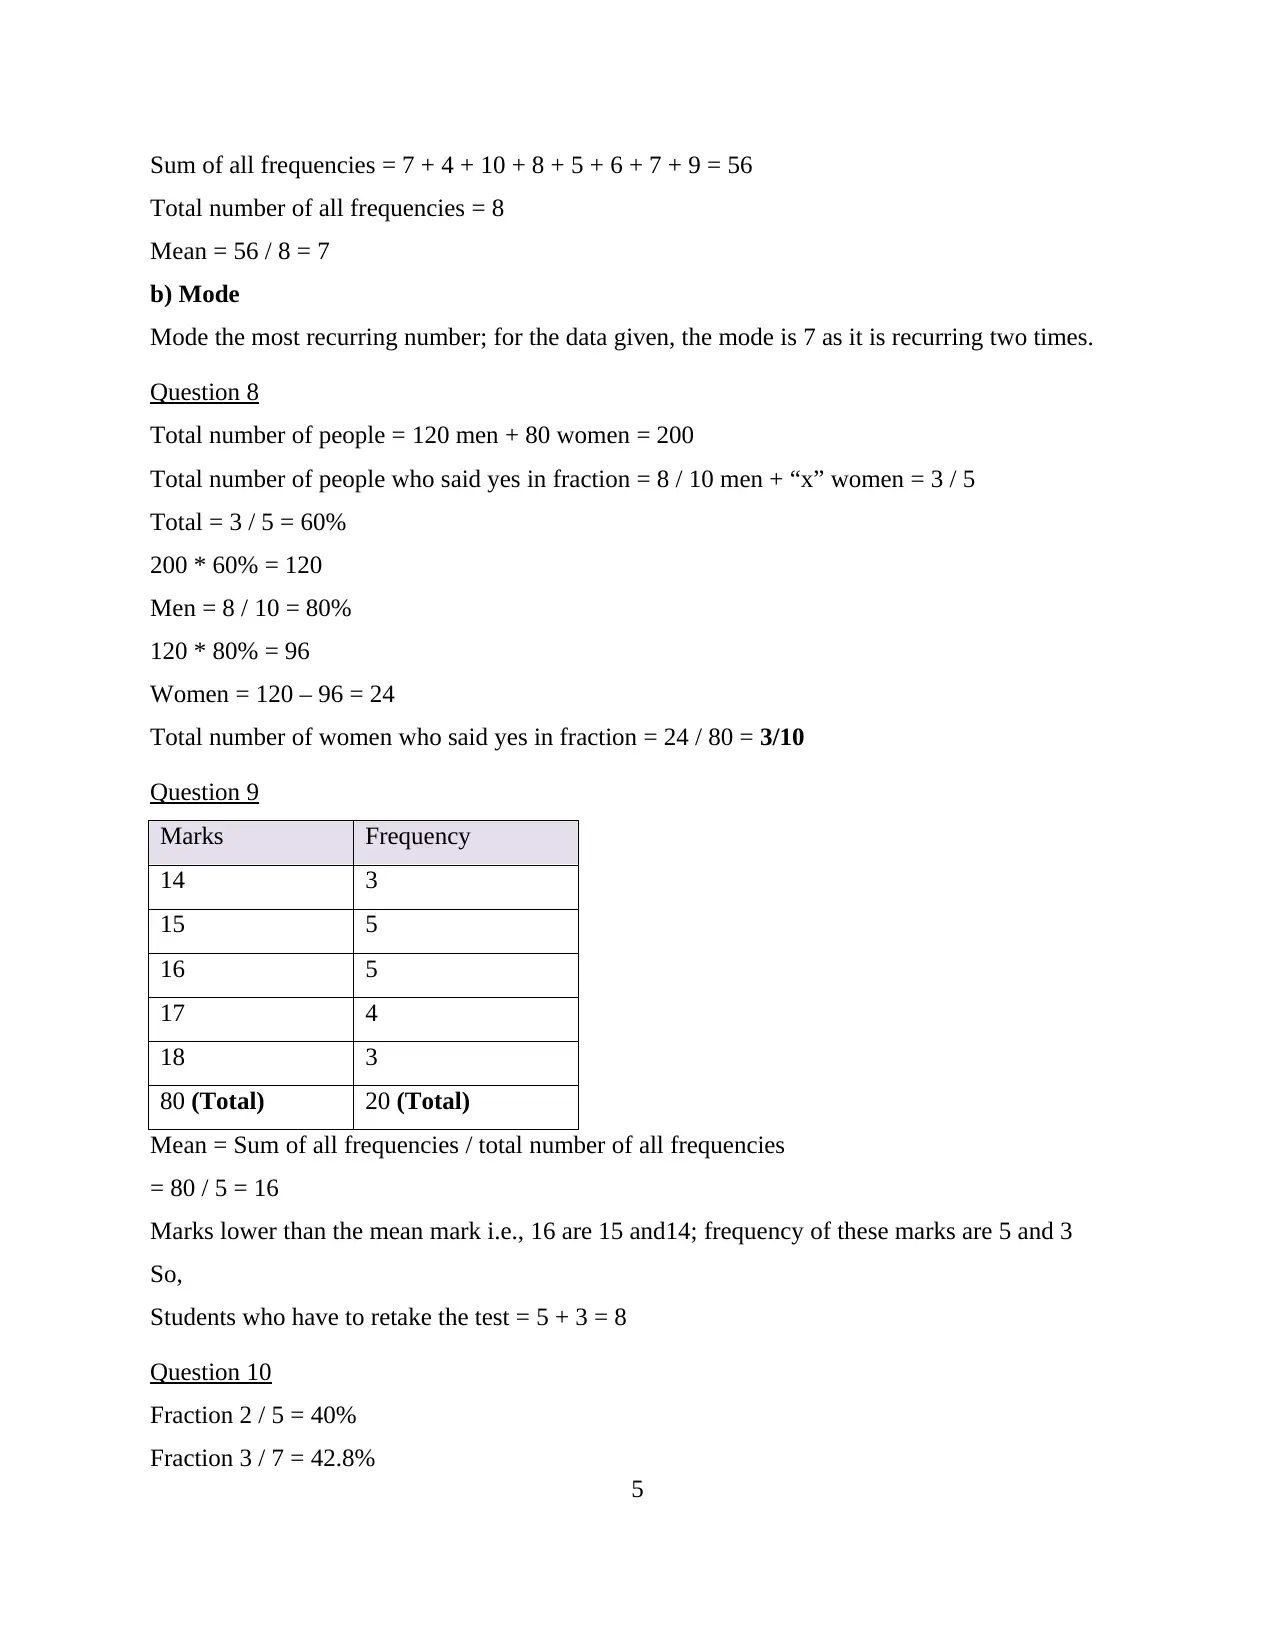
Sum of all frequencies = 7 + 4 + 10 + 8 + 5 + 6 + 7 + 9 = 56
Total number of all frequencies = 8
Mean = 56 / 8 = 7
b) Mode
Mode the most recurring number; for the data given, the mode is 7 as it is recurring two times.
Question 8
Total number of people = 120 men + 80 women = 200
Total number of people who said yes in fraction = 8 / 10 men + “x” women = 3 / 5
Total = 3 / 5 = 60%
200 * 60% = 120
Men = 8 / 10 = 80%
120 * 80% = 96
Women = 120 – 96 = 24
Total number of women who said yes in fraction = 24 / 80 = 3/10
Question 9
Marks Frequency
14 3
15 5
16 5
17 4
18 3
80 (Total) 20 (Total)
Mean = Sum of all frequencies / total number of all frequencies
= 80 / 5 = 16
Marks lower than the mean mark i.e., 16 are 15 and14; frequency of these marks are 5 and 3
So,
Students who have to retake the test = 5 + 3 = 8
Question 10
Fraction 2 / 5 = 40%
Fraction 3 / 7 = 42.8%
5
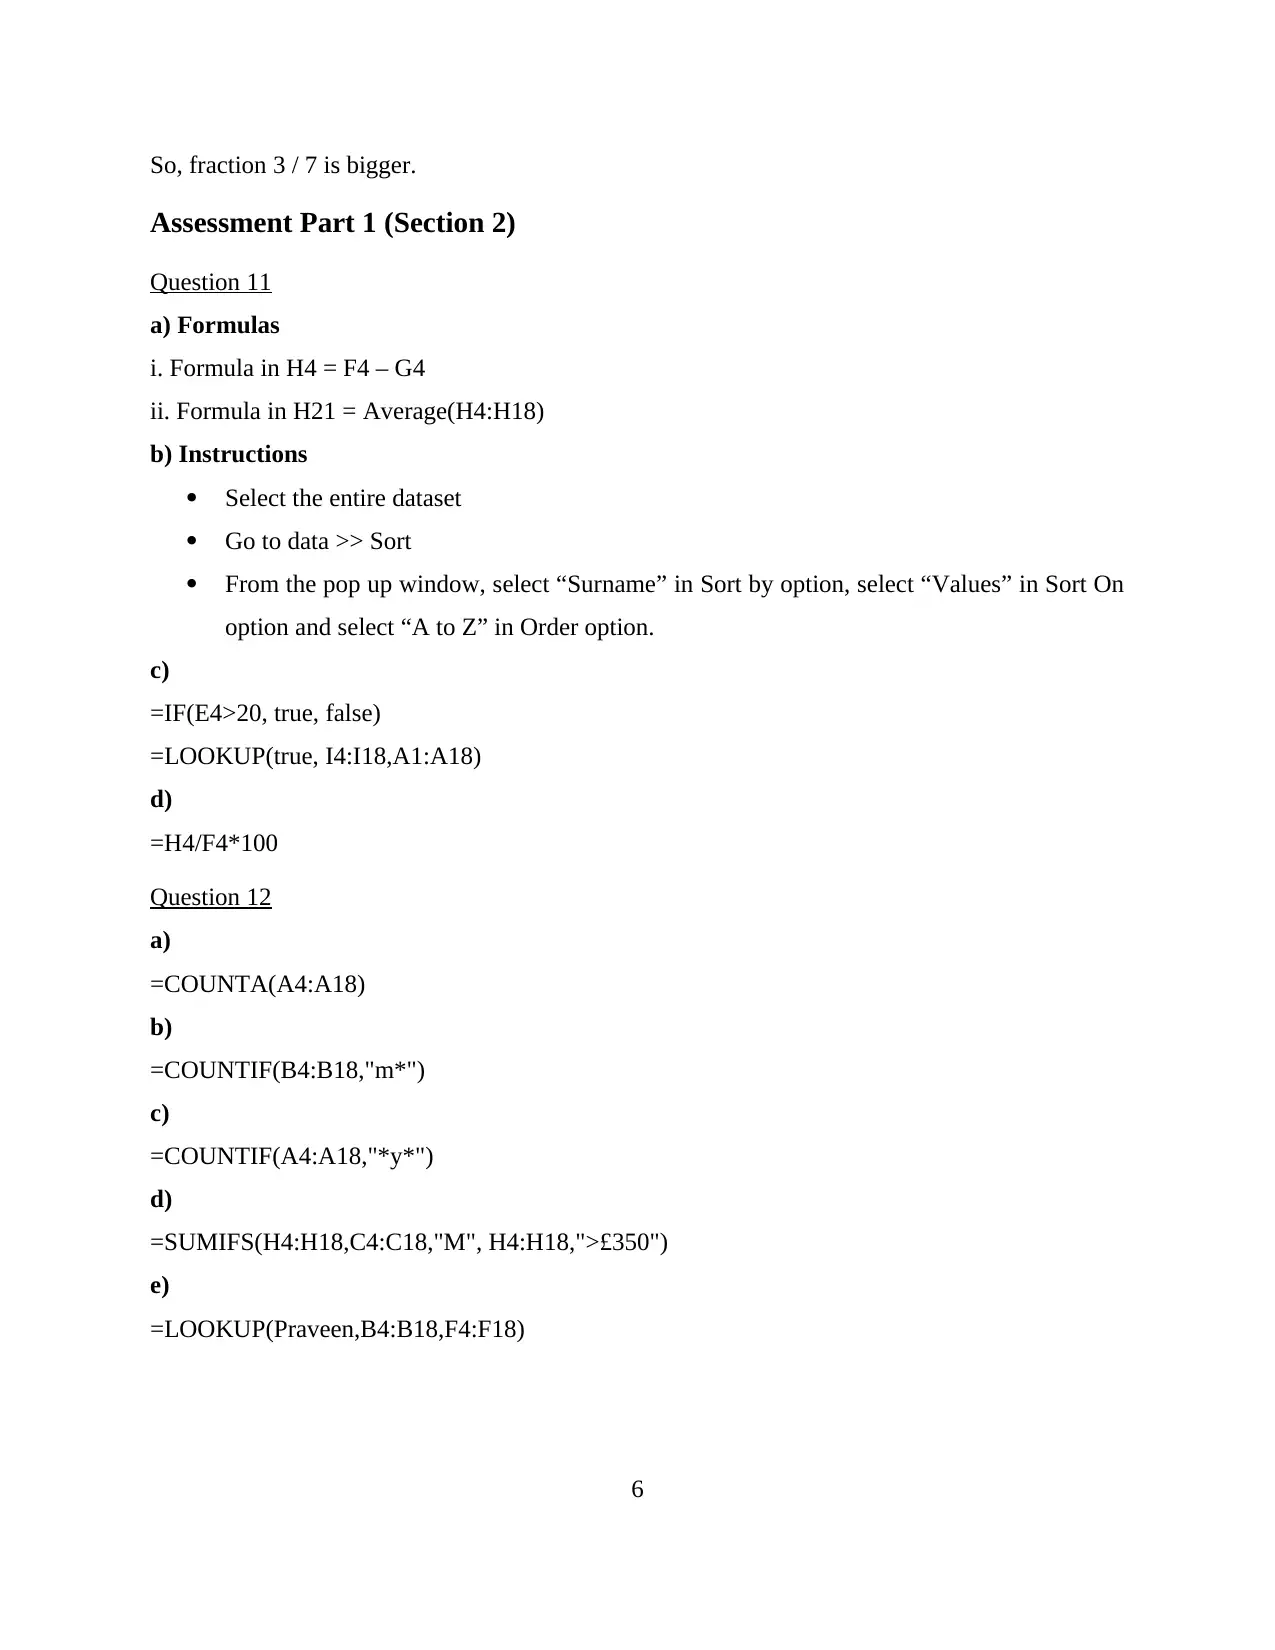
So, fraction 3 / 7 is bigger.
Assessment Part 1 (Section 2)
Question 11
a) Formulas
i. Formula in H4 = F4 – G4
ii. Formula in H21 = Average(H4:H18)
b) Instructions
Select the entire dataset
Go to data >> Sort
From the pop up window, select “Surname” in Sort by option, select “Values” in Sort On
option and select “A to Z” in Order option.
c)
=IF(E4>20, true, false)
=LOOKUP(true, I4:I18,A1:A18)
d)
=H4/F4*100
Question 12
a)
=COUNTA(A4:A18)
b)
=COUNTIF(B4:B18,"m*")
c)
=COUNTIF(A4:A18,"*y*")
d)
=SUMIFS(H4:H18,C4:C18,"M", H4:H18,">£350")
e)
=LOOKUP(Praveen,B4:B18,F4:F18)
6
⊘ This is a preview!⊘
Do you want full access?
Subscribe today to unlock all pages.
Trusted by 1+ million students worldwide
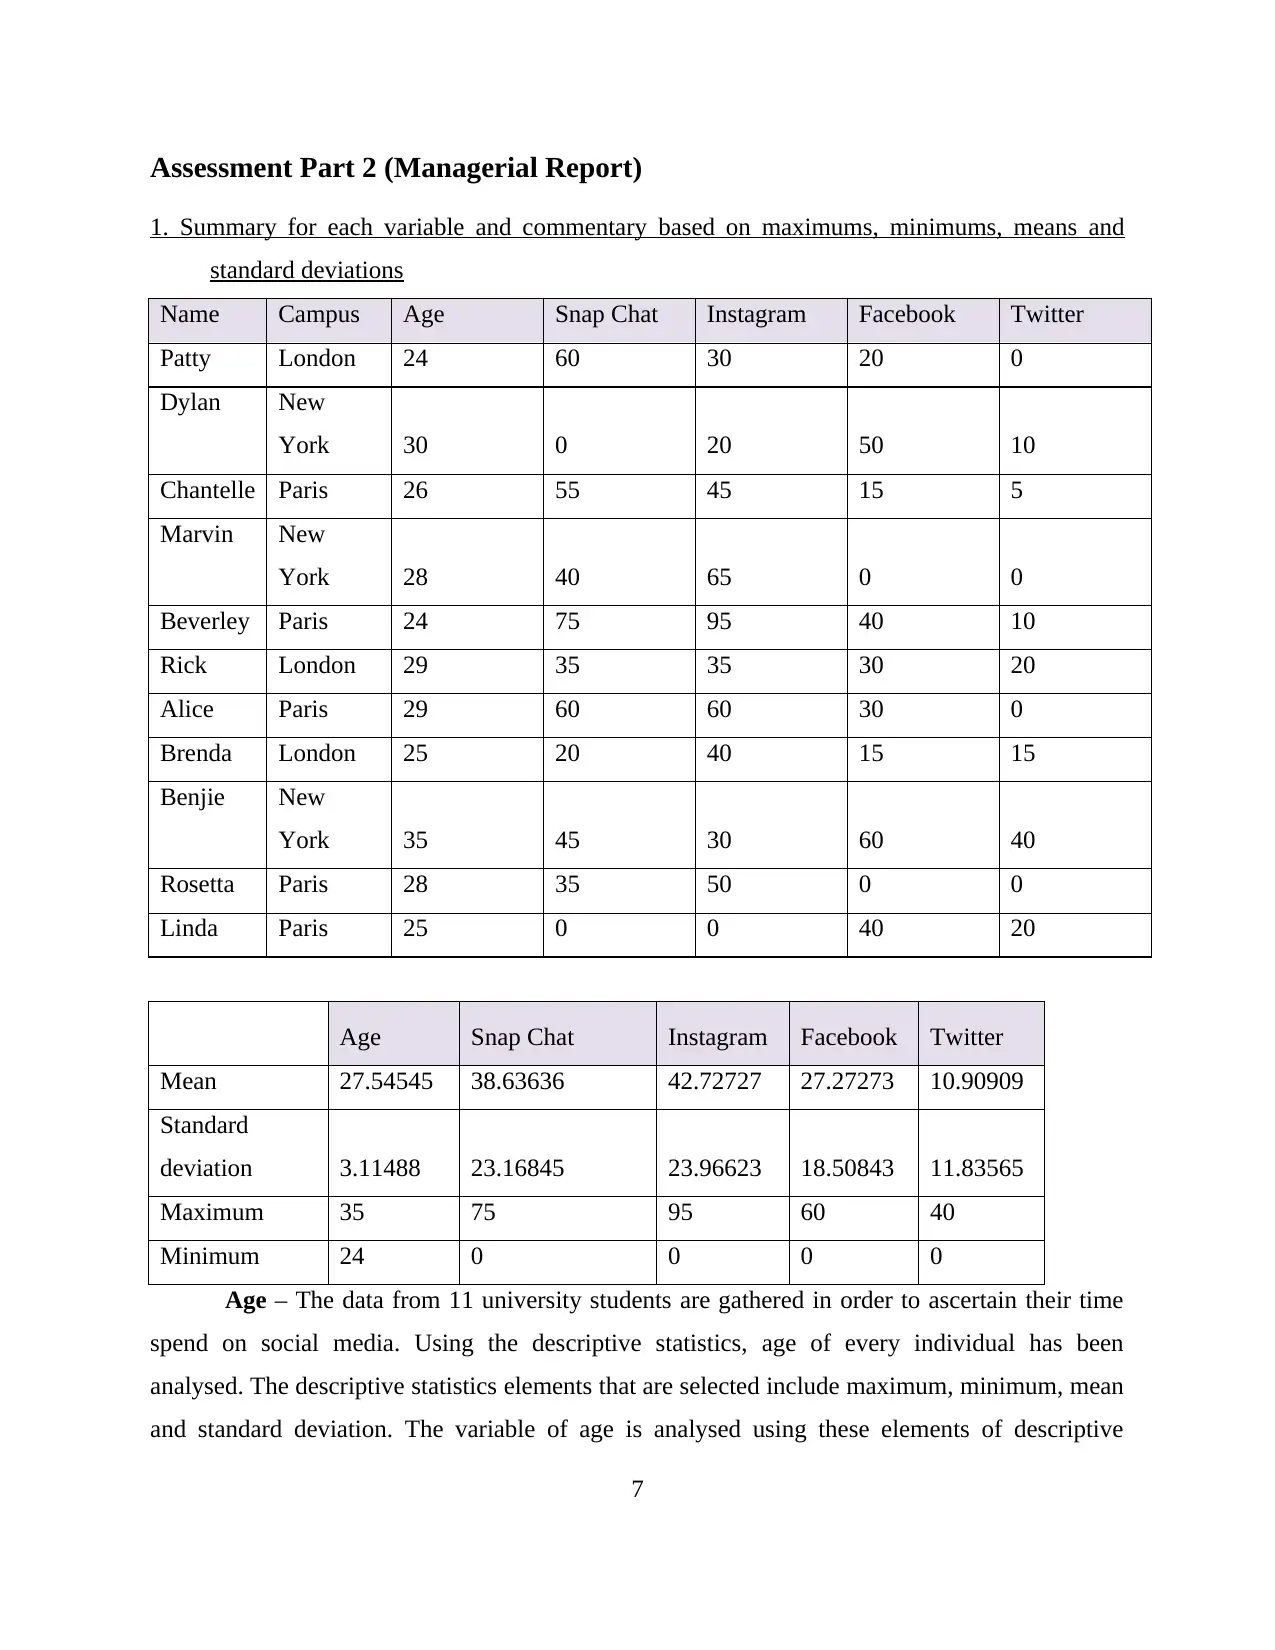
Assessment Part 2 (Managerial Report)
1. Summary for each variable and commentary based on maximums, minimums, means and
standard deviations
Name Campus Age Snap Chat Instagram Facebook Twitter
Patty London 24 60 30 20 0
Dylan New
York 30 0 20 50 10
Chantelle Paris 26 55 45 15 5
Marvin New
York 28 40 65 0 0
Beverley Paris 24 75 95 40 10
Rick London 29 35 35 30 20
Alice Paris 29 60 60 30 0
Brenda London 25 20 40 15 15
Benjie New
York 35 45 30 60 40
Rosetta Paris 28 35 50 0 0
Linda Paris 25 0 0 40 20
Age Snap Chat Instagram Facebook Twitter
Mean 27.54545 38.63636 42.72727 27.27273 10.90909
Standard
deviation 3.11488 23.16845 23.96623 18.50843 11.83565
Maximum 35 75 95 60 40
Minimum 24 0 0 0 0
Age – The data from 11 university students are gathered in order to ascertain their time
spend on social media. Using the descriptive statistics, age of every individual has been
analysed. The descriptive statistics elements that are selected include maximum, minimum, mean
and standard deviation. The variable of age is analysed using these elements of descriptive
7
Paraphrase This Document
Need a fresh take? Get an instant paraphrase of this document with our AI Paraphraser
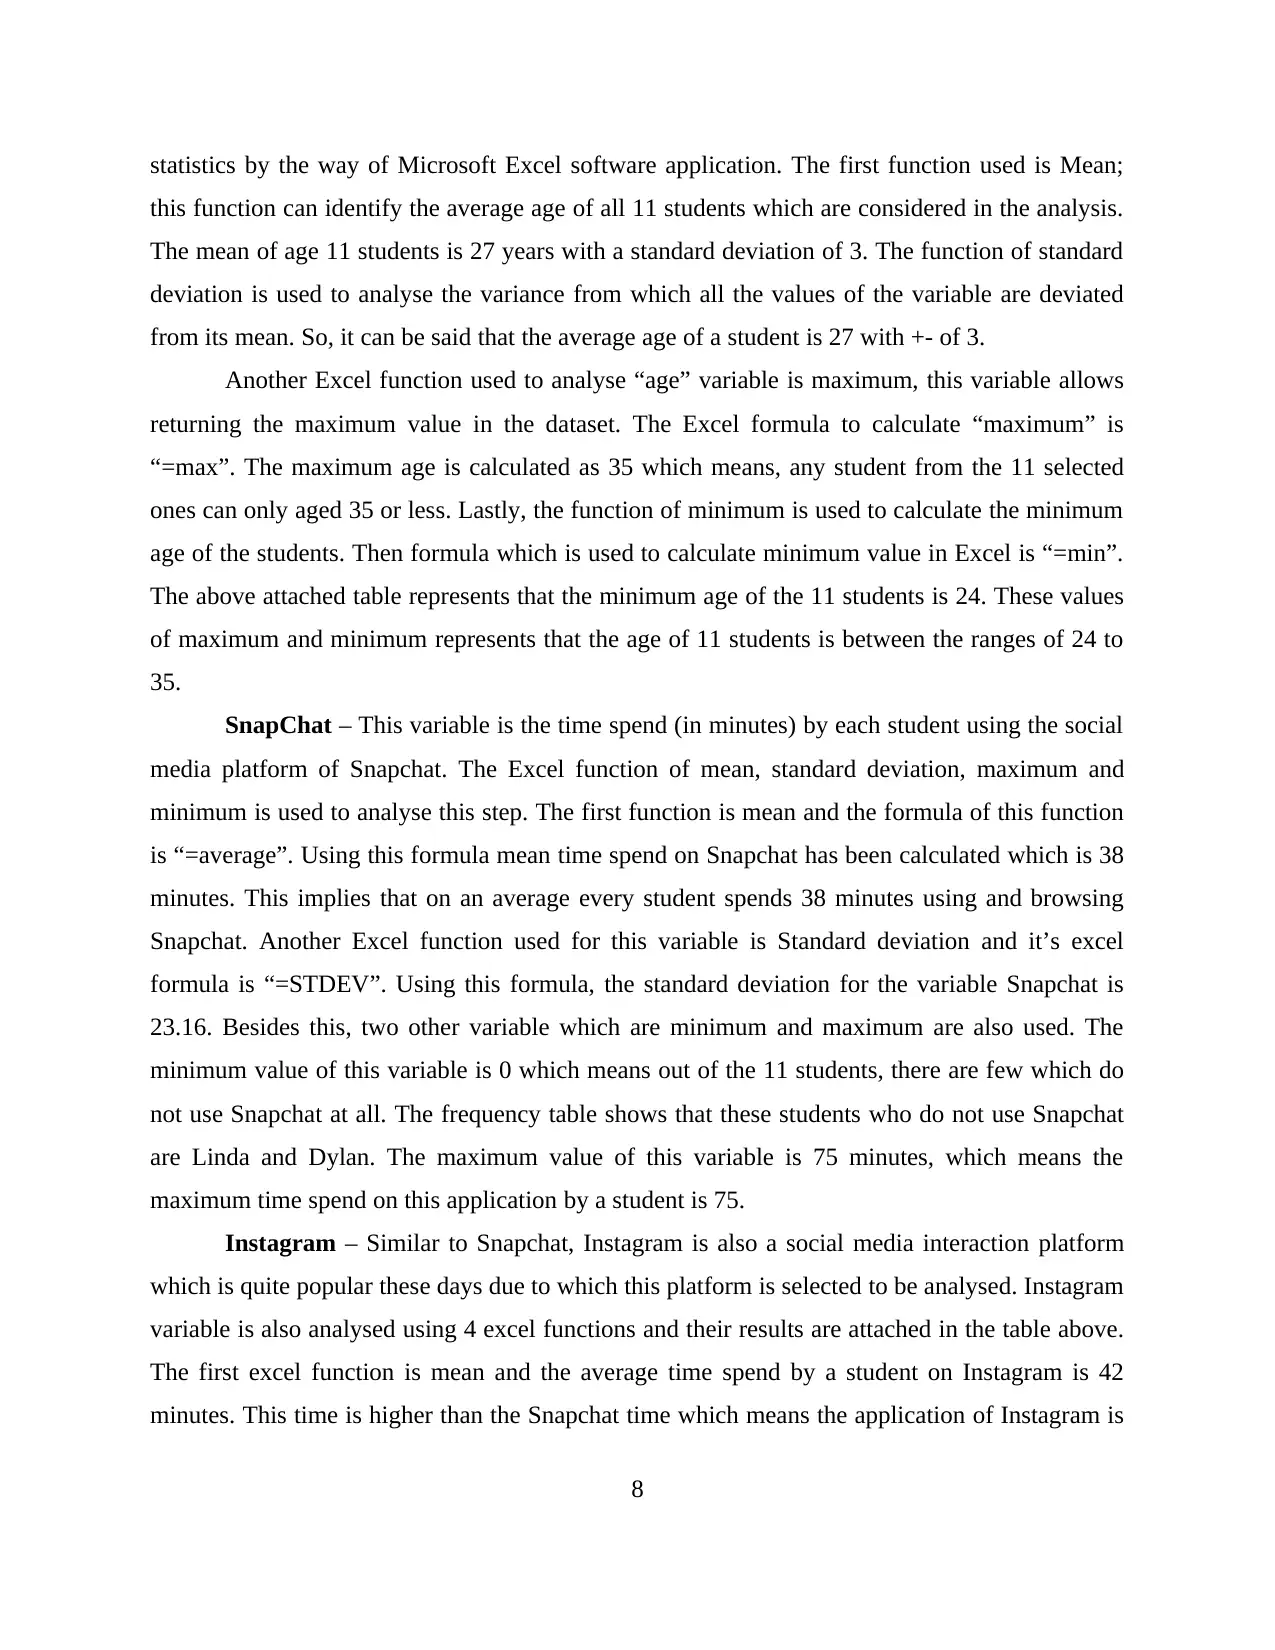
statistics by the way of Microsoft Excel software application. The first function used is Mean;
this function can identify the average age of all 11 students which are considered in the analysis.
The mean of age 11 students is 27 years with a standard deviation of 3. The function of standard
deviation is used to analyse the variance from which all the values of the variable are deviated
from its mean. So, it can be said that the average age of a student is 27 with +- of 3.
Another Excel function used to analyse “age” variable is maximum, this variable allows
returning the maximum value in the dataset. The Excel formula to calculate “maximum” is
“=max”. The maximum age is calculated as 35 which means, any student from the 11 selected
ones can only aged 35 or less. Lastly, the function of minimum is used to calculate the minimum
age of the students. Then formula which is used to calculate minimum value in Excel is “=min”.
The above attached table represents that the minimum age of the 11 students is 24. These values
of maximum and minimum represents that the age of 11 students is between the ranges of 24 to
35.
SnapChat – This variable is the time spend (in minutes) by each student using the social
media platform of Snapchat. The Excel function of mean, standard deviation, maximum and
minimum is used to analyse this step. The first function is mean and the formula of this function
is “=average”. Using this formula mean time spend on Snapchat has been calculated which is 38
minutes. This implies that on an average every student spends 38 minutes using and browsing
Snapchat. Another Excel function used for this variable is Standard deviation and it’s excel
formula is “=STDEV”. Using this formula, the standard deviation for the variable Snapchat is
23.16. Besides this, two other variable which are minimum and maximum are also used. The
minimum value of this variable is 0 which means out of the 11 students, there are few which do
not use Snapchat at all. The frequency table shows that these students who do not use Snapchat
are Linda and Dylan. The maximum value of this variable is 75 minutes, which means the
maximum time spend on this application by a student is 75.
Instagram – Similar to Snapchat, Instagram is also a social media interaction platform
which is quite popular these days due to which this platform is selected to be analysed. Instagram
variable is also analysed using 4 excel functions and their results are attached in the table above.
The first excel function is mean and the average time spend by a student on Instagram is 42
minutes. This time is higher than the Snapchat time which means the application of Instagram is
8
more popular among students than Snapchat. The standard deviation of this variable is 23
minutes which is similar to Snpachat.
The minimum time spend by a student on Instagram is 0 which means there are few
students among the 11, who do not use Instagram at all. The maximum time spend on this social
media platform is 95 minutes which means there are students two prefer to use Instagram for one
and a half hour in a day. This time is highest time spending on any social media platform.
Facebook – This is also a social media platform which is analysed same 4 excel
functions. The mean or average time spend by every student among 11 students on Facebook is
27 minutes. This time is lower than the above applications of Instagram and Snapchat which
means this application is not that famous than above applications among these 11 university
students. These 27 minutes is with a standard variance or deviation of 18 minutes.
The minimum and maximum value for the variable of Facebook is 0 and 60 which means
the time spent by every individual on Facebook is under the range of 0 to 60. This also implies
that are few students who does not use Facebook at all.
Twitter – For this variable, the four excel functions are used to analyse the popularity of
this social media platform by analysing the time spend on this platform by 11 university students.
The mean time spend on this application is 10 minutes which is least when compared to above
applications of Snapchat, Instagram and Facebook. This mean time of 10 minutes is along with
the standard deviation of 11 minutes. The minimum and maximum time spend by a student on
this application is 0 and 40 minutes. This implies that in case of Twitter as well, there are few
students who do not use this social media platform at all.
From the above descriptive analysis and its interpretation, few important insights are
gained which are:
Instagram is the most used social media platform and twitter is the least used social
media platform.
There are few students which do not use some of the social media platforms at all but at
least one application is used by every student among the 11 students.
2. Determining if there is any correlation between Snap Chat and Instagram users, and between
Instagram and Facebook users using scatter diagrams
Correlation between Snap Chat and Instagram users
9
⊘ This is a preview!⊘
Do you want full access?
Subscribe today to unlock all pages.
Trusted by 1+ million students worldwide
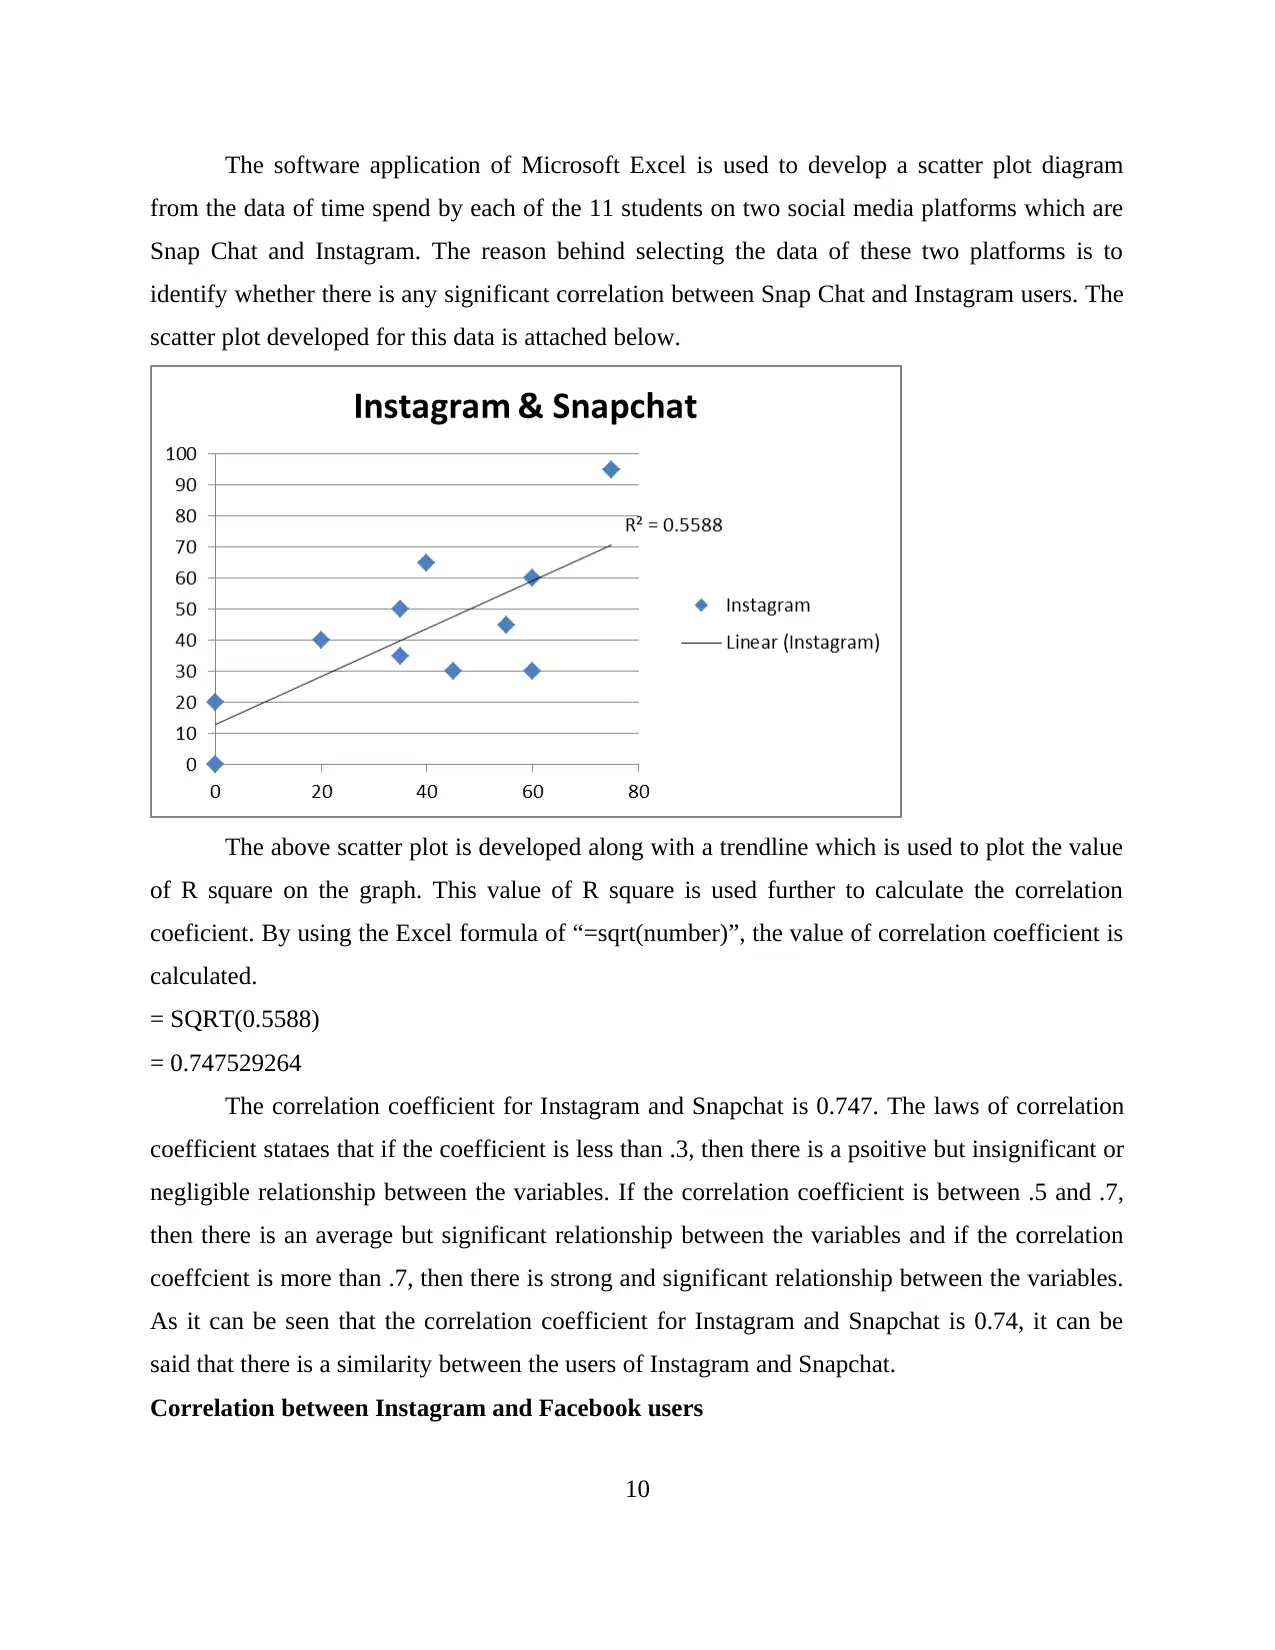
The software application of Microsoft Excel is used to develop a scatter plot diagram
from the data of time spend by each of the 11 students on two social media platforms which are
Snap Chat and Instagram. The reason behind selecting the data of these two platforms is to
identify whether there is any significant correlation between Snap Chat and Instagram users. The
scatter plot developed for this data is attached below.
The above scatter plot is developed along with a trendline which is used to plot the value
of R square on the graph. This value of R square is used further to calculate the correlation
coeficient. By using the Excel formula of “=sqrt(number)”, the value of correlation coefficient is
calculated.
= SQRT(0.5588)
= 0.747529264
The correlation coefficient for Instagram and Snapchat is 0.747. The laws of correlation
coefficient stataes that if the coefficient is less than .3, then there is a psoitive but insignificant or
negligible relationship between the variables. If the correlation coefficient is between .5 and .7,
then there is an average but significant relationship between the variables and if the correlation
coeffcient is more than .7, then there is strong and significant relationship between the variables.
As it can be seen that the correlation coefficient for Instagram and Snapchat is 0.74, it can be
said that there is a similarity between the users of Instagram and Snapchat.
Correlation between Instagram and Facebook users
10
Paraphrase This Document
Need a fresh take? Get an instant paraphrase of this document with our AI Paraphraser
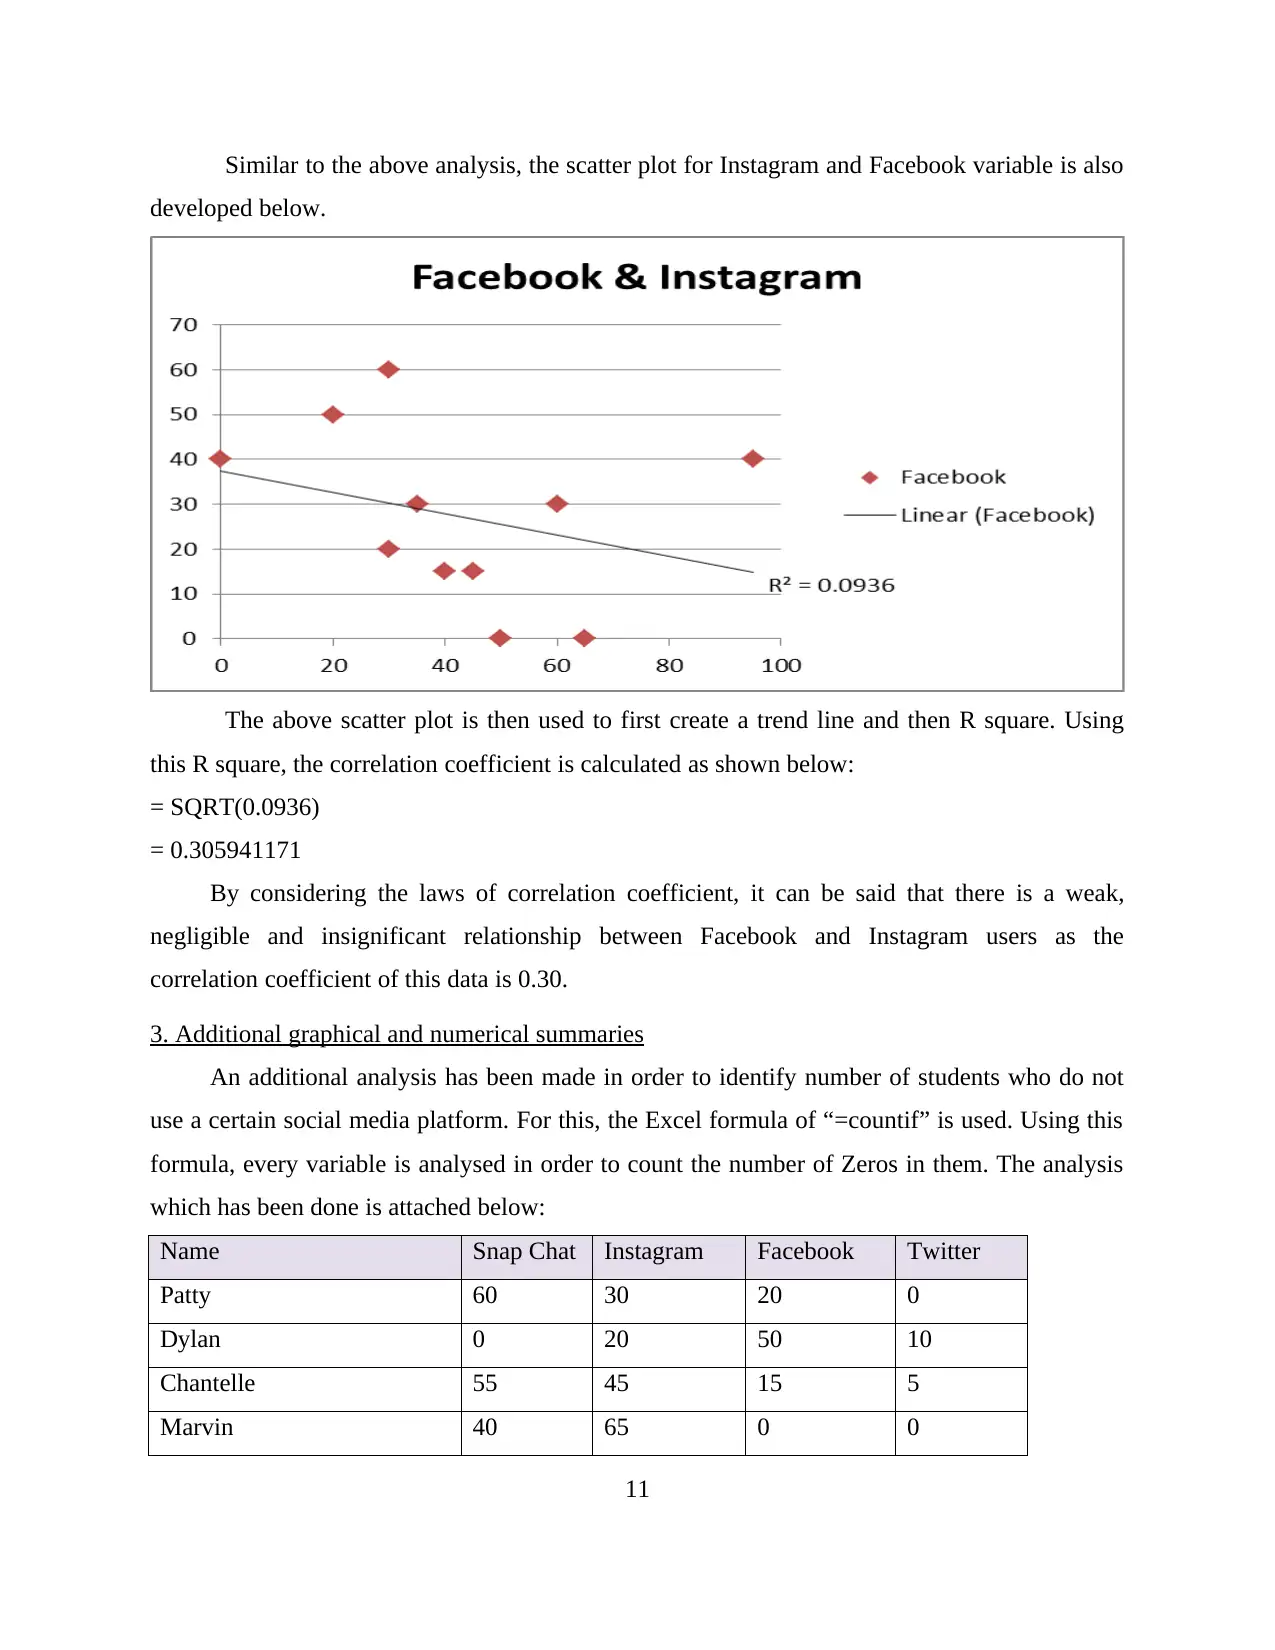
Similar to the above analysis, the scatter plot for Instagram and Facebook variable is also
developed below.
The above scatter plot is then used to first create a trend line and then R square. Using
this R square, the correlation coefficient is calculated as shown below:
= SQRT(0.0936)
= 0.305941171
By considering the laws of correlation coefficient, it can be said that there is a weak,
negligible and insignificant relationship between Facebook and Instagram users as the
correlation coefficient of this data is 0.30.
3. Additional graphical and numerical summaries
An additional analysis has been made in order to identify number of students who do not
use a certain social media platform. For this, the Excel formula of “=countif” is used. Using this
formula, every variable is analysed in order to count the number of Zeros in them. The analysis
which has been done is attached below:
Name Snap Chat Instagram Facebook Twitter
Patty 60 30 20 0
Dylan 0 20 50 10
Chantelle 55 45 15 5
Marvin 40 65 0 0
11
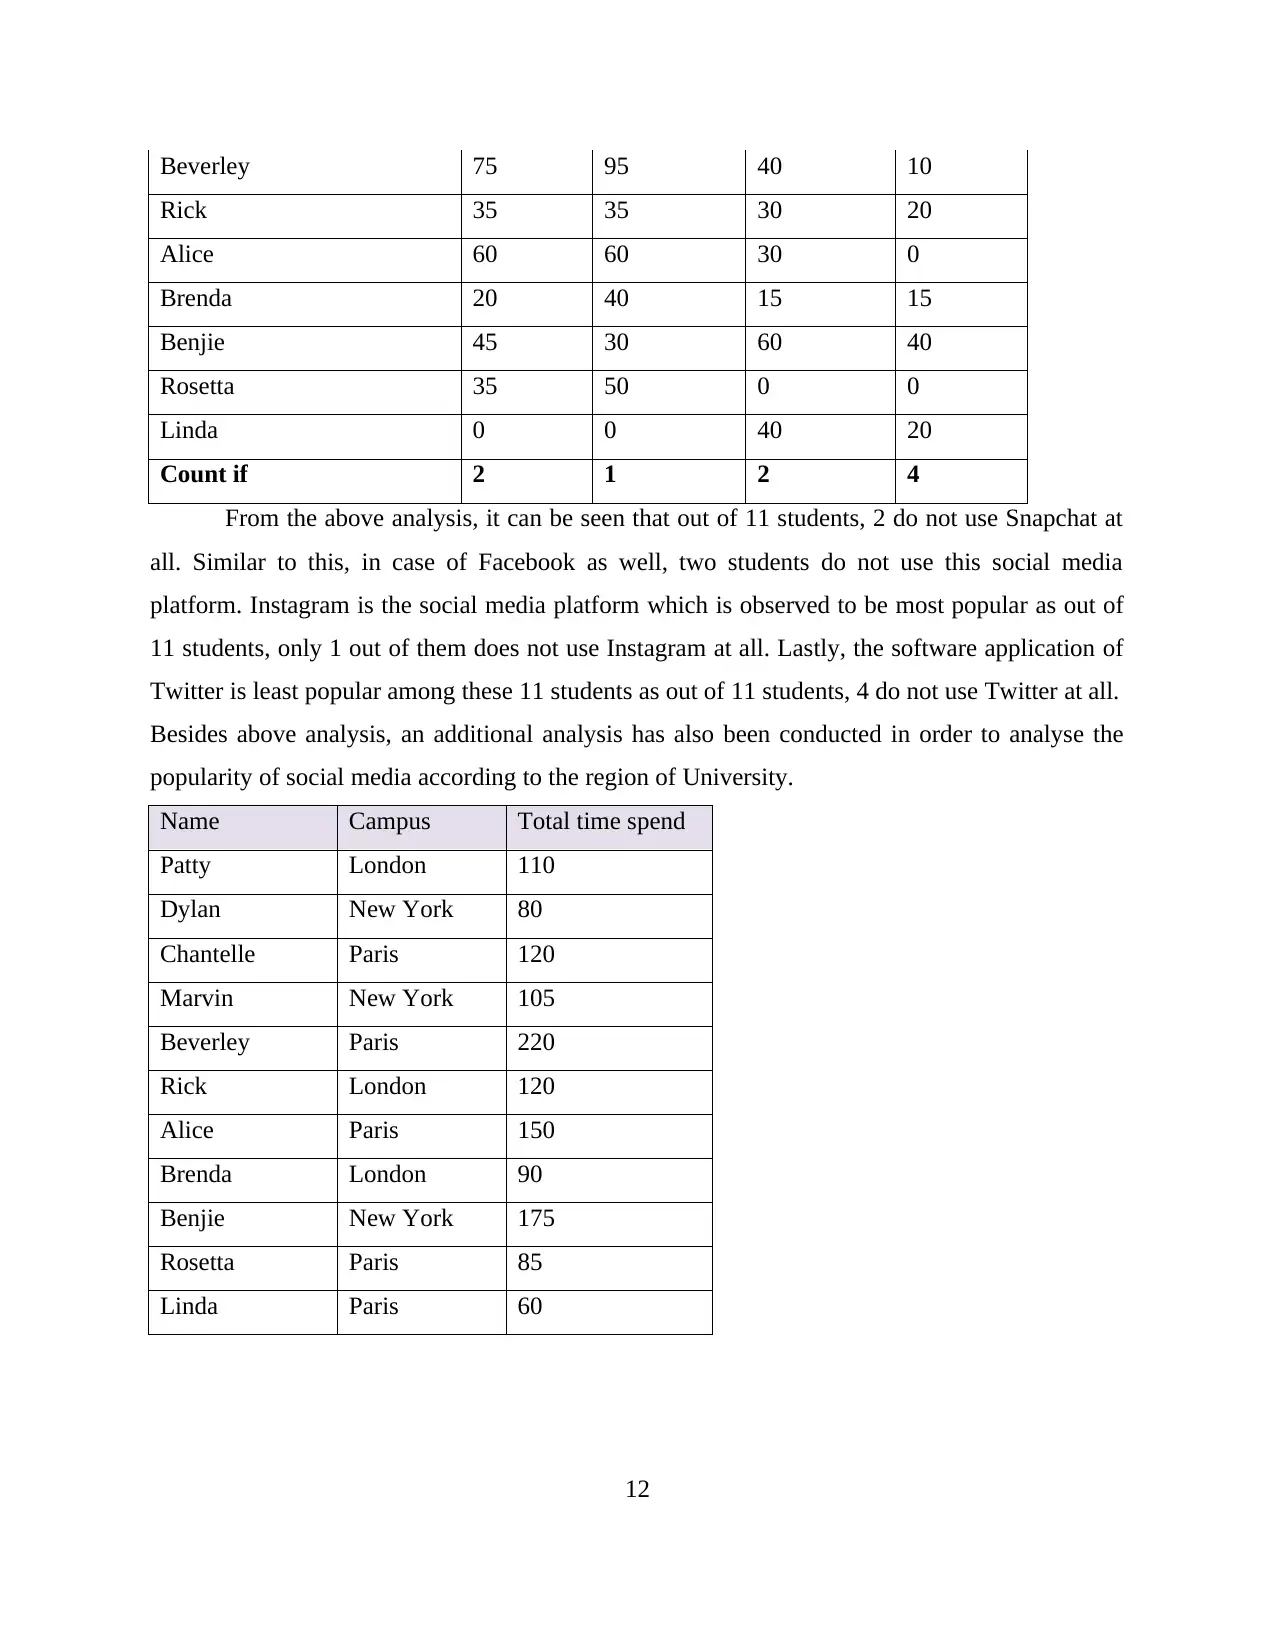
Beverley 75 95 40 10
Rick 35 35 30 20
Alice 60 60 30 0
Brenda 20 40 15 15
Benjie 45 30 60 40
Rosetta 35 50 0 0
Linda 0 0 40 20
Count if 2 1 2 4
From the above analysis, it can be seen that out of 11 students, 2 do not use Snapchat at
all. Similar to this, in case of Facebook as well, two students do not use this social media
platform. Instagram is the social media platform which is observed to be most popular as out of
11 students, only 1 out of them does not use Instagram at all. Lastly, the software application of
Twitter is least popular among these 11 students as out of 11 students, 4 do not use Twitter at all.
Besides above analysis, an additional analysis has also been conducted in order to analyse the
popularity of social media according to the region of University.
Name Campus Total time spend
Patty London 110
Dylan New York 80
Chantelle Paris 120
Marvin New York 105
Beverley Paris 220
Rick London 120
Alice Paris 150
Brenda London 90
Benjie New York 175
Rosetta Paris 85
Linda Paris 60
12
⊘ This is a preview!⊘
Do you want full access?
Subscribe today to unlock all pages.
Trusted by 1+ million students worldwide
1 out of 13
Related Documents


Your All-in-One AI-Powered Toolkit for Academic Success.
+13062052269
info@desklib.com
Available 24*7 on WhatsApp / Email
![[object Object]](/_next/static/media/star-bottom.7253800d.svg)
Unlock your academic potential
Copyright © 2020–2026 A2Z Services. All Rights Reserved. Developed and managed by ZUCOL.