Critical Analysis of Financial Health of Harvey Norman Holdings Limited
VerifiedAdded on 2023/03/31
|12
|3168
|436
AI Summary
This report provides a critical analysis of the financial health of Harvey Norman Holdings Limited and offers financial advice to a big institutional investor. It includes an evaluation of the company's profitability and operating efficiency, as well as a comparison of share price movements.
Contribute Materials
Your contribution can guide someone’s learning journey. Share your
documents today.
Running head: BUSINESS FINANCE
Business Finance
Name of the Student:
Name of the University:
Author’s Note:
Course ID:
Business Finance
Name of the Student:
Name of the University:
Author’s Note:
Course ID:
Secure Best Marks with AI Grader
Need help grading? Try our AI Grader for instant feedback on your assignments.
1BUSINESS FINANCE
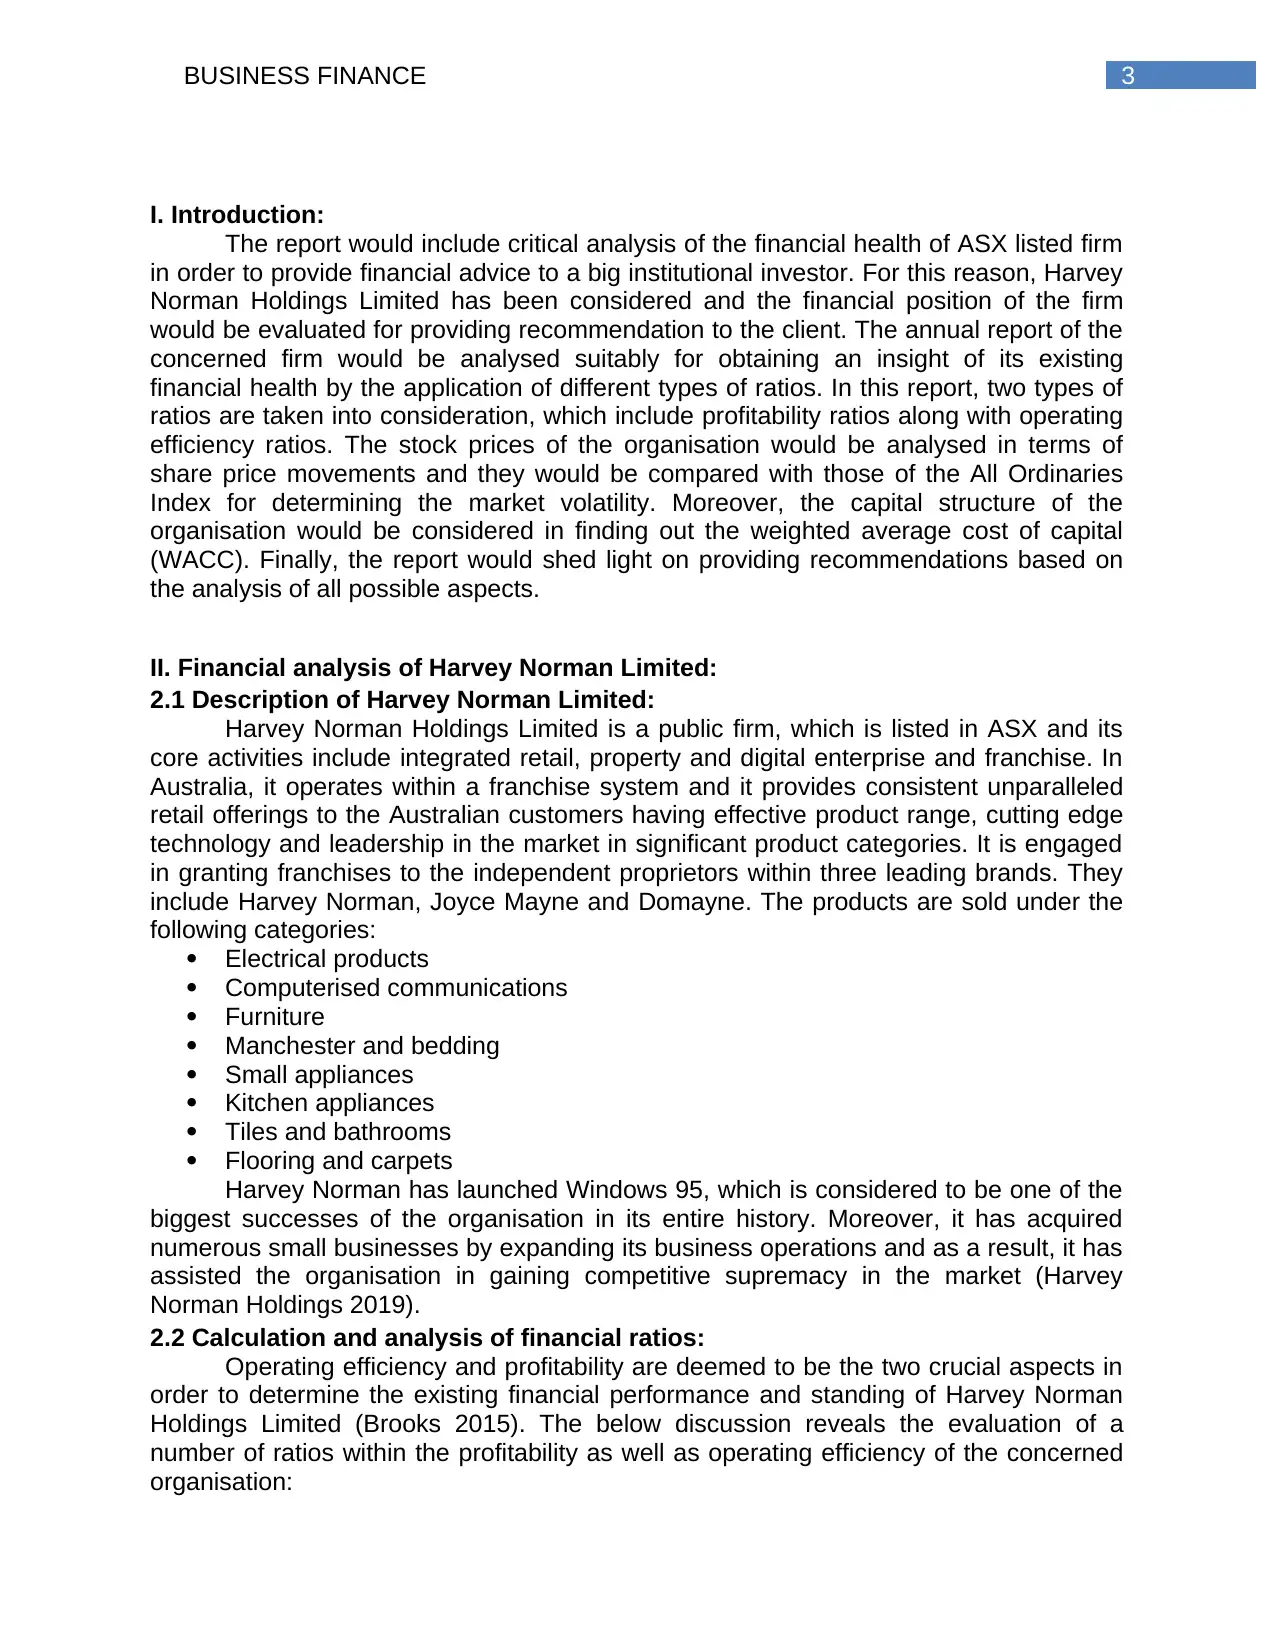
Abstract:
The report would include critical analysis of the financial health of ASX listed firm in
order to provide financial advice to a big institutional investor. For this reason, Harvey
Norman Holdings Limited has been considered and the financial position of the firm
would be evaluated for providing recommendation to the client. It has been found that
the organisation is struggling in terms of profitability; however, it has managed to
maintain its operating efficiency over the years. However, from the share price
movement, it has been identified that Harvey Norman Holdings Limited would not
provide increased returns to the shareholders, as the returns would be much lower
compared to All Ordinaries Index. Hence, the investor is recommended not to invest in
the shares of Harvey Norman Holdings Limited, as the same would minimise the overall
return on investment.
2BUSINESS FINANCE
Table of Contents
I. Introduction:....................................................................................................................3
II. Financial analysis of Harvey Norman Limited:..............................................................3
2.1 Description of Harvey Norman Limited:...................................................................3
2.2 Calculation and analysis of financial ratios:.............................................................3
2.3 Graphs and comparison of share price movements:...............................................7
2.4 Calculation of cost of equity:....................................................................................8
2.5 Identification of the capital structure:.......................................................................8
III. Conclusion:...................................................................................................................9
IV. Recommendation:........................................................................................................9
References:......................................................................................................................11
3BUSINESS FINANCE
I. Introduction:
The report would include critical analysis of the financial health of ASX listed firm
in order to provide financial advice to a big institutional investor. For this reason, Harvey
Norman Holdings Limited has been considered and the financial position of the firm
would be evaluated for providing recommendation to the client. The annual report of the
concerned firm would be analysed suitably for obtaining an insight of its existing
financial health by the application of different types of ratios. In this report, two types of
ratios are taken into consideration, which include profitability ratios along with operating
efficiency ratios. The stock prices of the organisation would be analysed in terms of
share price movements and they would be compared with those of the All Ordinaries
Index for determining the market volatility. Moreover, the capital structure of the
organisation would be considered in finding out the weighted average cost of capital
(WACC). Finally, the report would shed light on providing recommendations based on
the analysis of all possible aspects.
II. Financial analysis of Harvey Norman Limited:
2.1 Description of Harvey Norman Limited:
Harvey Norman Holdings Limited is a public firm, which is listed in ASX and its
core activities include integrated retail, property and digital enterprise and franchise. In
Australia, it operates within a franchise system and it provides consistent unparalleled
retail offerings to the Australian customers having effective product range, cutting edge
technology and leadership in the market in significant product categories. It is engaged
in granting franchises to the independent proprietors within three leading brands. They
include Harvey Norman, Joyce Mayne and Domayne. The products are sold under the
following categories:
Electrical products
Computerised communications
Furniture
Manchester and bedding
Small appliances
Kitchen appliances
Tiles and bathrooms
Flooring and carpets
Harvey Norman has launched Windows 95, which is considered to be one of the
biggest successes of the organisation in its entire history. Moreover, it has acquired
numerous small businesses by expanding its business operations and as a result, it has
assisted the organisation in gaining competitive supremacy in the market (Harvey
Norman Holdings 2019).
2.2 Calculation and analysis of financial ratios:
Operating efficiency and profitability are deemed to be the two crucial aspects in
order to determine the existing financial performance and standing of Harvey Norman
Holdings Limited (Brooks 2015). The below discussion reveals the evaluation of a
number of ratios within the profitability as well as operating efficiency of the concerned
organisation:
Secure Best Marks with AI Grader
Need help grading? Try our AI Grader for instant feedback on your assignments.
4BUSINESS FINANCE
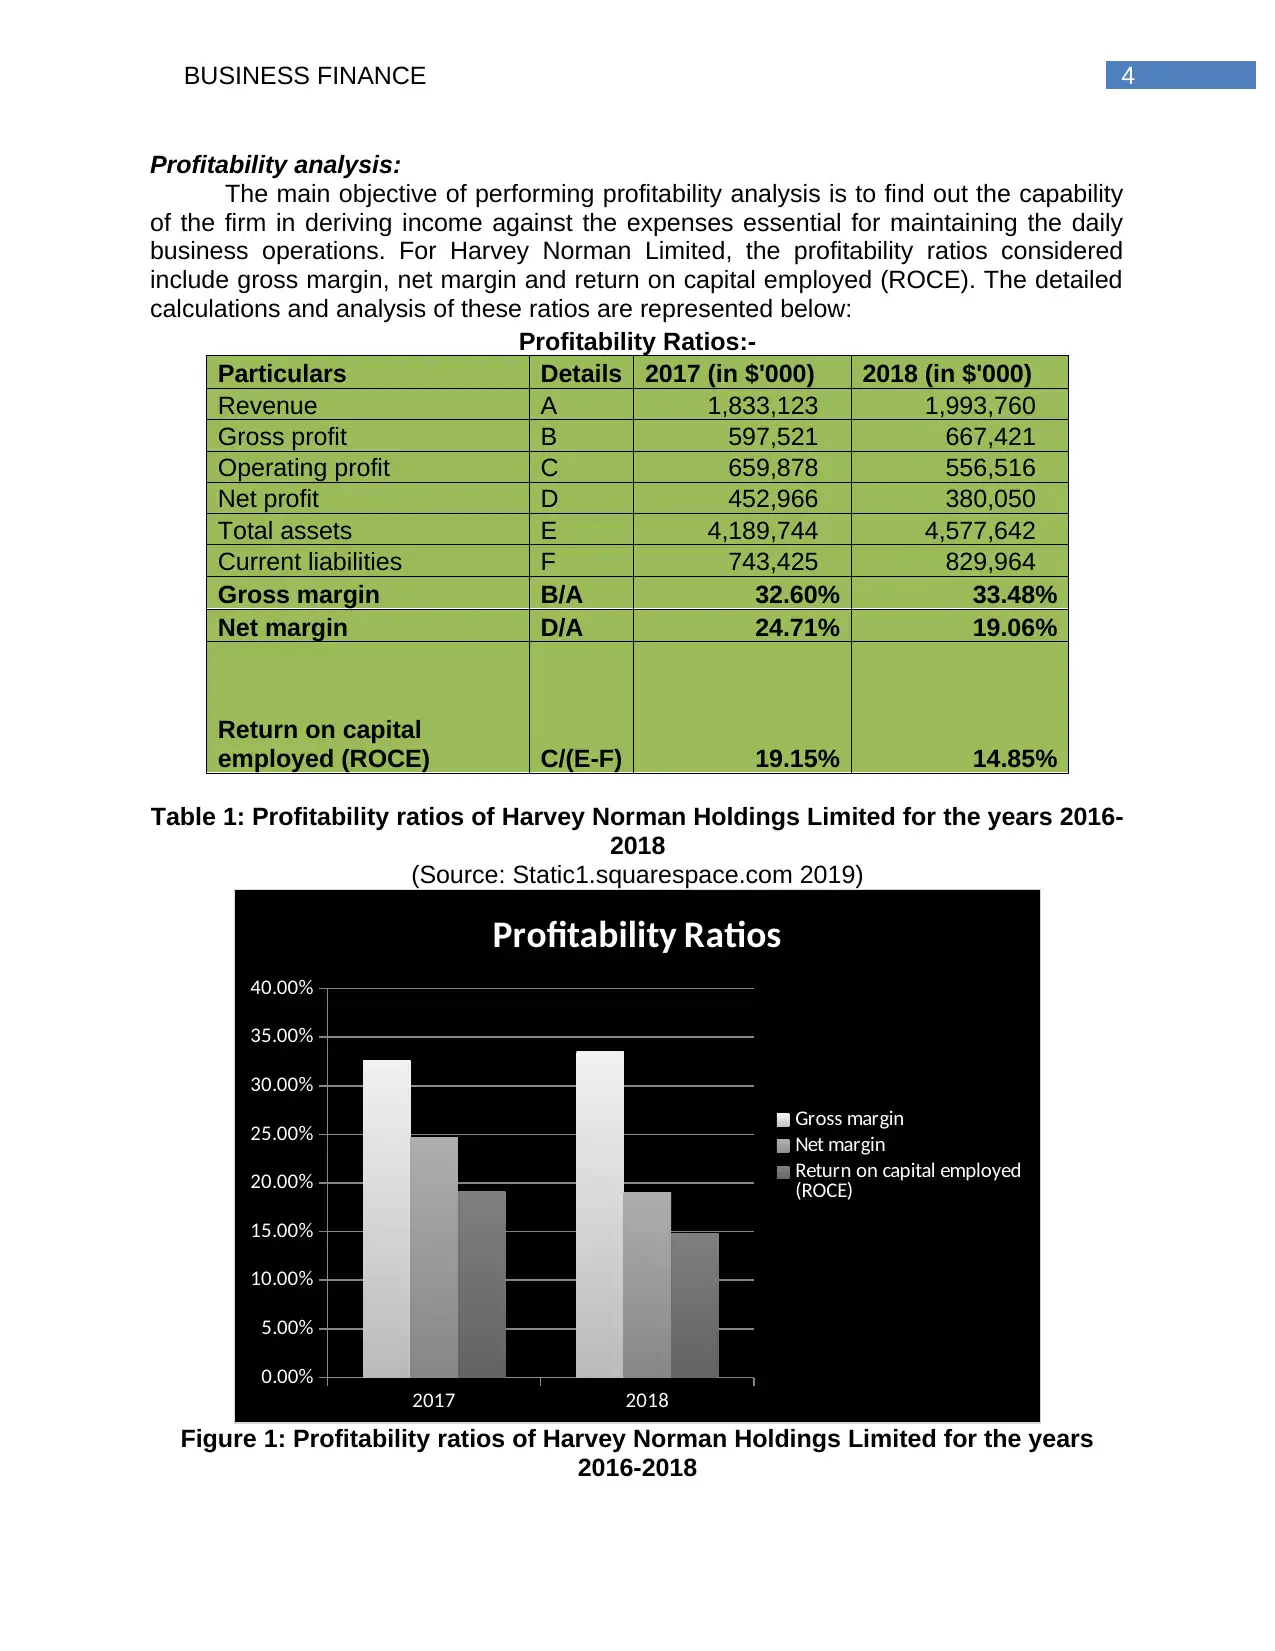
Profitability analysis:
The main objective of performing profitability analysis is to find out the capability
of the firm in deriving income against the expenses essential for maintaining the daily
business operations. For Harvey Norman Limited, the profitability ratios considered
include gross margin, net margin and return on capital employed (ROCE). The detailed
calculations and analysis of these ratios are represented below:
Profitability Ratios:-
Particulars Details 2017 (in $'000) 2018 (in $'000)
Revenue A 1,833,123 1,993,760
Gross profit B 597,521 667,421
Operating profit C 659,878 556,516
Net profit D 452,966 380,050
Total assets E 4,189,744 4,577,642
Current liabilities F 743,425 829,964
Gross margin B/A 32.60% 33.48%
Net margin D/A 24.71% 19.06%
Return on capital
employed (ROCE) C/(E-F) 19.15% 14.85%
Table 1: Profitability ratios of Harvey Norman Holdings Limited for the years 2016-
2018
(Source: Static1.squarespace.com 2019)
2017 2018
0.00%
5.00%
10.00%
15.00%
20.00%
25.00%
30.00%
35.00%
40.00%
Profitability Ratios
Gross margin
Net margin
Return on capital employed
(ROCE)
Figure 1: Profitability ratios of Harvey Norman Holdings Limited for the years
2016-2018
5BUSINESS FINANCE
(Source: Static1.squarespace.com 2019)
With the help of gross margin, it becomes possible to denote the proportion of
profit available to the organisation after settling all production payments (Dhaene et al.
2017). From the 2018 annual report of Harvey Norman Holdings Limited, it could be
seen that the cost of sales is the major expense for Harvey Norman Holdings Limited.
However, the significant increase in revenue has offset the cost of sales increase;
thereby, resulting in increased gross margin for the organisation in 2018. This is a
healthy indicator for Harvey Norman Holdings Limited.
Net margin, on the other hand, signifies the amount of profit that an organisation
has in hand after it has settled all its production and operating expenses (Ehrhardt and
Brigham 2016). Despite gross margin is observed to increase for Harvey Norman
Holdings Limited in 2018, fall in net margin is evident because of increase mainly in
selling, general and administrative expenses of the organisation. Thus, it could not be
considered as a positive indicator for the profitability of the business as well as the
shareholders. Therefore, Harvey Norman Holdings Limited has to devise out suitable
measures that would assist in minimising the overall operating costs.
ROCE is involved in gauging the capacity of an organisation to generate money
from the amount collected from its stockholders (Foley and Manova 2015). ROCE is
observed to have fallen sharply in 2018 and there are two reasons behind such
downfall. Firstly, operating income has declined in 2018 and current liabilities have
increased heavily in the year 2018 as well. Despite total assets have increased in 2018,
they are not enough to offset the negative aspects of the other two accounts. Hence, in
terms of business profitability, Harvey Norman Holdings Limited is not observed to
maintain a healthy position in the Australian market because of the decline in income it
encountered in the year.
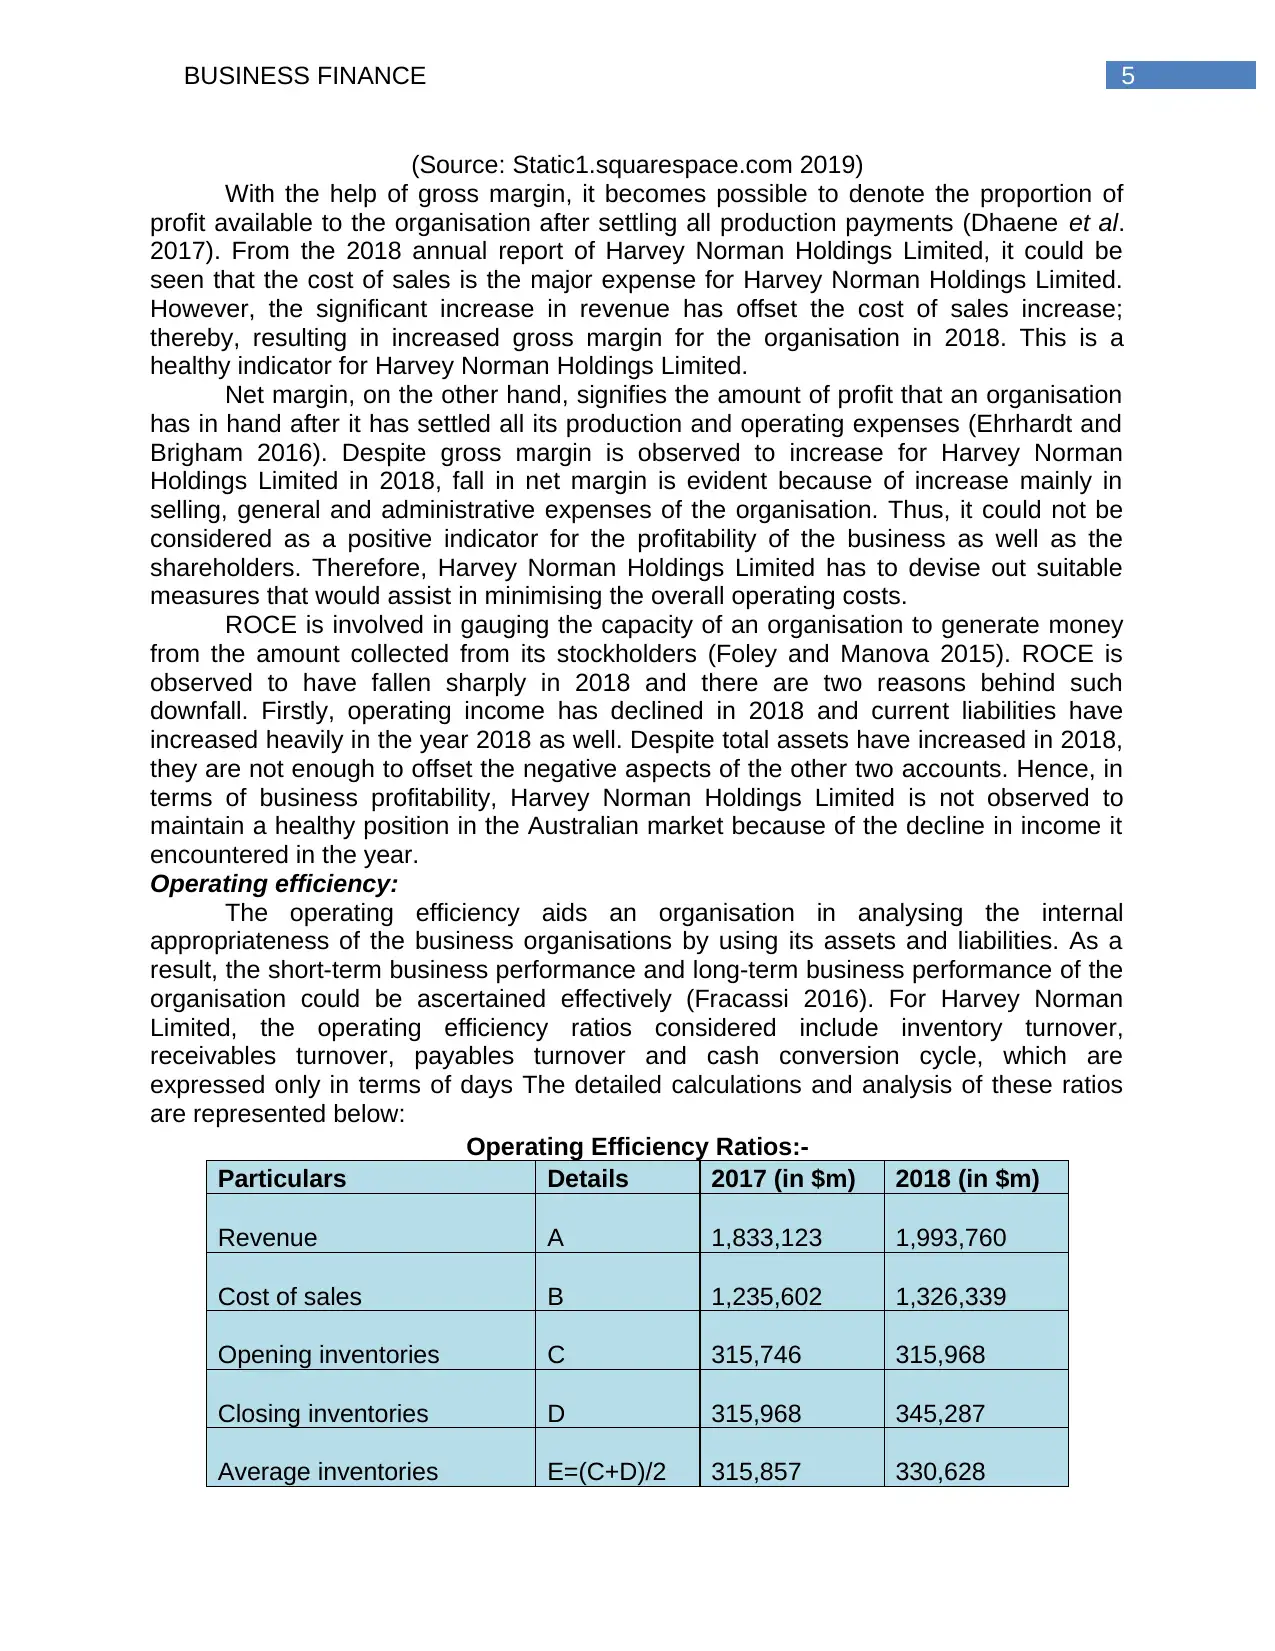
Operating efficiency:
The operating efficiency aids an organisation in analysing the internal
appropriateness of the business organisations by using its assets and liabilities. As a
result, the short-term business performance and long-term business performance of the
organisation could be ascertained effectively (Fracassi 2016). For Harvey Norman
Limited, the operating efficiency ratios considered include inventory turnover,
receivables turnover, payables turnover and cash conversion cycle, which are
expressed only in terms of days The detailed calculations and analysis of these ratios
are represented below:
Operating Efficiency Ratios:-
Particulars Details 2017 (in $m) 2018 (in $m)
Revenue A 1,833,123 1,993,760
Cost of sales B 1,235,602 1,326,339
Opening inventories C 315,746 315,968
Closing inventories D 315,968 345,287
Average inventories E=(C+D)/2 315,857 330,628
(Source: Static1.squarespace.com 2019)
With the help of gross margin, it becomes possible to denote the proportion of
profit available to the organisation after settling all production payments (Dhaene et al.
2017). From the 2018 annual report of Harvey Norman Holdings Limited, it could be
seen that the cost of sales is the major expense for Harvey Norman Holdings Limited.
However, the significant increase in revenue has offset the cost of sales increase;
thereby, resulting in increased gross margin for the organisation in 2018. This is a
healthy indicator for Harvey Norman Holdings Limited.
Net margin, on the other hand, signifies the amount of profit that an organisation
has in hand after it has settled all its production and operating expenses (Ehrhardt and
Brigham 2016). Despite gross margin is observed to increase for Harvey Norman
Holdings Limited in 2018, fall in net margin is evident because of increase mainly in
selling, general and administrative expenses of the organisation. Thus, it could not be
considered as a positive indicator for the profitability of the business as well as the
shareholders. Therefore, Harvey Norman Holdings Limited has to devise out suitable
measures that would assist in minimising the overall operating costs.
ROCE is involved in gauging the capacity of an organisation to generate money
from the amount collected from its stockholders (Foley and Manova 2015). ROCE is
observed to have fallen sharply in 2018 and there are two reasons behind such
downfall. Firstly, operating income has declined in 2018 and current liabilities have
increased heavily in the year 2018 as well. Despite total assets have increased in 2018,
they are not enough to offset the negative aspects of the other two accounts. Hence, in
terms of business profitability, Harvey Norman Holdings Limited is not observed to
maintain a healthy position in the Australian market because of the decline in income it
encountered in the year.
Operating efficiency:
The operating efficiency aids an organisation in analysing the internal
appropriateness of the business organisations by using its assets and liabilities. As a
result, the short-term business performance and long-term business performance of the
organisation could be ascertained effectively (Fracassi 2016). For Harvey Norman
Limited, the operating efficiency ratios considered include inventory turnover,
receivables turnover, payables turnover and cash conversion cycle, which are
expressed only in terms of days The detailed calculations and analysis of these ratios
are represented below:
Operating Efficiency Ratios:-
Particulars Details 2017 (in $m) 2018 (in $m)
Revenue A 1,833,123 1,993,760
Cost of sales B 1,235,602 1,326,339
Opening inventories C 315,746 315,968
Closing inventories D 315,968 345,287
Average inventories E=(C+D)/2 315,857 330,628
6BUSINESS FINANCE
Opening receivables F 1,096,572 640,686
Closing receivables G 640,686 724,690
Average receivables H=(F+G)/2 868,629 682,688
Opening payables I 746,489 238,628
Closing payables J 238,628 289,986
Average payables K=(I+J)/2 492,559 264,307
Days inventory turnover L=365/(B/E) 93.30 90.99
Days receivables
turnover
M=365/(A/
H) 172.96 124.98
Days payables turnover N=365/(B/K) 70.49 79.80
Cash conversion cycle L+M-N 195.77 136.16
Table 2: Operating efficiency ratios of Harvey Norman Holdings Limited for the
years 2016-2018
(Source: Static1.squarespace.com 2019)
Days
inventory
turnover
Days
receivables
turnover
Days
payables
turnover
Cash
conversion
cycle
-
50.00
100.00
150.00
200.00
250.00
Operating Efficiency Ratios
2017
2018
Figure 2: Operating efficiency ratios of Harvey Norman Holdings Limited for the
years 2016-2018
(Source: Static1.squarespace.com 2019)
Inventory turnover signifies the ability of a firm to manage its inventory
appropriately (Vernimmen et al. 2014). In accordance with the above figure, inventory
turnover of Harvey Norman Holdings Limited is observed to have declined in 2018 from
Paraphrase This Document
Need a fresh take? Get an instant paraphrase of this document with our AI Paraphraser
7BUSINESS FINANCE
2017 denoting the increase in the ability of the organisation to release its inventory at a
rapid pace. Thus, inventory turnover expressed in terms of days is observed to be
favourable for Harvey Norman Holdings Limited.
Receivables turnover denotes the efficacy of the firms through which they are
collecting money for the products sold on credit to their customers (Ferran and Ho
2014). The above figure reveals the declining trend in the ratio of Harvey Norman
Holdings Limited from 2017 to 2018. Thus, Harvey Norman Holdings Limited has
adopted stringent debtor policy so that it could collect the outstanding amounts at an
earlier date for raising its cash balance and working capital. Overall, receivables
turnover expressed in days is considered to be suitable from the business perspective
of Harvey Norman Holdings Limited.
Payables turnover expressed in number of days reveals the capability of a
company in making payments to the suppliers and creditors in a timely manner (Gitman,
Juchau and Flanagan 2015). It could be witnessed that this ratio has increased for
Harvey Norman Holdings Limited in 2018, which implies that the creditors are allowing
more time to the organisation in settling its payments owing to the positive brand image
in the market.
Finally, cash conversion cycle is involved in gauging how capable a firm is to
transfer its resources into cash (Gullifer and Payne 2015). From the above table, it
could be seen that Harvey Norman Holdings Limited has managed to reduce its cash
conversion cycle in the year 2018, which is a healthy sign. The main reason behind
such reduction is quick collection from the customers, which has assisted in increasing
its availability of cash as well as working capital.
Therefore, by analysing the operating efficiency of Harvey Norman Holdings
Limited it could be perceived as beneficial from the perspective of both the company as
well as the investors.
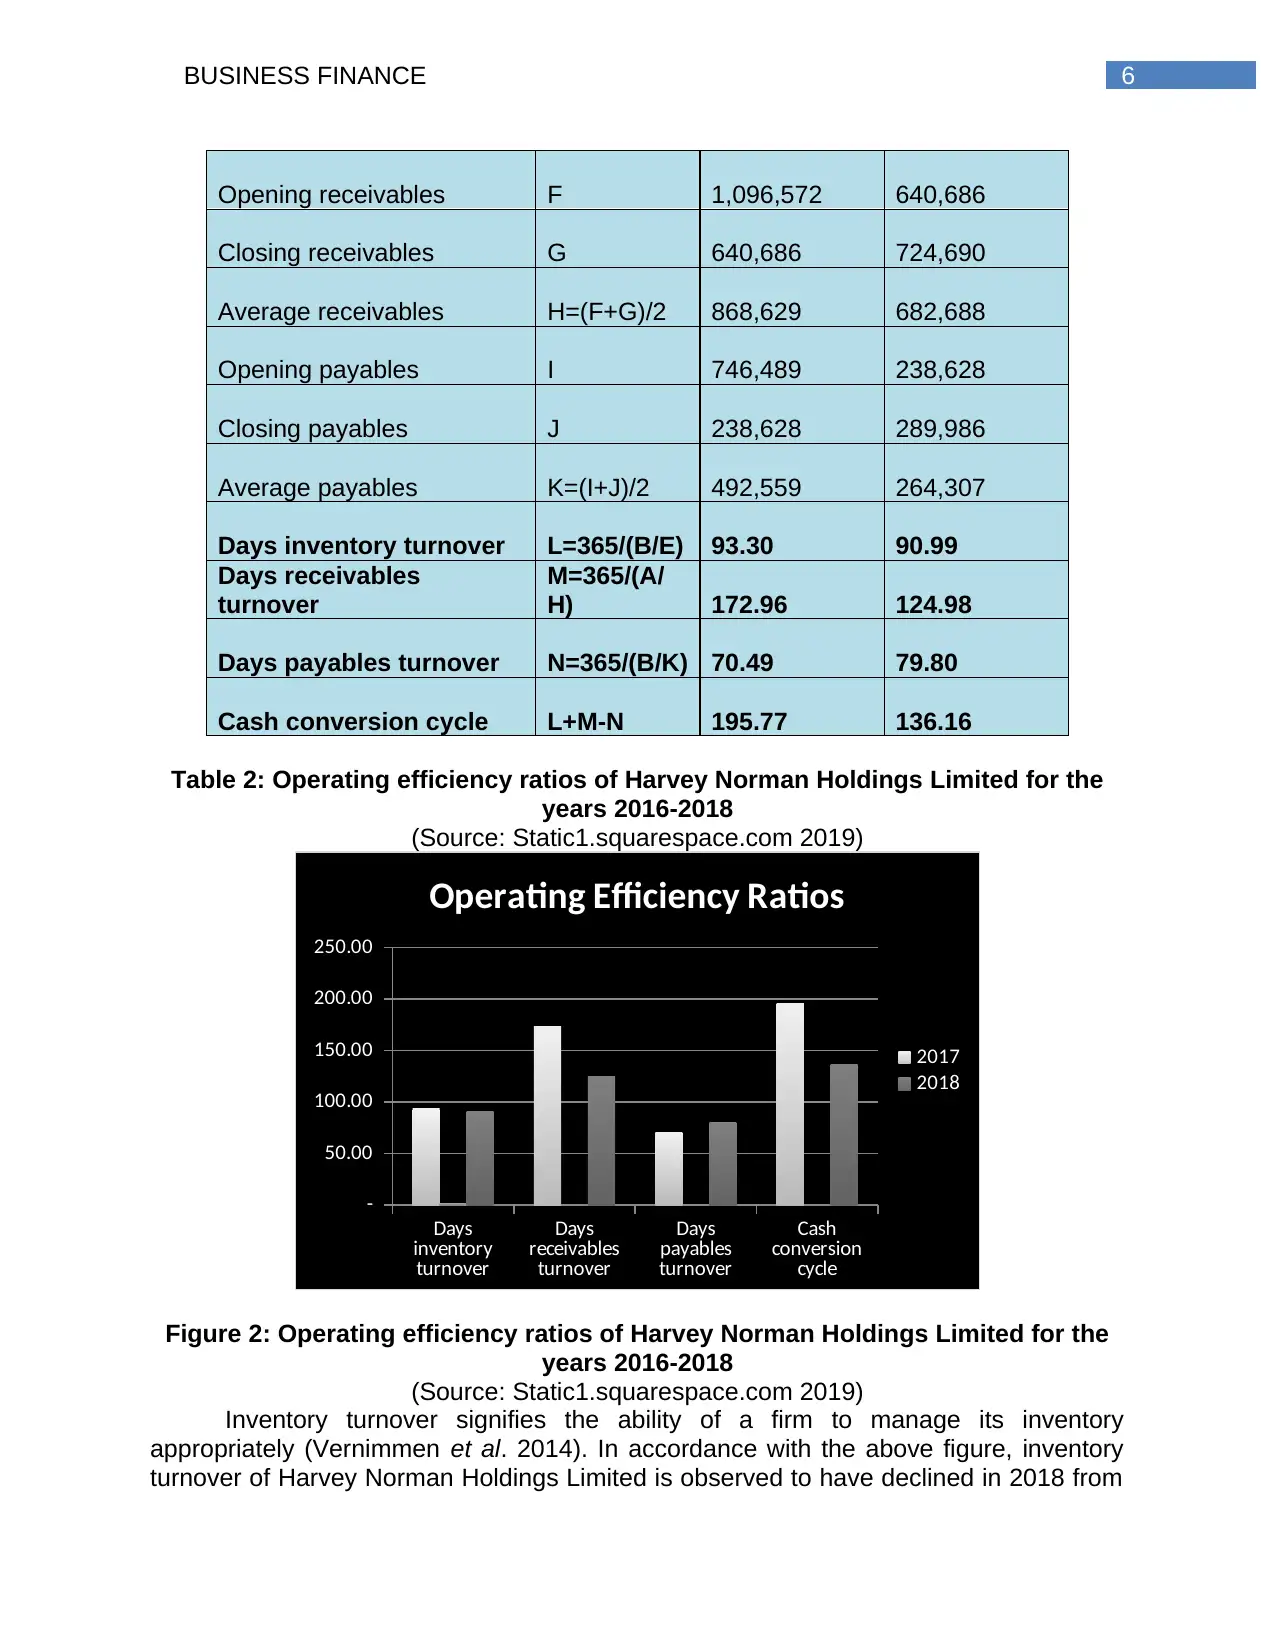
2.3 Graphs and comparison of share price movements:
1/01/2017
1/03/2017
1/05/2017
1/07/2017
1/09/2017
1/11/2017
1/01/2018
1/03/2018
1/05/2018
1/07/2018
1/09/2018
1/11/2018
$-
$1,000.00
$2,000.00
$3,000.00
$4,000.00
$5,000.00
$6,000.00
$7,000.00
Share Price Movements
All Ordinaries Index
Harvey Norman
Figure 3: Share price movements of Harvey Norman Holdings Limited and All
Ordinaries Index from 2017-2018
(Source: Au.finance.yahoo.com 2019: Au.finance.yahoo.com)
2017 denoting the increase in the ability of the organisation to release its inventory at a
rapid pace. Thus, inventory turnover expressed in terms of days is observed to be
favourable for Harvey Norman Holdings Limited.
Receivables turnover denotes the efficacy of the firms through which they are
collecting money for the products sold on credit to their customers (Ferran and Ho
2014). The above figure reveals the declining trend in the ratio of Harvey Norman
Holdings Limited from 2017 to 2018. Thus, Harvey Norman Holdings Limited has
adopted stringent debtor policy so that it could collect the outstanding amounts at an
earlier date for raising its cash balance and working capital. Overall, receivables
turnover expressed in days is considered to be suitable from the business perspective
of Harvey Norman Holdings Limited.
Payables turnover expressed in number of days reveals the capability of a
company in making payments to the suppliers and creditors in a timely manner (Gitman,
Juchau and Flanagan 2015). It could be witnessed that this ratio has increased for
Harvey Norman Holdings Limited in 2018, which implies that the creditors are allowing
more time to the organisation in settling its payments owing to the positive brand image
in the market.
Finally, cash conversion cycle is involved in gauging how capable a firm is to
transfer its resources into cash (Gullifer and Payne 2015). From the above table, it
could be seen that Harvey Norman Holdings Limited has managed to reduce its cash
conversion cycle in the year 2018, which is a healthy sign. The main reason behind
such reduction is quick collection from the customers, which has assisted in increasing
its availability of cash as well as working capital.
Therefore, by analysing the operating efficiency of Harvey Norman Holdings
Limited it could be perceived as beneficial from the perspective of both the company as
well as the investors.
2.3 Graphs and comparison of share price movements:
1/01/2017
1/03/2017
1/05/2017
1/07/2017
1/09/2017
1/11/2017
1/01/2018
1/03/2018
1/05/2018
1/07/2018
1/09/2018
1/11/2018
$-
$1,000.00
$2,000.00
$3,000.00
$4,000.00
$5,000.00
$6,000.00
$7,000.00
Share Price Movements
All Ordinaries Index
Harvey Norman
Figure 3: Share price movements of Harvey Norman Holdings Limited and All
Ordinaries Index from 2017-2018
(Source: Au.finance.yahoo.com 2019: Au.finance.yahoo.com)
8BUSINESS FINANCE
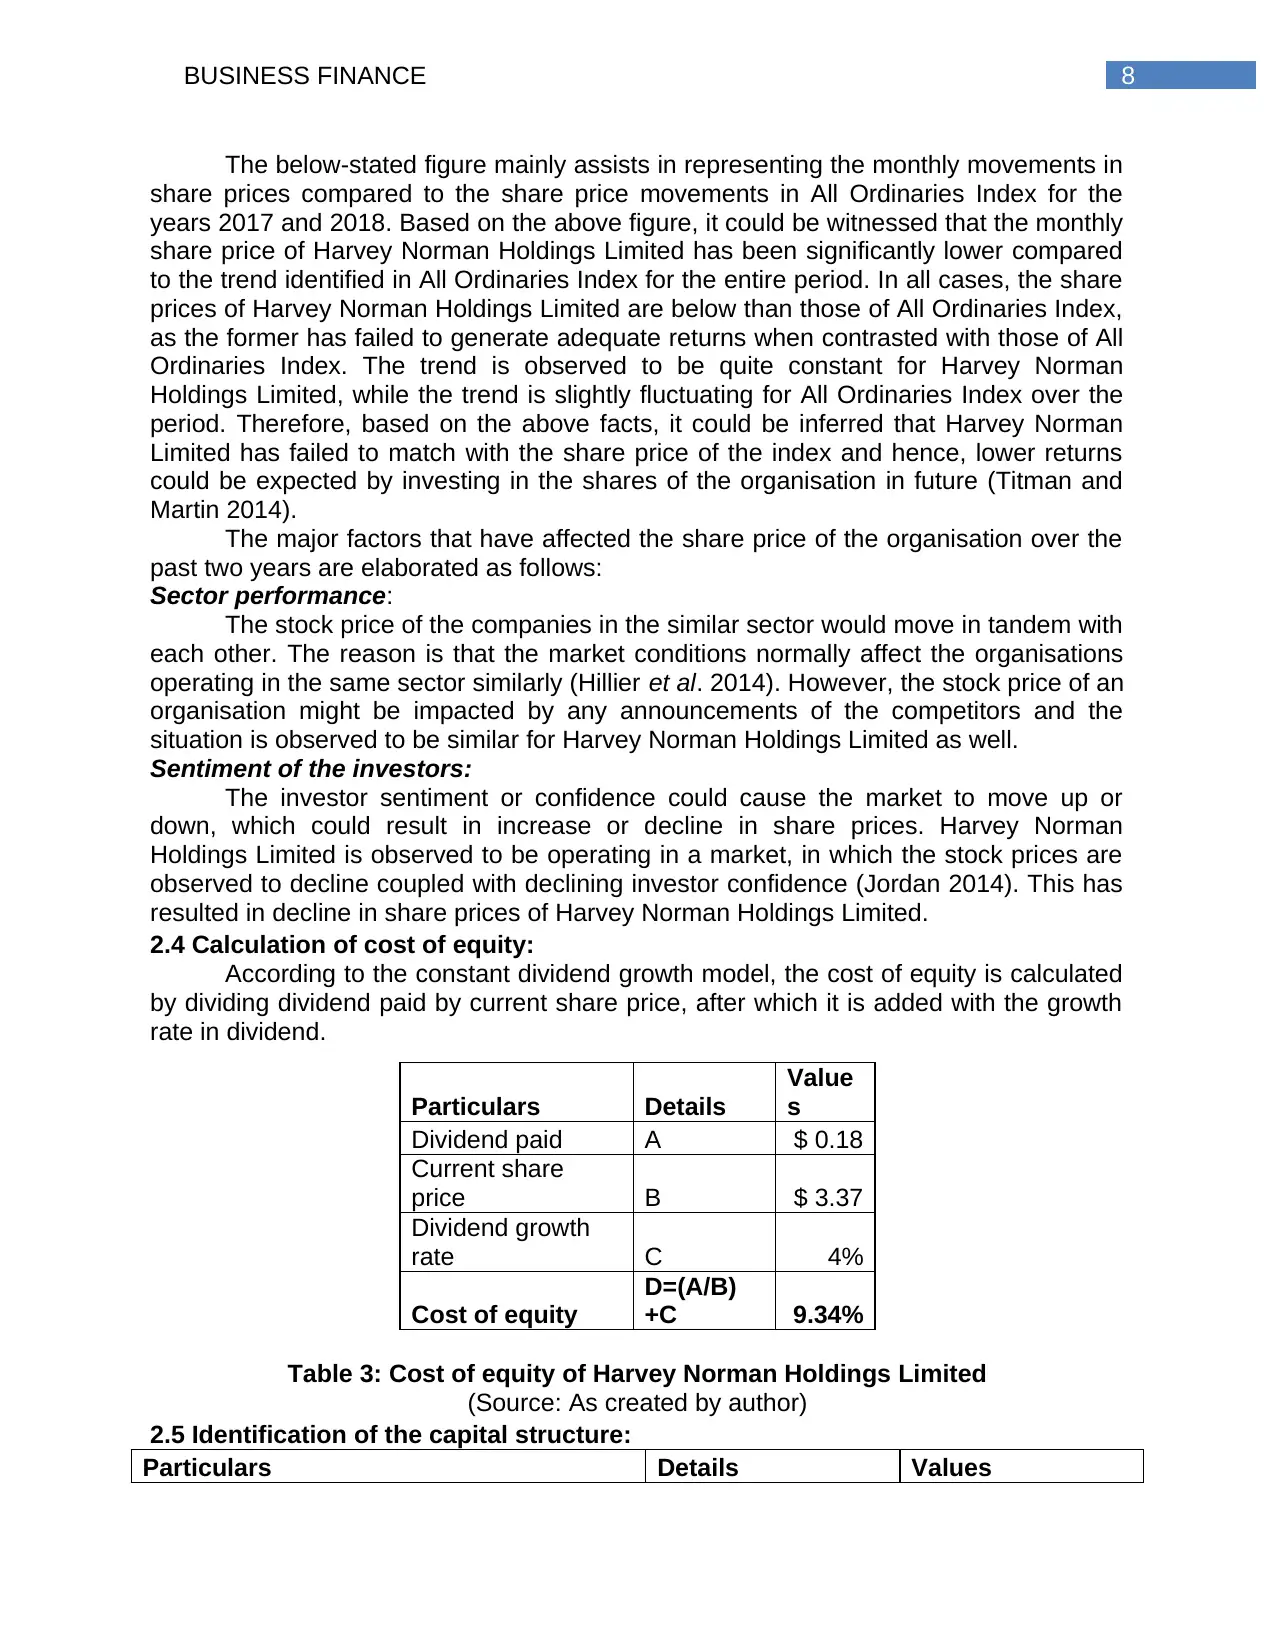
The below-stated figure mainly assists in representing the monthly movements in
share prices compared to the share price movements in All Ordinaries Index for the
years 2017 and 2018. Based on the above figure, it could be witnessed that the monthly
share price of Harvey Norman Holdings Limited has been significantly lower compared
to the trend identified in All Ordinaries Index for the entire period. In all cases, the share
prices of Harvey Norman Holdings Limited are below than those of All Ordinaries Index,
as the former has failed to generate adequate returns when contrasted with those of All
Ordinaries Index. The trend is observed to be quite constant for Harvey Norman
Holdings Limited, while the trend is slightly fluctuating for All Ordinaries Index over the
period. Therefore, based on the above facts, it could be inferred that Harvey Norman
Limited has failed to match with the share price of the index and hence, lower returns
could be expected by investing in the shares of the organisation in future (Titman and
Martin 2014).
The major factors that have affected the share price of the organisation over the
past two years are elaborated as follows:
Sector performance:
The stock price of the companies in the similar sector would move in tandem with
each other. The reason is that the market conditions normally affect the organisations
operating in the same sector similarly (Hillier et al. 2014). However, the stock price of an
organisation might be impacted by any announcements of the competitors and the
situation is observed to be similar for Harvey Norman Holdings Limited as well.
Sentiment of the investors:
The investor sentiment or confidence could cause the market to move up or
down, which could result in increase or decline in share prices. Harvey Norman
Holdings Limited is observed to be operating in a market, in which the stock prices are
observed to decline coupled with declining investor confidence (Jordan 2014). This has
resulted in decline in share prices of Harvey Norman Holdings Limited.
2.4 Calculation of cost of equity:
According to the constant dividend growth model, the cost of equity is calculated
by dividing dividend paid by current share price, after which it is added with the growth
rate in dividend.
Particulars Details
Value
s
Dividend paid A $ 0.18
Current share
price B $ 3.37
Dividend growth
rate C 4%
Cost of equity
D=(A/B)
+C 9.34%
Table 3: Cost of equity of Harvey Norman Holdings Limited
(Source: As created by author)
2.5 Identification of the capital structure:
Particulars Details Values
9BUSINESS FINANCE
Value of debt A $ 1,639,710,000
Value of equity B $ 2,937,932,000
Total value of debt and equity C=A+B $ 4,577,642,000
Weight of debt D=A/C 35.82%
Weight of equity E=B/C 64.18%
Cost of debt F 5%
Cost of equity G 9.34%
Tax rate H 30%
Weighted average cost of capital (WACC)
I=(ExG)+(DxF)x(1-
H) 7.25%
Table 4: Weighted average cost of capital (WACC) of Harvey Norman Holdings
Limited
(Source: As created by author)
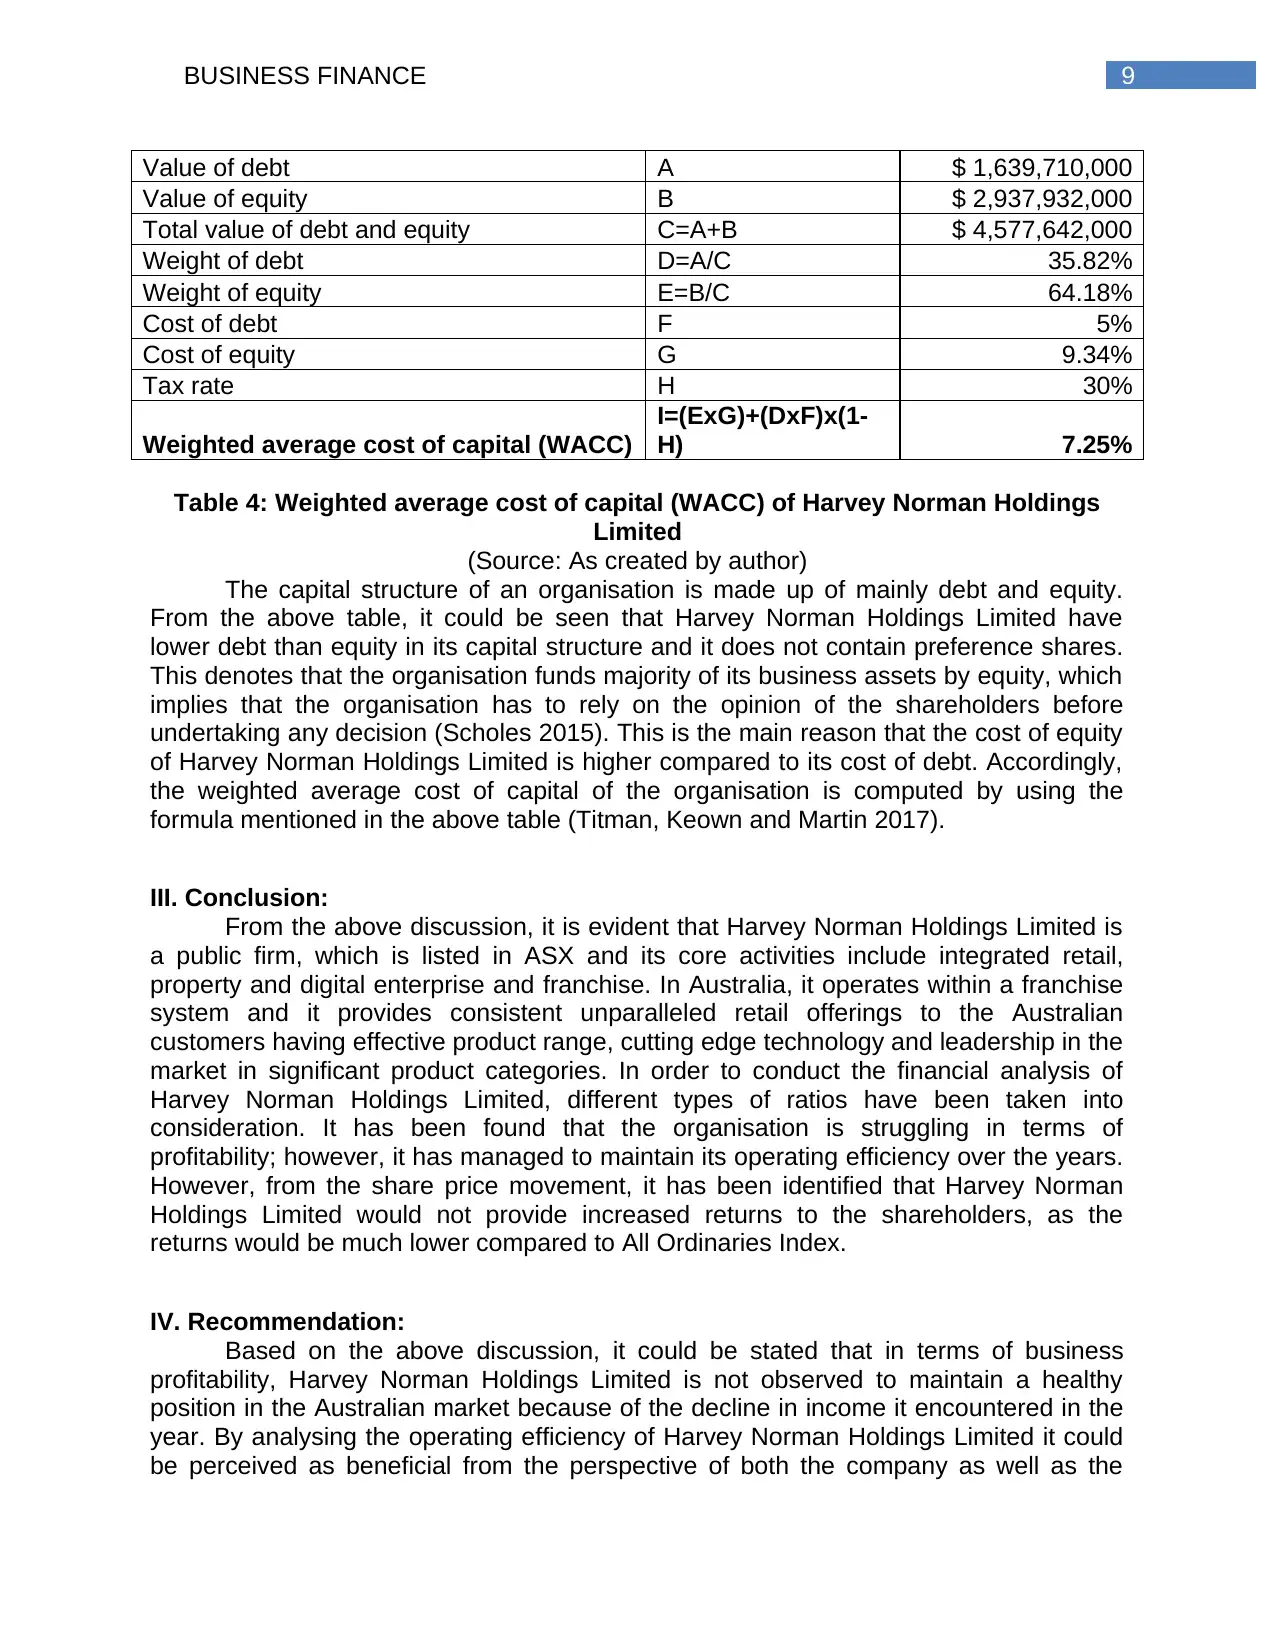
The capital structure of an organisation is made up of mainly debt and equity.
From the above table, it could be seen that Harvey Norman Holdings Limited have
lower debt than equity in its capital structure and it does not contain preference shares.
This denotes that the organisation funds majority of its business assets by equity, which
implies that the organisation has to rely on the opinion of the shareholders before
undertaking any decision (Scholes 2015). This is the main reason that the cost of equity
of Harvey Norman Holdings Limited is higher compared to its cost of debt. Accordingly,
the weighted average cost of capital of the organisation is computed by using the
formula mentioned in the above table (Titman, Keown and Martin 2017).
III. Conclusion:
From the above discussion, it is evident that Harvey Norman Holdings Limited is
a public firm, which is listed in ASX and its core activities include integrated retail,
property and digital enterprise and franchise. In Australia, it operates within a franchise
system and it provides consistent unparalleled retail offerings to the Australian
customers having effective product range, cutting edge technology and leadership in the
market in significant product categories. In order to conduct the financial analysis of
Harvey Norman Holdings Limited, different types of ratios have been taken into
consideration. It has been found that the organisation is struggling in terms of
profitability; however, it has managed to maintain its operating efficiency over the years.
However, from the share price movement, it has been identified that Harvey Norman
Holdings Limited would not provide increased returns to the shareholders, as the
returns would be much lower compared to All Ordinaries Index.
IV. Recommendation:
Based on the above discussion, it could be stated that in terms of business
profitability, Harvey Norman Holdings Limited is not observed to maintain a healthy
position in the Australian market because of the decline in income it encountered in the
year. By analysing the operating efficiency of Harvey Norman Holdings Limited it could
be perceived as beneficial from the perspective of both the company as well as the
Value of debt A $ 1,639,710,000
Value of equity B $ 2,937,932,000
Total value of debt and equity C=A+B $ 4,577,642,000
Weight of debt D=A/C 35.82%
Weight of equity E=B/C 64.18%
Cost of debt F 5%
Cost of equity G 9.34%
Tax rate H 30%
Weighted average cost of capital (WACC)
I=(ExG)+(DxF)x(1-
H) 7.25%
Table 4: Weighted average cost of capital (WACC) of Harvey Norman Holdings
Limited
(Source: As created by author)
The capital structure of an organisation is made up of mainly debt and equity.
From the above table, it could be seen that Harvey Norman Holdings Limited have
lower debt than equity in its capital structure and it does not contain preference shares.
This denotes that the organisation funds majority of its business assets by equity, which
implies that the organisation has to rely on the opinion of the shareholders before
undertaking any decision (Scholes 2015). This is the main reason that the cost of equity
of Harvey Norman Holdings Limited is higher compared to its cost of debt. Accordingly,
the weighted average cost of capital of the organisation is computed by using the
formula mentioned in the above table (Titman, Keown and Martin 2017).
III. Conclusion:
From the above discussion, it is evident that Harvey Norman Holdings Limited is
a public firm, which is listed in ASX and its core activities include integrated retail,
property and digital enterprise and franchise. In Australia, it operates within a franchise
system and it provides consistent unparalleled retail offerings to the Australian
customers having effective product range, cutting edge technology and leadership in the
market in significant product categories. In order to conduct the financial analysis of
Harvey Norman Holdings Limited, different types of ratios have been taken into
consideration. It has been found that the organisation is struggling in terms of
profitability; however, it has managed to maintain its operating efficiency over the years.
However, from the share price movement, it has been identified that Harvey Norman
Holdings Limited would not provide increased returns to the shareholders, as the
returns would be much lower compared to All Ordinaries Index.
IV. Recommendation:
Based on the above discussion, it could be stated that in terms of business
profitability, Harvey Norman Holdings Limited is not observed to maintain a healthy
position in the Australian market because of the decline in income it encountered in the
year. By analysing the operating efficiency of Harvey Norman Holdings Limited it could
be perceived as beneficial from the perspective of both the company as well as the
Secure Best Marks with AI Grader
Need help grading? Try our AI Grader for instant feedback on your assignments.
10BUSINESS FINANCE
investors. The stock price of the companies in the similar sector would move in tandem
with each other. The reason is that the market conditions normally affect the
organisations operating in the same sector similarly. However, the stock price of an
organisation might be impacted by any announcements of the competitors and the
situation is observed to be similar for Harvey Norman Holdings Limited as well. The
investor sentiment or confidence could cause the market to move up or down, which
could result in increase or decline in share prices. Harvey Norman Holdings Limited is
observed to be operating in a market, in which the stock prices are observed to decline
coupled with declining investor confidence. This has resulted in decline in share prices
of Harvey Norman Holdings Limited.
It could be seen that Harvey Norman Holdings Limited have lower debt than
equity in its capital structure and it does not contain preference shares. This denotes
that the organisation funds majority of its business assets by equity, which implies that
the organisation has to rely on the opinion of the shareholders before undertaking any
decision. This is the main reason that the cost of equity of Harvey Norman Holdings
Limited is higher compared to its cost of debt. Accordingly, the weighted average cost of
capital of the organisation is computed by using appropriate formula. Hence, the
investor is recommended not to invest in the shares of Harvey Norman Holdings
Limited, as the same would minimise the overall return on investment.
11BUSINESS FINANCE
References:
Au.finance.yahoo.com., 2019. [online] Available at:
https://au.finance.yahoo.com/quote/%5EAORD/history?
period1=1483122600&period2=1548873000&interval=1mo&filter=history&frequency=1
mo [Accessed 31 May 2019].
Au.finance.yahoo.com., 2019. [online] Available at:
https://au.finance.yahoo.com/quote/HVN.AX/history?
period1=1481567400&period2=1548873000&interval=1mo&filter=history&frequency=1
mo [Accessed 31 May 2019].
Brooks, R., 2015. Financial management: core concepts. Pearson.
Dhaene, J., Hulle, C., Wuyts, G., Schoubben, F. and Schoutens, W., 2017. Is the capital
structure logic of corporate finance applicable to insurers? Review and analysis. Journal
of Economic Surveys, 31(1), pp.169-189.
Ehrhardt, M.C. and Brigham, E.F., 2016. Corporate finance: A focused approach.
Cengage learning.
Ferran, E. and Ho, L.C., 2014. Principles of corporate finance law. Oxford University
Press.
Foley, C.F. and Manova, K., 2015. International trade, multinational activity, and
corporate finance. economics, 7(1), pp.119-146.
Fracassi, C., 2016. Corporate finance policies and social networks. Management
Science, 63(8), pp.2420-2438.
Gitman, L.J., Juchau, R. and Flanagan, J., 2015. Principles of managerial finance.
Pearson Higher Education AU.
Gullifer, L. and Payne, J., 2015. Corporate finance law: principles and policy.
Bloomsbury Publishing.
Harvey Norman Holdings., 2019. Company Overview — Harvey Norman Holdings.
[online] Available at: http://www.harveynormanholdings.com.au/company [Accessed 31
May 2019].
Hillier, D., Clacher, I., Ross, S., Westerfield, R. and Jordan, B., 2014. Fundamentals of
corporate finance. McGraw Hill.
Jordan, B., 2014. Fundamentals of investments. McGraw-Hill Higher Education.
Scholes, M.S., 2015. Taxes and business strategy. Prentice Hall.
Static1.squarespace.com., 2019. [online] Available at:
https://static1.squarespace.com/static/54803162e4b08e1b8a472201/t/
5bad8412f4e1fcd2edb86026/1538098250289/2018-Annual-Report.pdf [Accessed 31
May 2019].
Titman, S. and Martin, J.D., 2014. Valuation. Pearson Higher Ed.
Titman, S., Keown, A.J. and Martin, J.D., 2017. Financial management: Principles and
applications. Pearson.
Vernimmen, P., Quiry, P., Dallocchio, M., Le Fur, Y. and Salvi, A., 2014. Corporate
finance: theory and practice. John Wiley & Sons.
1 out of 12
Related Documents


Your All-in-One AI-Powered Toolkit for Academic Success.
+13062052269
info@desklib.com
Available 24*7 on WhatsApp / Email
![[object Object]](/_next/static/media/star-bottom.7253800d.svg)
Unlock your academic potential
© 2024 | Zucol Services PVT LTD | All rights reserved.