Business Finance Report: Company Performance and Financial Analysis
VerifiedAdded on 2023/04/04
|14
|2278
|203
Report
AI Summary
This report evaluates the financial performance of Ramsay Health Care Limited and Ansell Limited over a five-year period. It begins by calculating and commenting on the companies' risk profiles, including systematic and unsystematic risk. The report then determines the cost of capital for each source of finance and calculates the weighted average cost of capital (WACC). It also describes the dividend policy and pattern of each company using share price data, including EPS, dividend payout ratios, and dividend yields. Finally, the report discusses the performance of each company by analyzing share price data, providing a comprehensive overview of their financial health and investment potential. The analysis includes detailed calculations and interpretations of key financial metrics, providing valuable insights into the companies' financial strategies and performance.

Running head: BUSINESS FINANCE
Business Finance
Name of the Student:
Name of the University:
Authors Note:
Business Finance
Name of the Student:
Name of the University:
Authors Note:
Paraphrase This Document
Need a fresh take? Get an instant paraphrase of this document with our AI Paraphraser

BUSINESS FINANCE
1
Table of Contents
Introduction:...............................................................................................................................2
a) Calculating and commenting on the risk profile of the company:.........................................2
b) Determining the cost of capital for each source of finance as well as weighed average cost
of capital:....................................................................................................................................4
c) Describing the dividend policy and pattern using share price data:......................................6
d) Discussing the performance of the company by analysing share price data:........................8
Conclusion:..............................................................................................................................11
Reference and Bibliography:....................................................................................................12
BUSINESS FINANCE
2
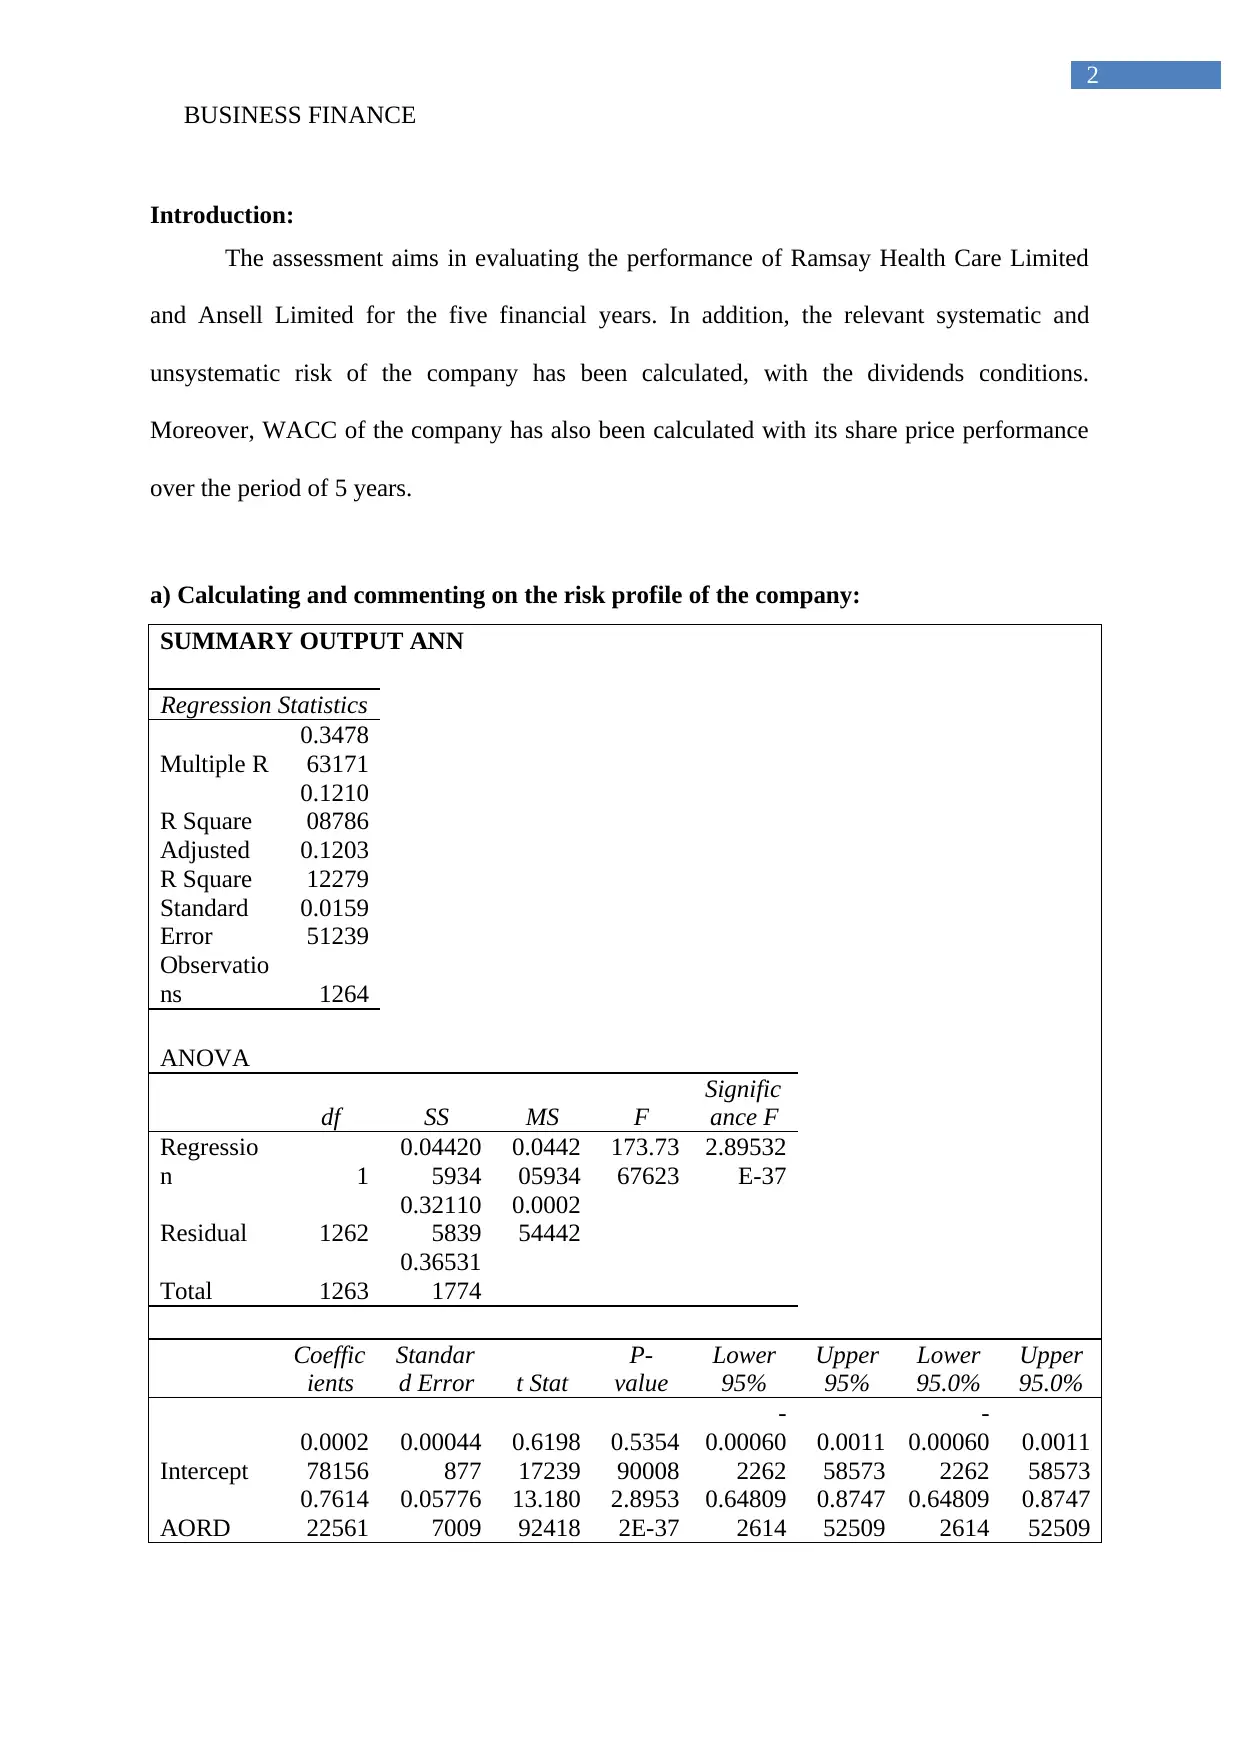
Introduction:
The assessment aims in evaluating the performance of Ramsay Health Care Limited
and Ansell Limited for the five financial years. In addition, the relevant systematic and
unsystematic risk of the company has been calculated, with the dividends conditions.
Moreover, WACC of the company has also been calculated with its share price performance
over the period of 5 years.
a) Calculating and commenting on the risk profile of the company:
SUMMARY OUTPUT ANN
Regression Statistics
Multiple R
0.3478
63171
R Square
0.1210
08786
Adjusted
R Square
0.1203
12279
Standard
Error
0.0159
51239
Observatio
ns 1264
ANOVA
df SS MS F
Signific
ance F
Regressio
n 1
0.04420
5934
0.0442
05934
173.73
67623
2.89532
E-37
Residual 1262
0.32110
5839
0.0002
54442
Total 1263
0.36531
1774
Coeffic
ients
Standar
d Error t Stat
P-
value
Lower
95%
Upper
95%
Lower
95.0%
Upper
95.0%
Intercept
0.0002
78156
0.00044
877
0.6198
17239
0.5354
90008
-
0.00060
2262
0.0011
58573
-
0.00060
2262
0.0011
58573
AORD
0.7614
22561
0.05776
7009
13.180
92418
2.8953
2E-37
0.64809
2614
0.8747
52509
0.64809
2614
0.8747
52509
2
Introduction:
The assessment aims in evaluating the performance of Ramsay Health Care Limited
and Ansell Limited for the five financial years. In addition, the relevant systematic and
unsystematic risk of the company has been calculated, with the dividends conditions.
Moreover, WACC of the company has also been calculated with its share price performance
over the period of 5 years.
a) Calculating and commenting on the risk profile of the company:
SUMMARY OUTPUT ANN
Regression Statistics
Multiple R
0.3478
63171
R Square
0.1210
08786
Adjusted
R Square
0.1203
12279
Standard
Error
0.0159
51239
Observatio
ns 1264
ANOVA
df SS MS F
Signific
ance F
Regressio
n 1
0.04420
5934
0.0442
05934
173.73
67623
2.89532
E-37
Residual 1262
0.32110
5839
0.0002
54442
Total 1263
0.36531
1774
Coeffic
ients
Standar
d Error t Stat
P-
value
Lower
95%
Upper
95%
Lower
95.0%
Upper
95.0%
Intercept
0.0002
78156
0.00044
877
0.6198
17239
0.5354
90008
-
0.00060
2262
0.0011
58573
-
0.00060
2262
0.0011
58573
AORD
0.7614
22561
0.05776
7009
13.180
92418
2.8953
2E-37
0.64809
2614
0.8747
52509
0.64809
2614
0.8747
52509
⊘ This is a preview!⊘
Do you want full access?
Subscribe today to unlock all pages.
Trusted by 1+ million students worldwide
BUSINESS FINANCE
3
SUMMARY OUTPUT for RHC
Regression Statistics
Multiple R
0.4955
6908
R Square
0.2455
88713
Adjusted
R Square
0.2449
90923
Standard
Error
0.0120
04184
Observatio
ns 1264
ANOVA
df SS MS F
Signific
ance F
Regressio
n 1
0.05920
0429
0.0592
00429
410.82
75696
2.66644
E-79
Residual 1262
0.18185
4742
0.0001
441
Total 1263
0.24105
5171
Coeffic
ients
Standar
d Error t Stat
P-
value
Lower
95%
Upper
95%
Lower
95.0%
Upper
95.0%
Intercept
0.0002
60097
0.00033
7724
0.7701
46798
0.4413
56957
-
0.00040
2466
0.0009
2266
-
0.00040
2466
0.0009
2266
AORD
0.8811
46016
0.04347
2848
20.268
8818
2.6664
4E-79
0.79585
9004
0.9664
33028
0.79585
9004
0.9664
33028
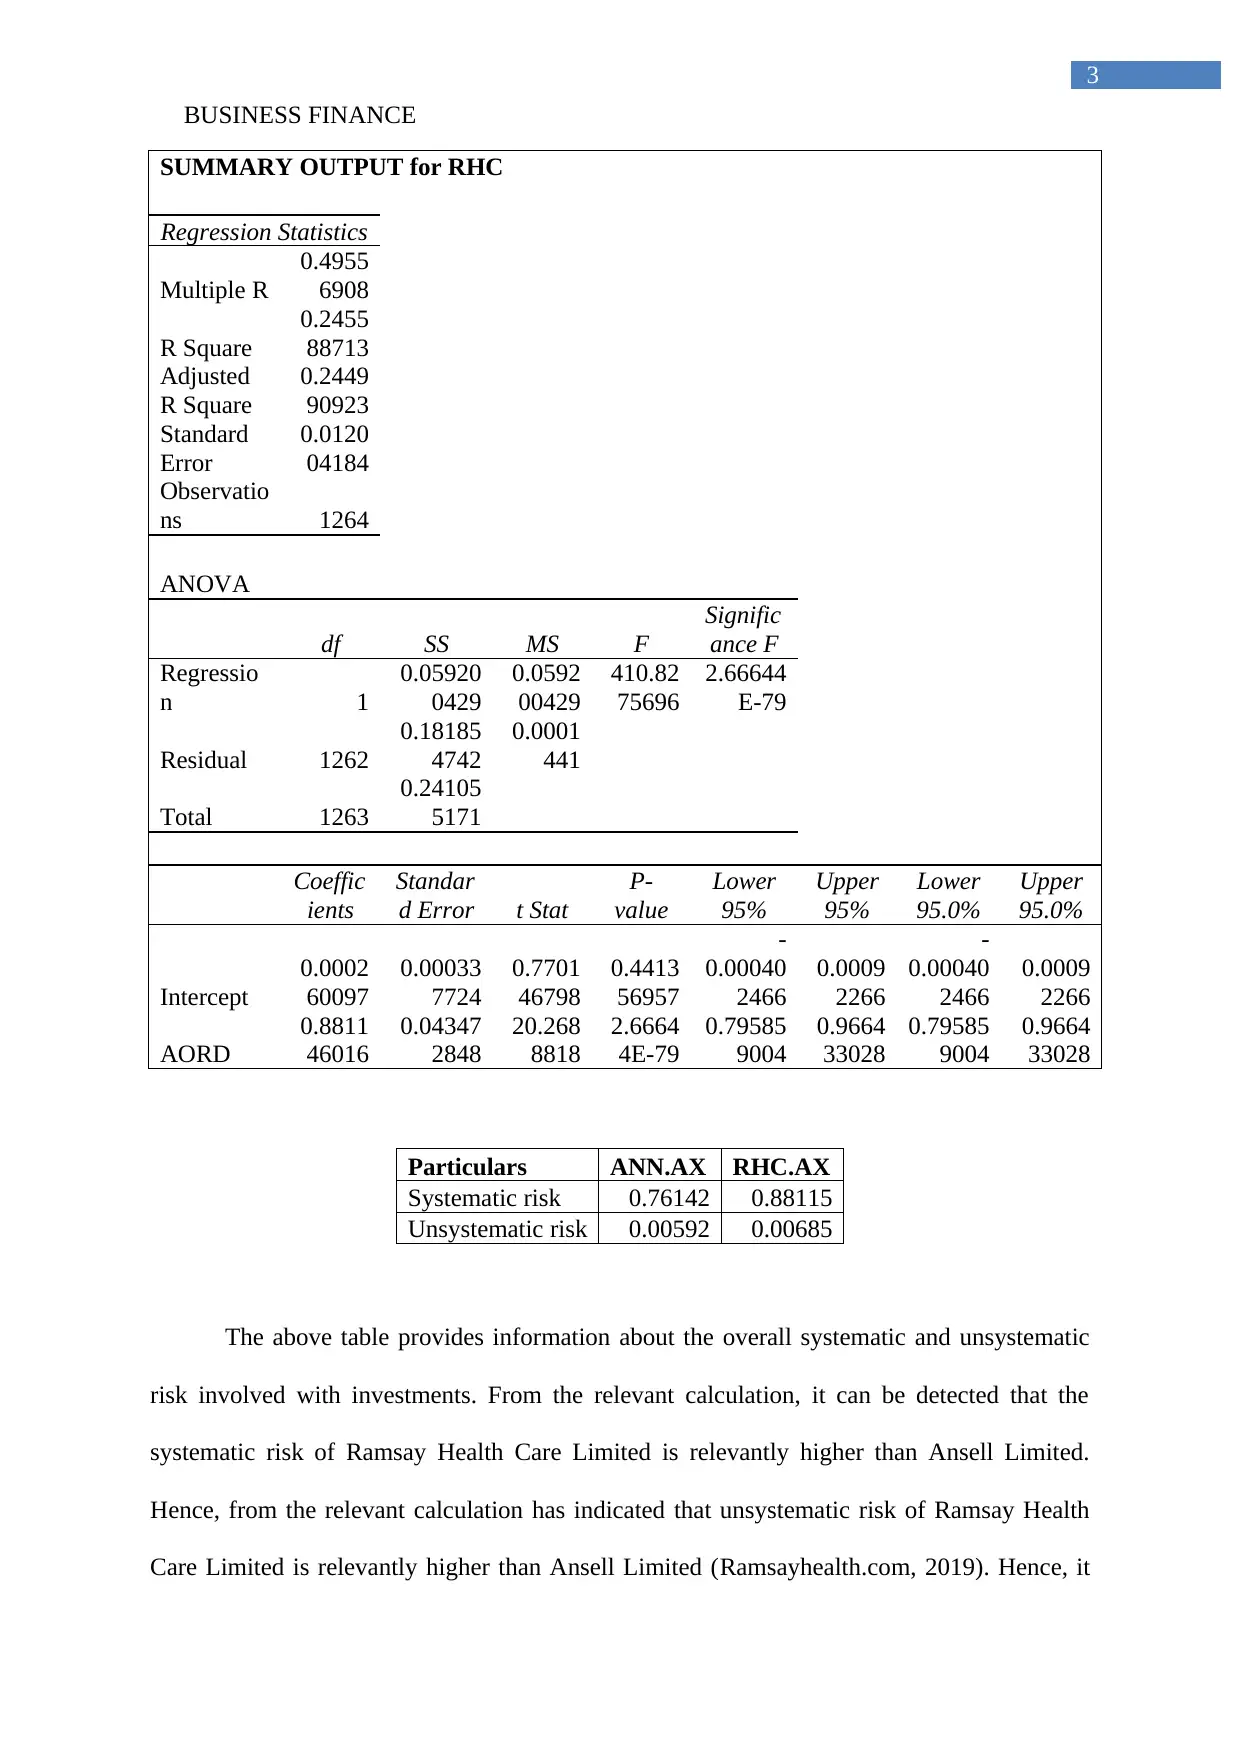
Particulars ANN.AX RHC.AX
Systematic risk 0.76142 0.88115
Unsystematic risk 0.00592 0.00685
The above table provides information about the overall systematic and unsystematic
risk involved with investments. From the relevant calculation, it can be detected that the
systematic risk of Ramsay Health Care Limited is relevantly higher than Ansell Limited.
Hence, from the relevant calculation has indicated that unsystematic risk of Ramsay Health
Care Limited is relevantly higher than Ansell Limited (Ramsayhealth.com, 2019). Hence, it
3
SUMMARY OUTPUT for RHC
Regression Statistics
Multiple R
0.4955
6908
R Square
0.2455
88713
Adjusted
R Square
0.2449
90923
Standard
Error
0.0120
04184
Observatio
ns 1264
ANOVA
df SS MS F
Signific
ance F
Regressio
n 1
0.05920
0429
0.0592
00429
410.82
75696
2.66644
E-79
Residual 1262
0.18185
4742
0.0001
441
Total 1263
0.24105
5171
Coeffic
ients
Standar
d Error t Stat
P-
value
Lower
95%
Upper
95%
Lower
95.0%
Upper
95.0%
Intercept
0.0002
60097
0.00033
7724
0.7701
46798
0.4413
56957
-
0.00040
2466
0.0009
2266
-
0.00040
2466
0.0009
2266
AORD
0.8811
46016
0.04347
2848
20.268
8818
2.6664
4E-79
0.79585
9004
0.9664
33028
0.79585
9004
0.9664
33028
Particulars ANN.AX RHC.AX
Systematic risk 0.76142 0.88115
Unsystematic risk 0.00592 0.00685
The above table provides information about the overall systematic and unsystematic
risk involved with investments. From the relevant calculation, it can be detected that the
systematic risk of Ramsay Health Care Limited is relevantly higher than Ansell Limited.
Hence, from the relevant calculation has indicated that unsystematic risk of Ramsay Health
Care Limited is relevantly higher than Ansell Limited (Ramsayhealth.com, 2019). Hence, it
Paraphrase This Document
Need a fresh take? Get an instant paraphrase of this document with our AI Paraphraser
BUSINESS FINANCE
4
could be understood that investment in Ansell Limited would be more beneficial, as risk
attributes of the investment is relevantly low (Ramsayhealth.com, 2019).
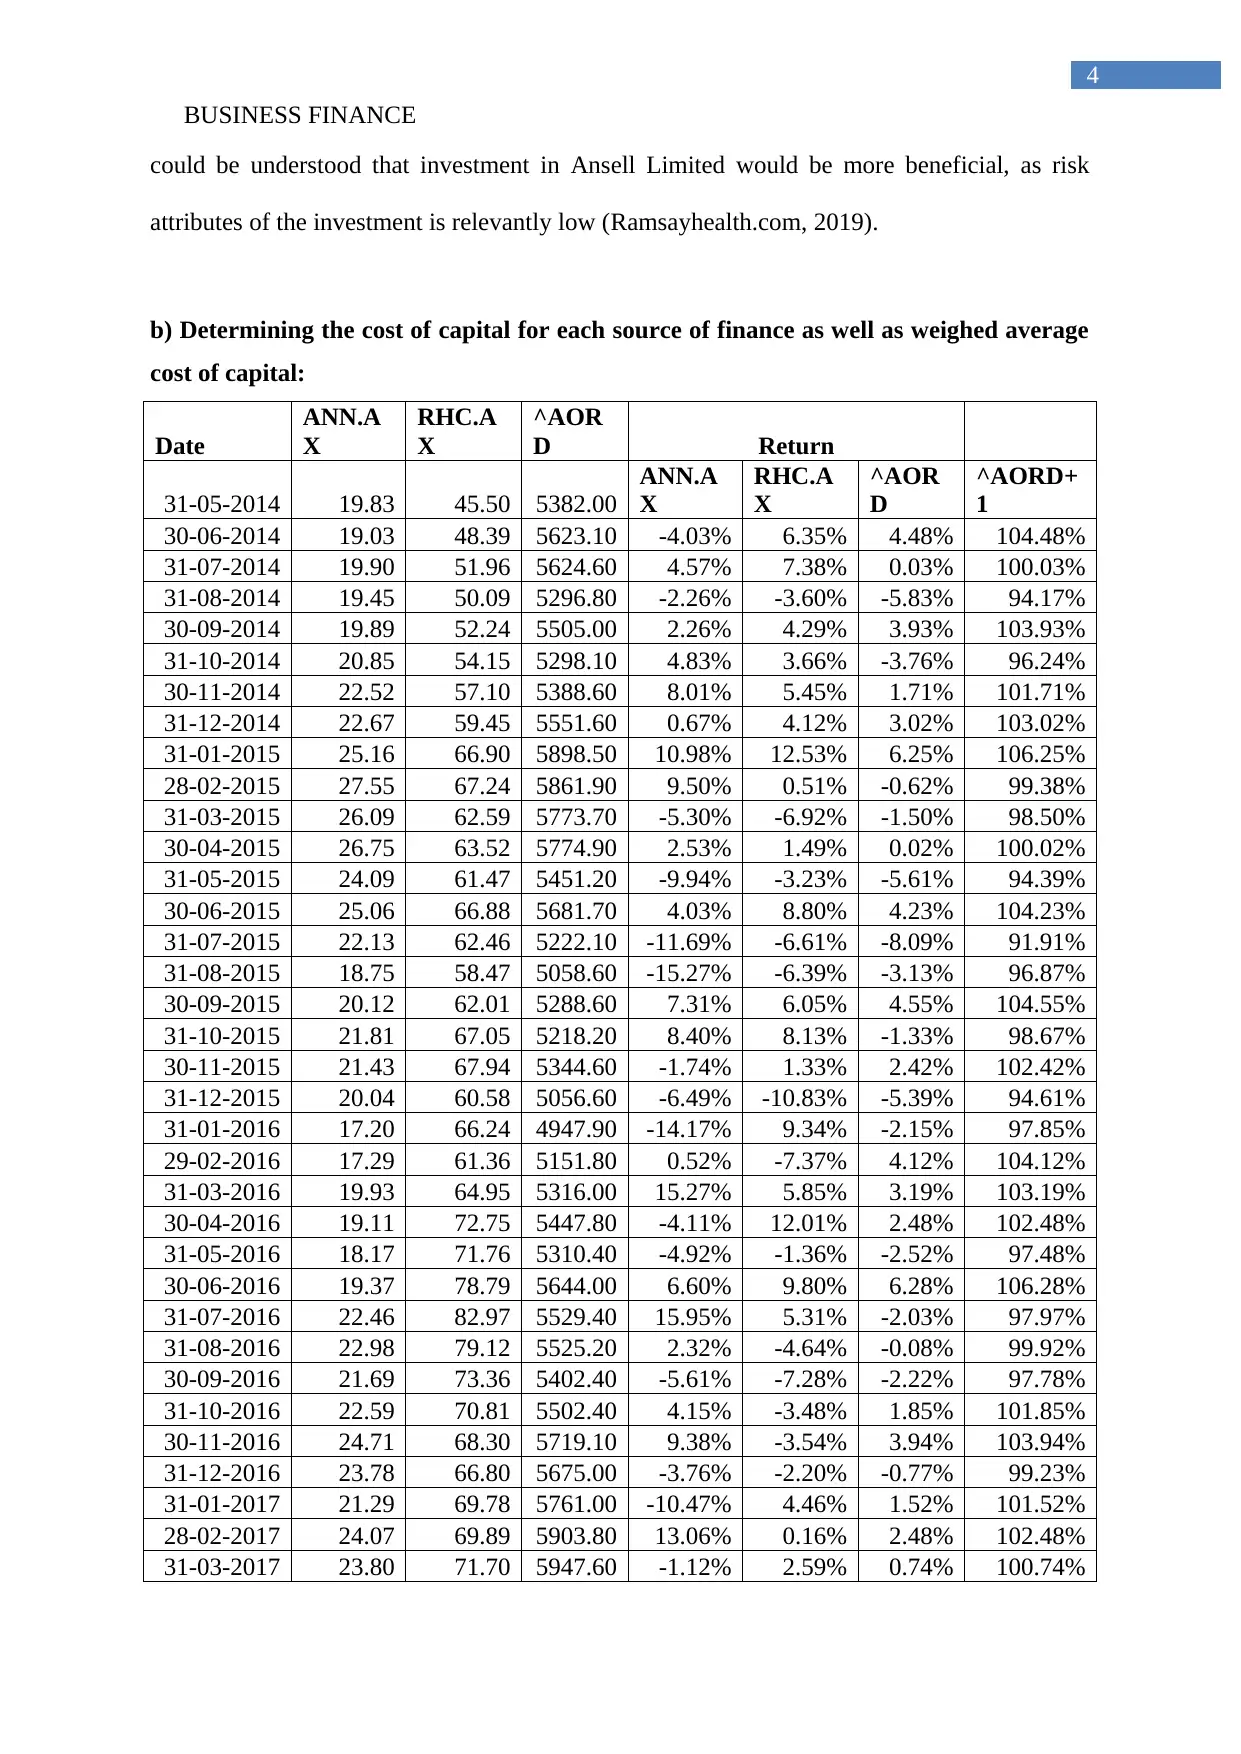
b) Determining the cost of capital for each source of finance as well as weighed average
cost of capital:
Date
ANN.A
X
RHC.A
X
^AOR
D Return
31-05-2014 19.83 45.50 5382.00
ANN.A
X
RHC.A
X
^AOR
D
^AORD+
1
30-06-2014 19.03 48.39 5623.10 -4.03% 6.35% 4.48% 104.48%
31-07-2014 19.90 51.96 5624.60 4.57% 7.38% 0.03% 100.03%
31-08-2014 19.45 50.09 5296.80 -2.26% -3.60% -5.83% 94.17%
30-09-2014 19.89 52.24 5505.00 2.26% 4.29% 3.93% 103.93%
31-10-2014 20.85 54.15 5298.10 4.83% 3.66% -3.76% 96.24%
30-11-2014 22.52 57.10 5388.60 8.01% 5.45% 1.71% 101.71%
31-12-2014 22.67 59.45 5551.60 0.67% 4.12% 3.02% 103.02%
31-01-2015 25.16 66.90 5898.50 10.98% 12.53% 6.25% 106.25%
28-02-2015 27.55 67.24 5861.90 9.50% 0.51% -0.62% 99.38%
31-03-2015 26.09 62.59 5773.70 -5.30% -6.92% -1.50% 98.50%
30-04-2015 26.75 63.52 5774.90 2.53% 1.49% 0.02% 100.02%
31-05-2015 24.09 61.47 5451.20 -9.94% -3.23% -5.61% 94.39%
30-06-2015 25.06 66.88 5681.70 4.03% 8.80% 4.23% 104.23%
31-07-2015 22.13 62.46 5222.10 -11.69% -6.61% -8.09% 91.91%
31-08-2015 18.75 58.47 5058.60 -15.27% -6.39% -3.13% 96.87%
30-09-2015 20.12 62.01 5288.60 7.31% 6.05% 4.55% 104.55%
31-10-2015 21.81 67.05 5218.20 8.40% 8.13% -1.33% 98.67%
30-11-2015 21.43 67.94 5344.60 -1.74% 1.33% 2.42% 102.42%
31-12-2015 20.04 60.58 5056.60 -6.49% -10.83% -5.39% 94.61%
31-01-2016 17.20 66.24 4947.90 -14.17% 9.34% -2.15% 97.85%
29-02-2016 17.29 61.36 5151.80 0.52% -7.37% 4.12% 104.12%
31-03-2016 19.93 64.95 5316.00 15.27% 5.85% 3.19% 103.19%
30-04-2016 19.11 72.75 5447.80 -4.11% 12.01% 2.48% 102.48%
31-05-2016 18.17 71.76 5310.40 -4.92% -1.36% -2.52% 97.48%
30-06-2016 19.37 78.79 5644.00 6.60% 9.80% 6.28% 106.28%
31-07-2016 22.46 82.97 5529.40 15.95% 5.31% -2.03% 97.97%
31-08-2016 22.98 79.12 5525.20 2.32% -4.64% -0.08% 99.92%
30-09-2016 21.69 73.36 5402.40 -5.61% -7.28% -2.22% 97.78%
31-10-2016 22.59 70.81 5502.40 4.15% -3.48% 1.85% 101.85%
30-11-2016 24.71 68.30 5719.10 9.38% -3.54% 3.94% 103.94%
31-12-2016 23.78 66.80 5675.00 -3.76% -2.20% -0.77% 99.23%
31-01-2017 21.29 69.78 5761.00 -10.47% 4.46% 1.52% 101.52%
28-02-2017 24.07 69.89 5903.80 13.06% 0.16% 2.48% 102.48%
31-03-2017 23.80 71.70 5947.60 -1.12% 2.59% 0.74% 100.74%
4
could be understood that investment in Ansell Limited would be more beneficial, as risk
attributes of the investment is relevantly low (Ramsayhealth.com, 2019).
b) Determining the cost of capital for each source of finance as well as weighed average
cost of capital:
Date
ANN.A
X
RHC.A
X
^AOR
D Return
31-05-2014 19.83 45.50 5382.00
ANN.A
X
RHC.A
X
^AOR
D
^AORD+
1
30-06-2014 19.03 48.39 5623.10 -4.03% 6.35% 4.48% 104.48%
31-07-2014 19.90 51.96 5624.60 4.57% 7.38% 0.03% 100.03%
31-08-2014 19.45 50.09 5296.80 -2.26% -3.60% -5.83% 94.17%
30-09-2014 19.89 52.24 5505.00 2.26% 4.29% 3.93% 103.93%
31-10-2014 20.85 54.15 5298.10 4.83% 3.66% -3.76% 96.24%
30-11-2014 22.52 57.10 5388.60 8.01% 5.45% 1.71% 101.71%
31-12-2014 22.67 59.45 5551.60 0.67% 4.12% 3.02% 103.02%
31-01-2015 25.16 66.90 5898.50 10.98% 12.53% 6.25% 106.25%
28-02-2015 27.55 67.24 5861.90 9.50% 0.51% -0.62% 99.38%
31-03-2015 26.09 62.59 5773.70 -5.30% -6.92% -1.50% 98.50%
30-04-2015 26.75 63.52 5774.90 2.53% 1.49% 0.02% 100.02%
31-05-2015 24.09 61.47 5451.20 -9.94% -3.23% -5.61% 94.39%
30-06-2015 25.06 66.88 5681.70 4.03% 8.80% 4.23% 104.23%
31-07-2015 22.13 62.46 5222.10 -11.69% -6.61% -8.09% 91.91%
31-08-2015 18.75 58.47 5058.60 -15.27% -6.39% -3.13% 96.87%
30-09-2015 20.12 62.01 5288.60 7.31% 6.05% 4.55% 104.55%
31-10-2015 21.81 67.05 5218.20 8.40% 8.13% -1.33% 98.67%
30-11-2015 21.43 67.94 5344.60 -1.74% 1.33% 2.42% 102.42%
31-12-2015 20.04 60.58 5056.60 -6.49% -10.83% -5.39% 94.61%
31-01-2016 17.20 66.24 4947.90 -14.17% 9.34% -2.15% 97.85%
29-02-2016 17.29 61.36 5151.80 0.52% -7.37% 4.12% 104.12%
31-03-2016 19.93 64.95 5316.00 15.27% 5.85% 3.19% 103.19%
30-04-2016 19.11 72.75 5447.80 -4.11% 12.01% 2.48% 102.48%
31-05-2016 18.17 71.76 5310.40 -4.92% -1.36% -2.52% 97.48%
30-06-2016 19.37 78.79 5644.00 6.60% 9.80% 6.28% 106.28%
31-07-2016 22.46 82.97 5529.40 15.95% 5.31% -2.03% 97.97%
31-08-2016 22.98 79.12 5525.20 2.32% -4.64% -0.08% 99.92%
30-09-2016 21.69 73.36 5402.40 -5.61% -7.28% -2.22% 97.78%
31-10-2016 22.59 70.81 5502.40 4.15% -3.48% 1.85% 101.85%
30-11-2016 24.71 68.30 5719.10 9.38% -3.54% 3.94% 103.94%
31-12-2016 23.78 66.80 5675.00 -3.76% -2.20% -0.77% 99.23%
31-01-2017 21.29 69.78 5761.00 -10.47% 4.46% 1.52% 101.52%
28-02-2017 24.07 69.89 5903.80 13.06% 0.16% 2.48% 102.48%
31-03-2017 23.80 71.70 5947.60 -1.12% 2.59% 0.74% 100.74%
BUSINESS FINANCE
5
30-04-2017 23.36 68.93 5761.30 -1.85% -3.86% -3.13% 96.87%
31-05-2017 23.73 73.60 5764.00 1.58% 6.77% 0.05% 100.05%
30-06-2017 21.97 70.58 5773.90 -7.42% -4.10% 0.17% 100.17%
31-07-2017 21.82 68.31 5776.30 -0.68% -3.22% 0.04% 100.04%
31-08-2017 22.28 62.28 5744.90 2.11% -8.83% -0.54% 99.46%
30-09-2017 24.00 66.91 5976.40 7.72% 7.43% 4.03% 104.03%
31-10-2017 24.53 69.78 6057.20 2.21% 4.29% 1.35% 101.35%
30-11-2017 24.30 70.12 6167.30 -0.94% 0.49% 1.82% 101.82%
31-12-2017 25.15 68.35 6146.50 3.50% -2.52% -0.34% 99.66%
31-01-2018 26.25 63.90 6117.30 4.37% -6.51% -0.48% 99.52%
28-02-2018 25.26 62.32 5868.90 -3.77% -2.47% -4.06% 95.94%
31-03-2018 26.08 64.69 6071.60 3.25% 3.80% 3.45% 103.45%
30-04-2018 26.25 61.33 6123.50 0.65% -5.19% 0.85% 100.85%
31-05-2018 27.19 53.98 6289.70 3.58% -11.98% 2.71% 102.71%
30-06-2018 28.81 56.24 6366.20 5.96% 4.19% 1.22% 101.22%
31-07-2018 25.10 55.70 6427.80 -12.88% -0.96% 0.97% 100.97%
31-08-2018 25.25 54.93 6325.50 0.60% -1.38% -1.59% 98.41%
30-09-2018 23.18 56.22 5913.30 -8.20% 2.35% -6.52% 93.48%
31-10-2018 22.81 54.22 5749.30 -1.60% -3.56% -2.77% 97.23%
30-11-2018 22.04 57.73 5709.40 -3.38% 6.47% -0.69% 99.31%
31-12-2018 23.42 56.72 5937.30 6.26% -1.75% 3.99% 103.99%
31-01-2019 24.62 64.78 6252.70 5.12% 14.21% 5.31% 105.31%
28-02-2019 25.42 64.35 6261.70 3.25% -0.66% 0.14% 100.14%
31-03-2019 27.00 65.32 6418.40 6.22% 1.51% 2.50% 102.50%
30-04-2019 26.73 70.25 6545.60 -1.00% 7.55% 1.98% 101.98%
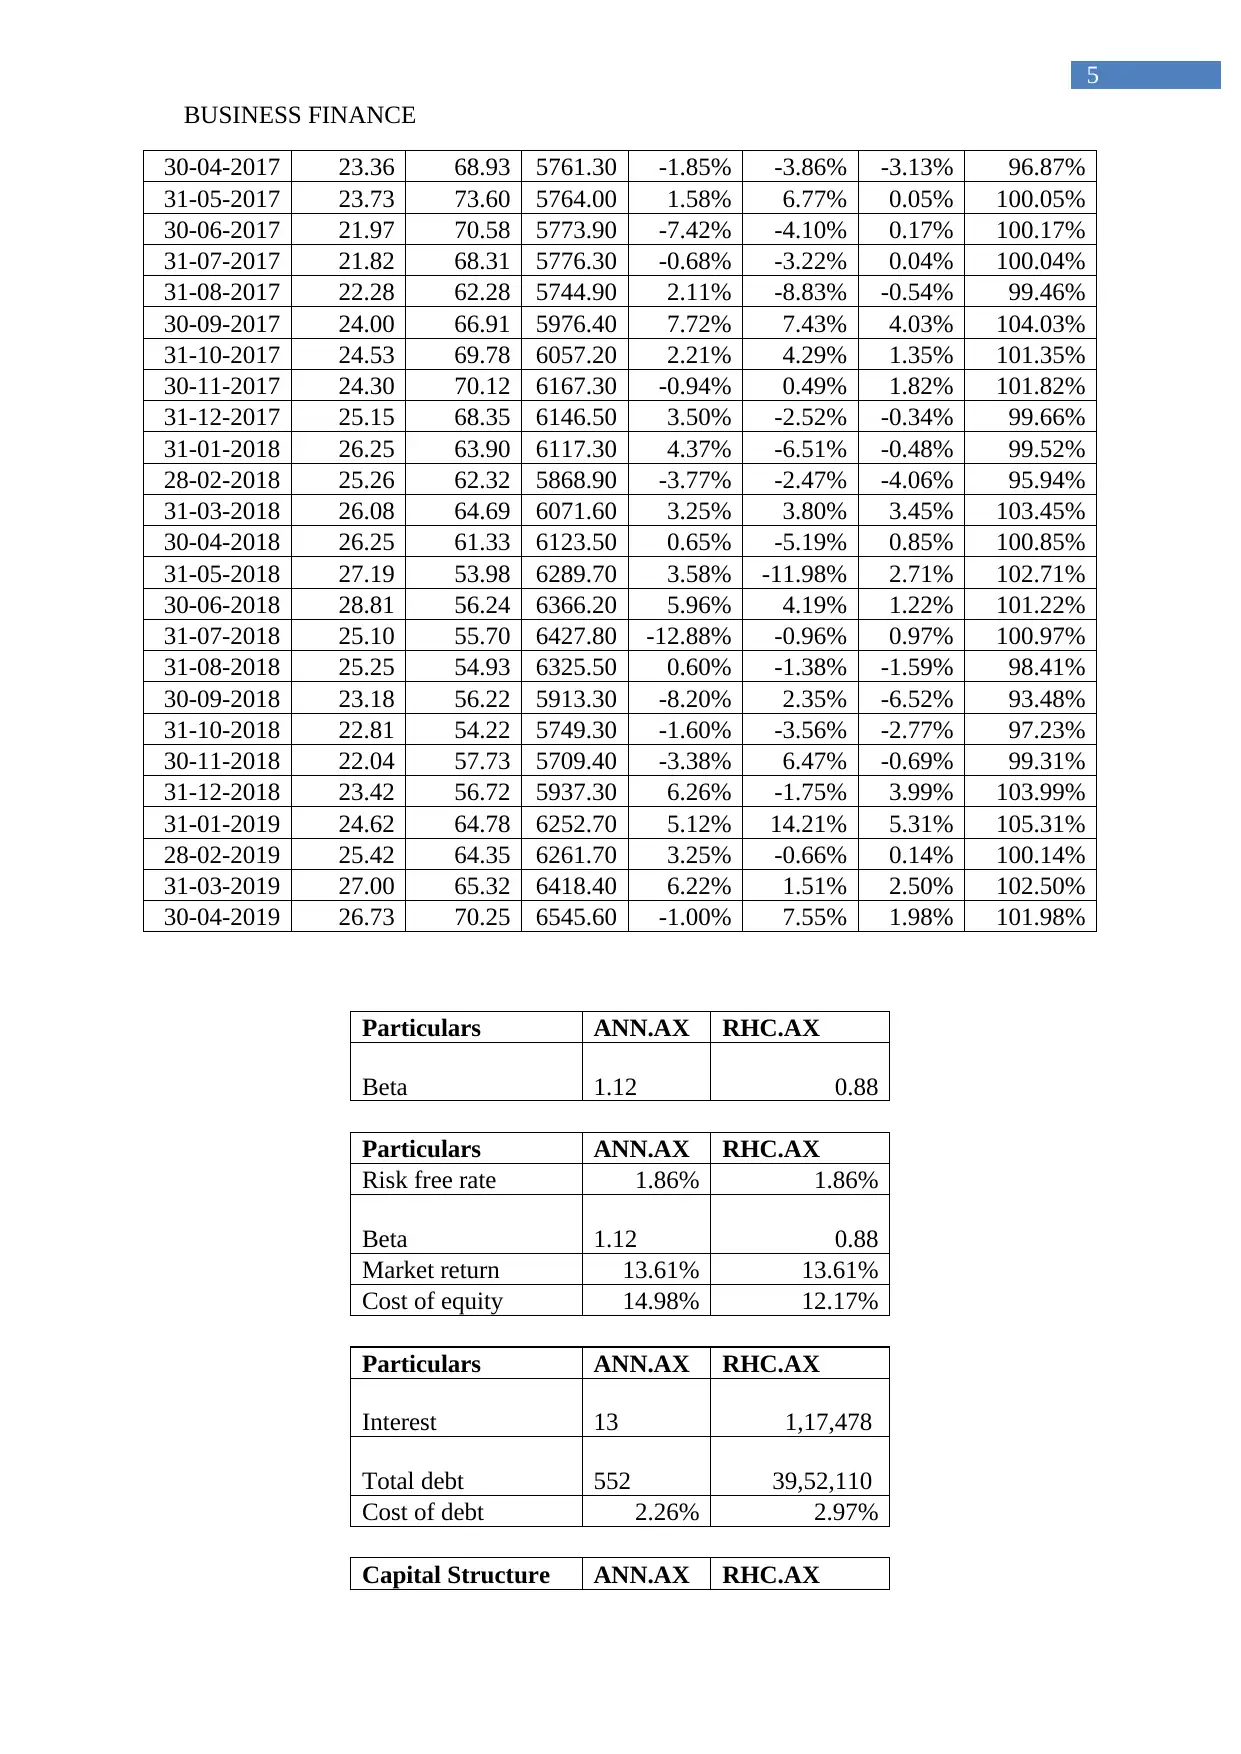
Particulars ANN.AX RHC.AX
Beta 1.12 0.88
Particulars ANN.AX RHC.AX
Risk free rate 1.86% 1.86%
Beta 1.12 0.88
Market return 13.61% 13.61%
Cost of equity 14.98% 12.17%
Particulars ANN.AX RHC.AX
Interest 13 1,17,478
Total debt 552 39,52,110
Cost of debt 2.26% 2.97%
Capital Structure ANN.AX RHC.AX
5
30-04-2017 23.36 68.93 5761.30 -1.85% -3.86% -3.13% 96.87%
31-05-2017 23.73 73.60 5764.00 1.58% 6.77% 0.05% 100.05%
30-06-2017 21.97 70.58 5773.90 -7.42% -4.10% 0.17% 100.17%
31-07-2017 21.82 68.31 5776.30 -0.68% -3.22% 0.04% 100.04%
31-08-2017 22.28 62.28 5744.90 2.11% -8.83% -0.54% 99.46%
30-09-2017 24.00 66.91 5976.40 7.72% 7.43% 4.03% 104.03%
31-10-2017 24.53 69.78 6057.20 2.21% 4.29% 1.35% 101.35%
30-11-2017 24.30 70.12 6167.30 -0.94% 0.49% 1.82% 101.82%
31-12-2017 25.15 68.35 6146.50 3.50% -2.52% -0.34% 99.66%
31-01-2018 26.25 63.90 6117.30 4.37% -6.51% -0.48% 99.52%
28-02-2018 25.26 62.32 5868.90 -3.77% -2.47% -4.06% 95.94%
31-03-2018 26.08 64.69 6071.60 3.25% 3.80% 3.45% 103.45%
30-04-2018 26.25 61.33 6123.50 0.65% -5.19% 0.85% 100.85%
31-05-2018 27.19 53.98 6289.70 3.58% -11.98% 2.71% 102.71%
30-06-2018 28.81 56.24 6366.20 5.96% 4.19% 1.22% 101.22%
31-07-2018 25.10 55.70 6427.80 -12.88% -0.96% 0.97% 100.97%
31-08-2018 25.25 54.93 6325.50 0.60% -1.38% -1.59% 98.41%
30-09-2018 23.18 56.22 5913.30 -8.20% 2.35% -6.52% 93.48%
31-10-2018 22.81 54.22 5749.30 -1.60% -3.56% -2.77% 97.23%
30-11-2018 22.04 57.73 5709.40 -3.38% 6.47% -0.69% 99.31%
31-12-2018 23.42 56.72 5937.30 6.26% -1.75% 3.99% 103.99%
31-01-2019 24.62 64.78 6252.70 5.12% 14.21% 5.31% 105.31%
28-02-2019 25.42 64.35 6261.70 3.25% -0.66% 0.14% 100.14%
31-03-2019 27.00 65.32 6418.40 6.22% 1.51% 2.50% 102.50%
30-04-2019 26.73 70.25 6545.60 -1.00% 7.55% 1.98% 101.98%
Particulars ANN.AX RHC.AX
Beta 1.12 0.88
Particulars ANN.AX RHC.AX
Risk free rate 1.86% 1.86%
Beta 1.12 0.88
Market return 13.61% 13.61%
Cost of equity 14.98% 12.17%
Particulars ANN.AX RHC.AX
Interest 13 1,17,478
Total debt 552 39,52,110
Cost of debt 2.26% 2.97%
Capital Structure ANN.AX RHC.AX
⊘ This is a preview!⊘
Do you want full access?
Subscribe today to unlock all pages.
Trusted by 1+ million students worldwide
BUSINESS FINANCE
6
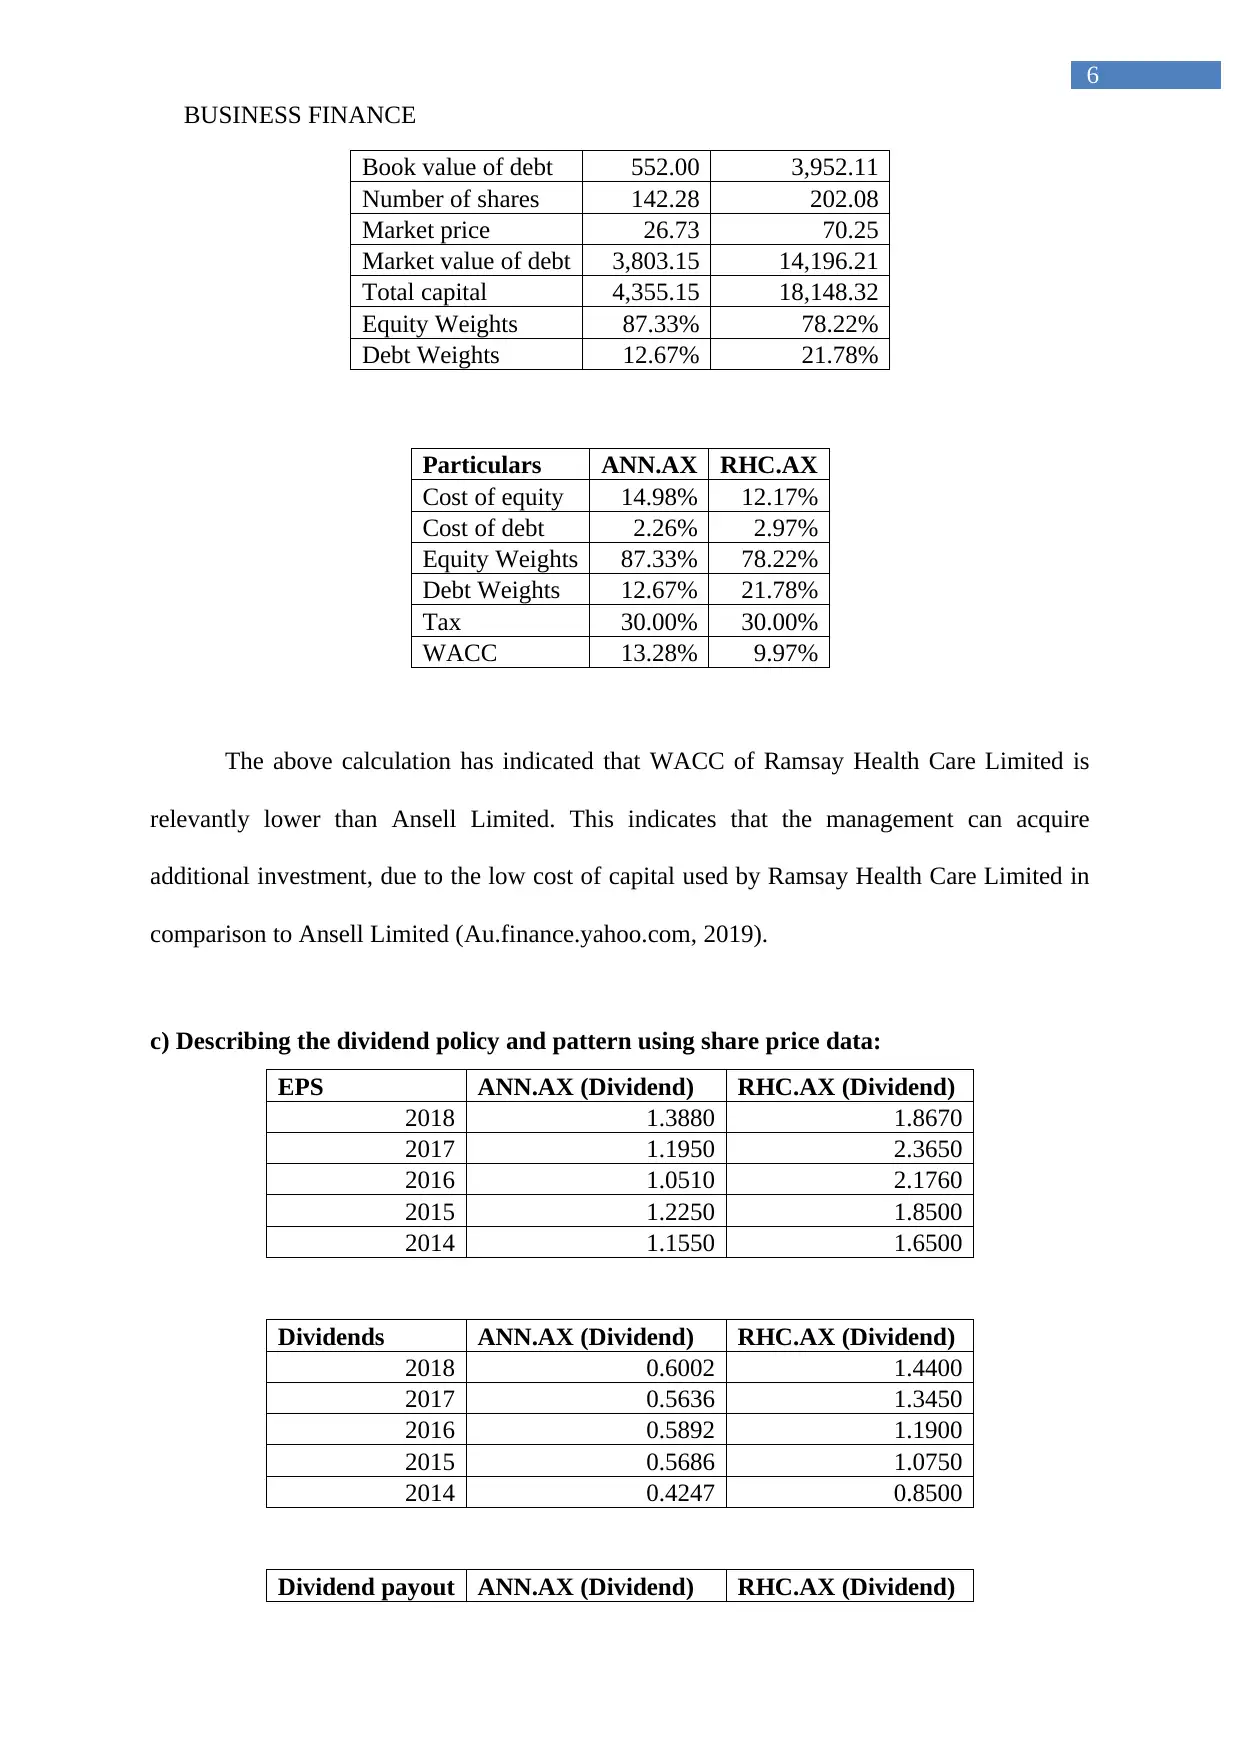
Book value of debt 552.00 3,952.11
Number of shares 142.28 202.08
Market price 26.73 70.25
Market value of debt 3,803.15 14,196.21
Total capital 4,355.15 18,148.32
Equity Weights 87.33% 78.22%
Debt Weights 12.67% 21.78%
Particulars ANN.AX RHC.AX
Cost of equity 14.98% 12.17%
Cost of debt 2.26% 2.97%
Equity Weights 87.33% 78.22%
Debt Weights 12.67% 21.78%
Tax 30.00% 30.00%
WACC 13.28% 9.97%
The above calculation has indicated that WACC of Ramsay Health Care Limited is
relevantly lower than Ansell Limited. This indicates that the management can acquire
additional investment, due to the low cost of capital used by Ramsay Health Care Limited in
comparison to Ansell Limited (Au.finance.yahoo.com, 2019).
c) Describing the dividend policy and pattern using share price data:
EPS ANN.AX (Dividend) RHC.AX (Dividend)
2018 1.3880 1.8670
2017 1.1950 2.3650
2016 1.0510 2.1760
2015 1.2250 1.8500
2014 1.1550 1.6500
Dividends ANN.AX (Dividend) RHC.AX (Dividend)
2018 0.6002 1.4400
2017 0.5636 1.3450
2016 0.5892 1.1900
2015 0.5686 1.0750
2014 0.4247 0.8500
Dividend payout ANN.AX (Dividend) RHC.AX (Dividend)
6
Book value of debt 552.00 3,952.11
Number of shares 142.28 202.08
Market price 26.73 70.25
Market value of debt 3,803.15 14,196.21
Total capital 4,355.15 18,148.32
Equity Weights 87.33% 78.22%
Debt Weights 12.67% 21.78%
Particulars ANN.AX RHC.AX
Cost of equity 14.98% 12.17%
Cost of debt 2.26% 2.97%
Equity Weights 87.33% 78.22%
Debt Weights 12.67% 21.78%
Tax 30.00% 30.00%
WACC 13.28% 9.97%
The above calculation has indicated that WACC of Ramsay Health Care Limited is
relevantly lower than Ansell Limited. This indicates that the management can acquire
additional investment, due to the low cost of capital used by Ramsay Health Care Limited in
comparison to Ansell Limited (Au.finance.yahoo.com, 2019).
c) Describing the dividend policy and pattern using share price data:
EPS ANN.AX (Dividend) RHC.AX (Dividend)
2018 1.3880 1.8670
2017 1.1950 2.3650
2016 1.0510 2.1760
2015 1.2250 1.8500
2014 1.1550 1.6500
Dividends ANN.AX (Dividend) RHC.AX (Dividend)
2018 0.6002 1.4400
2017 0.5636 1.3450
2016 0.5892 1.1900
2015 0.5686 1.0750
2014 0.4247 0.8500
Dividend payout ANN.AX (Dividend) RHC.AX (Dividend)
Paraphrase This Document
Need a fresh take? Get an instant paraphrase of this document with our AI Paraphraser
BUSINESS FINANCE
7
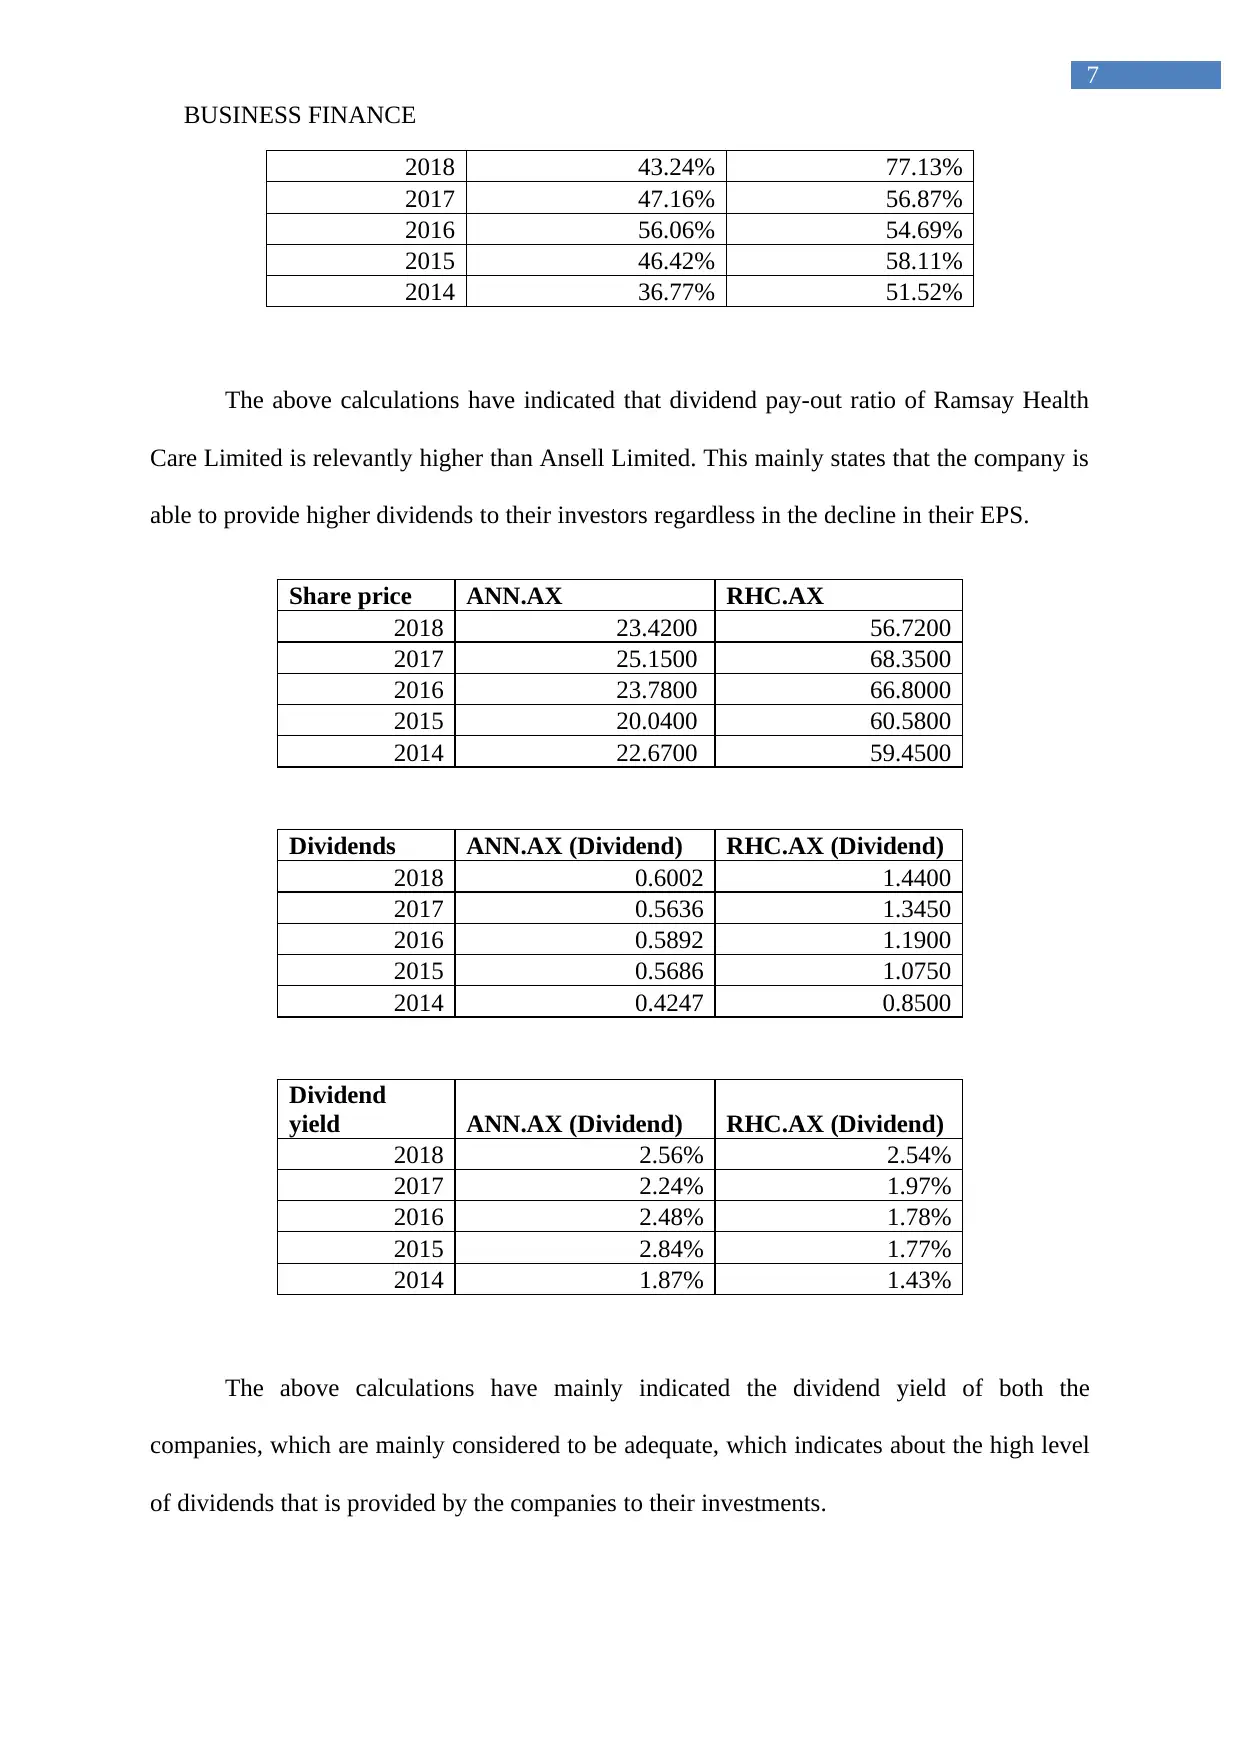
2018 43.24% 77.13%
2017 47.16% 56.87%
2016 56.06% 54.69%
2015 46.42% 58.11%
2014 36.77% 51.52%
The above calculations have indicated that dividend pay-out ratio of Ramsay Health
Care Limited is relevantly higher than Ansell Limited. This mainly states that the company is
able to provide higher dividends to their investors regardless in the decline in their EPS.
Share price ANN.AX RHC.AX
2018 23.4200 56.7200
2017 25.1500 68.3500
2016 23.7800 66.8000
2015 20.0400 60.5800
2014 22.6700 59.4500
Dividends ANN.AX (Dividend) RHC.AX (Dividend)
2018 0.6002 1.4400
2017 0.5636 1.3450
2016 0.5892 1.1900
2015 0.5686 1.0750
2014 0.4247 0.8500
Dividend
yield ANN.AX (Dividend) RHC.AX (Dividend)
2018 2.56% 2.54%
2017 2.24% 1.97%
2016 2.48% 1.78%
2015 2.84% 1.77%
2014 1.87% 1.43%
The above calculations have mainly indicated the dividend yield of both the
companies, which are mainly considered to be adequate, which indicates about the high level
of dividends that is provided by the companies to their investments.
7
2018 43.24% 77.13%
2017 47.16% 56.87%
2016 56.06% 54.69%
2015 46.42% 58.11%
2014 36.77% 51.52%
The above calculations have indicated that dividend pay-out ratio of Ramsay Health
Care Limited is relevantly higher than Ansell Limited. This mainly states that the company is
able to provide higher dividends to their investors regardless in the decline in their EPS.
Share price ANN.AX RHC.AX
2018 23.4200 56.7200
2017 25.1500 68.3500
2016 23.7800 66.8000
2015 20.0400 60.5800
2014 22.6700 59.4500
Dividends ANN.AX (Dividend) RHC.AX (Dividend)
2018 0.6002 1.4400
2017 0.5636 1.3450
2016 0.5892 1.1900
2015 0.5686 1.0750
2014 0.4247 0.8500
Dividend
yield ANN.AX (Dividend) RHC.AX (Dividend)
2018 2.56% 2.54%
2017 2.24% 1.97%
2016 2.48% 1.78%
2015 2.84% 1.77%
2014 1.87% 1.43%
The above calculations have mainly indicated the dividend yield of both the
companies, which are mainly considered to be adequate, which indicates about the high level
of dividends that is provided by the companies to their investments.
BUSINESS FINANCE
8
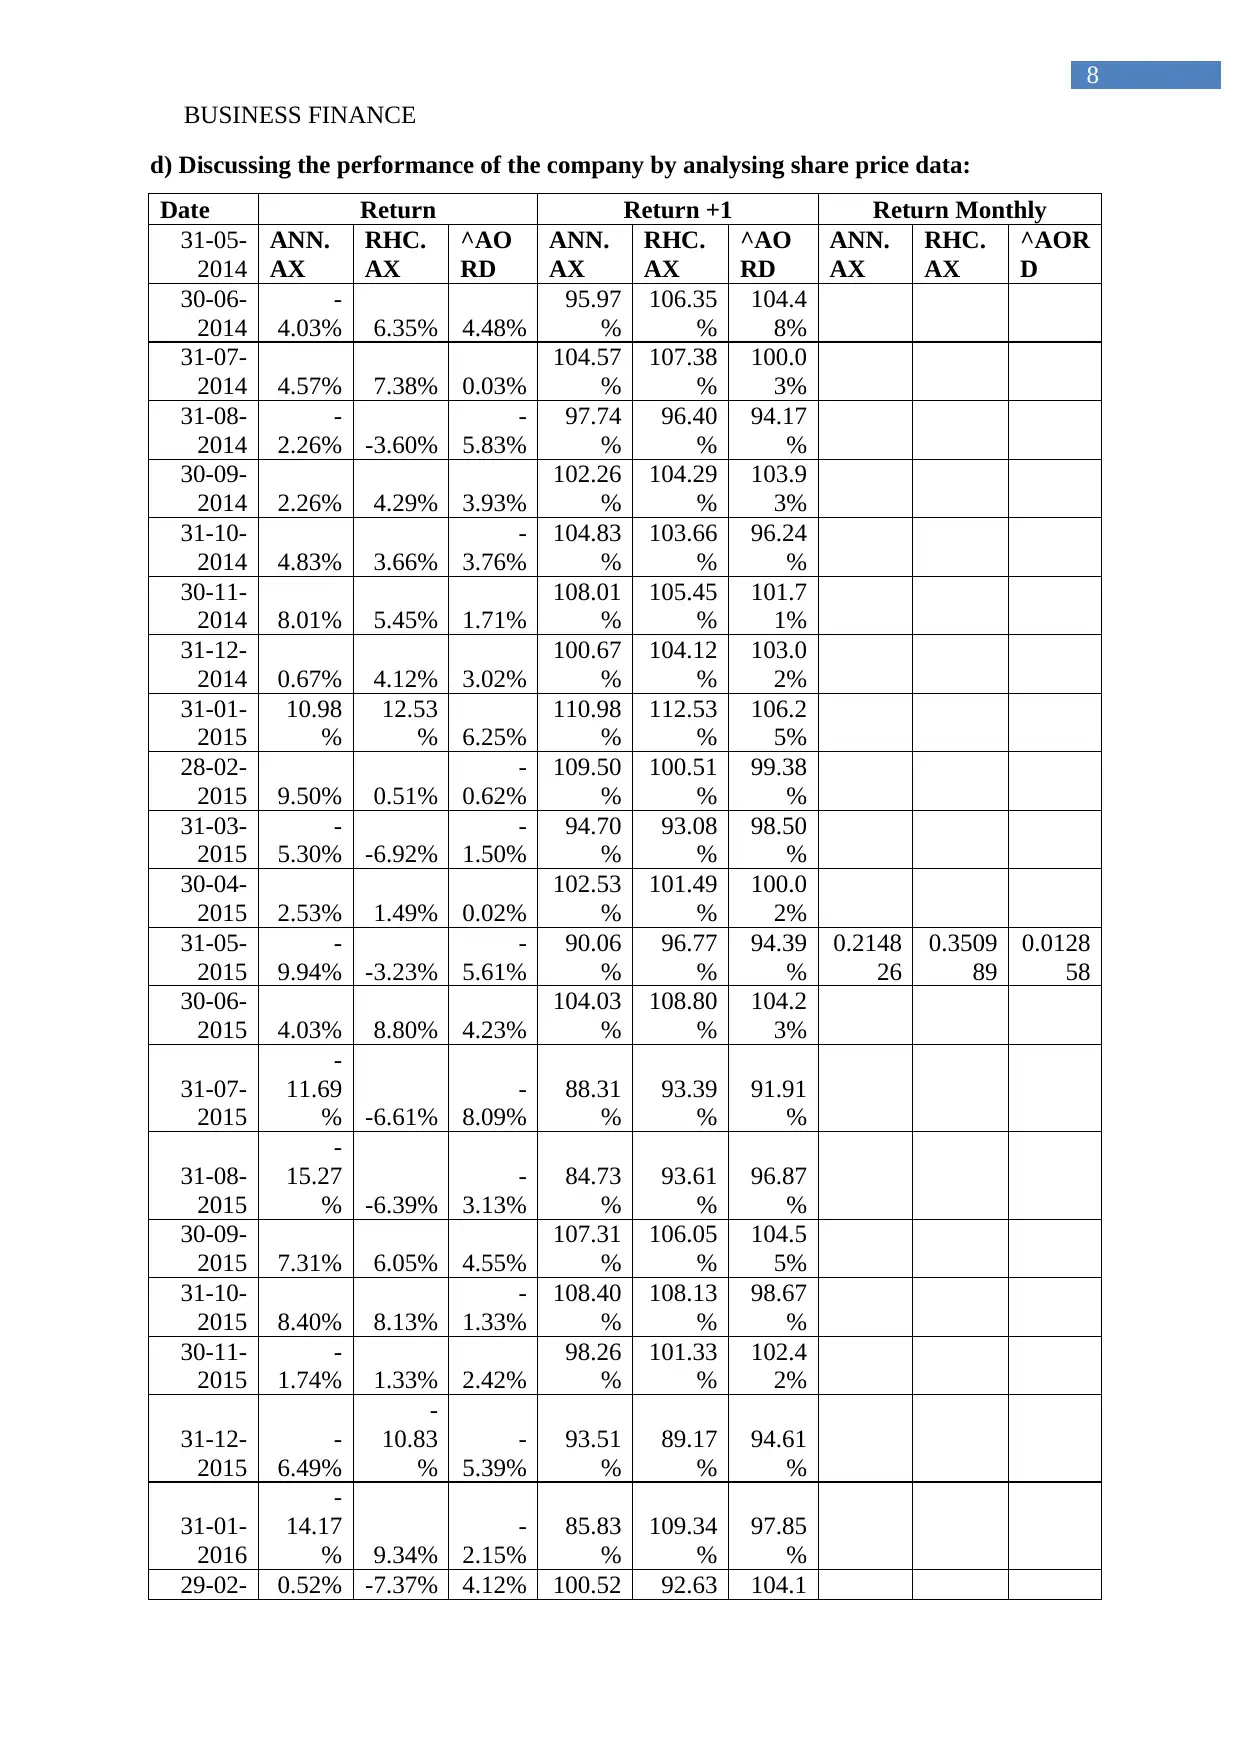
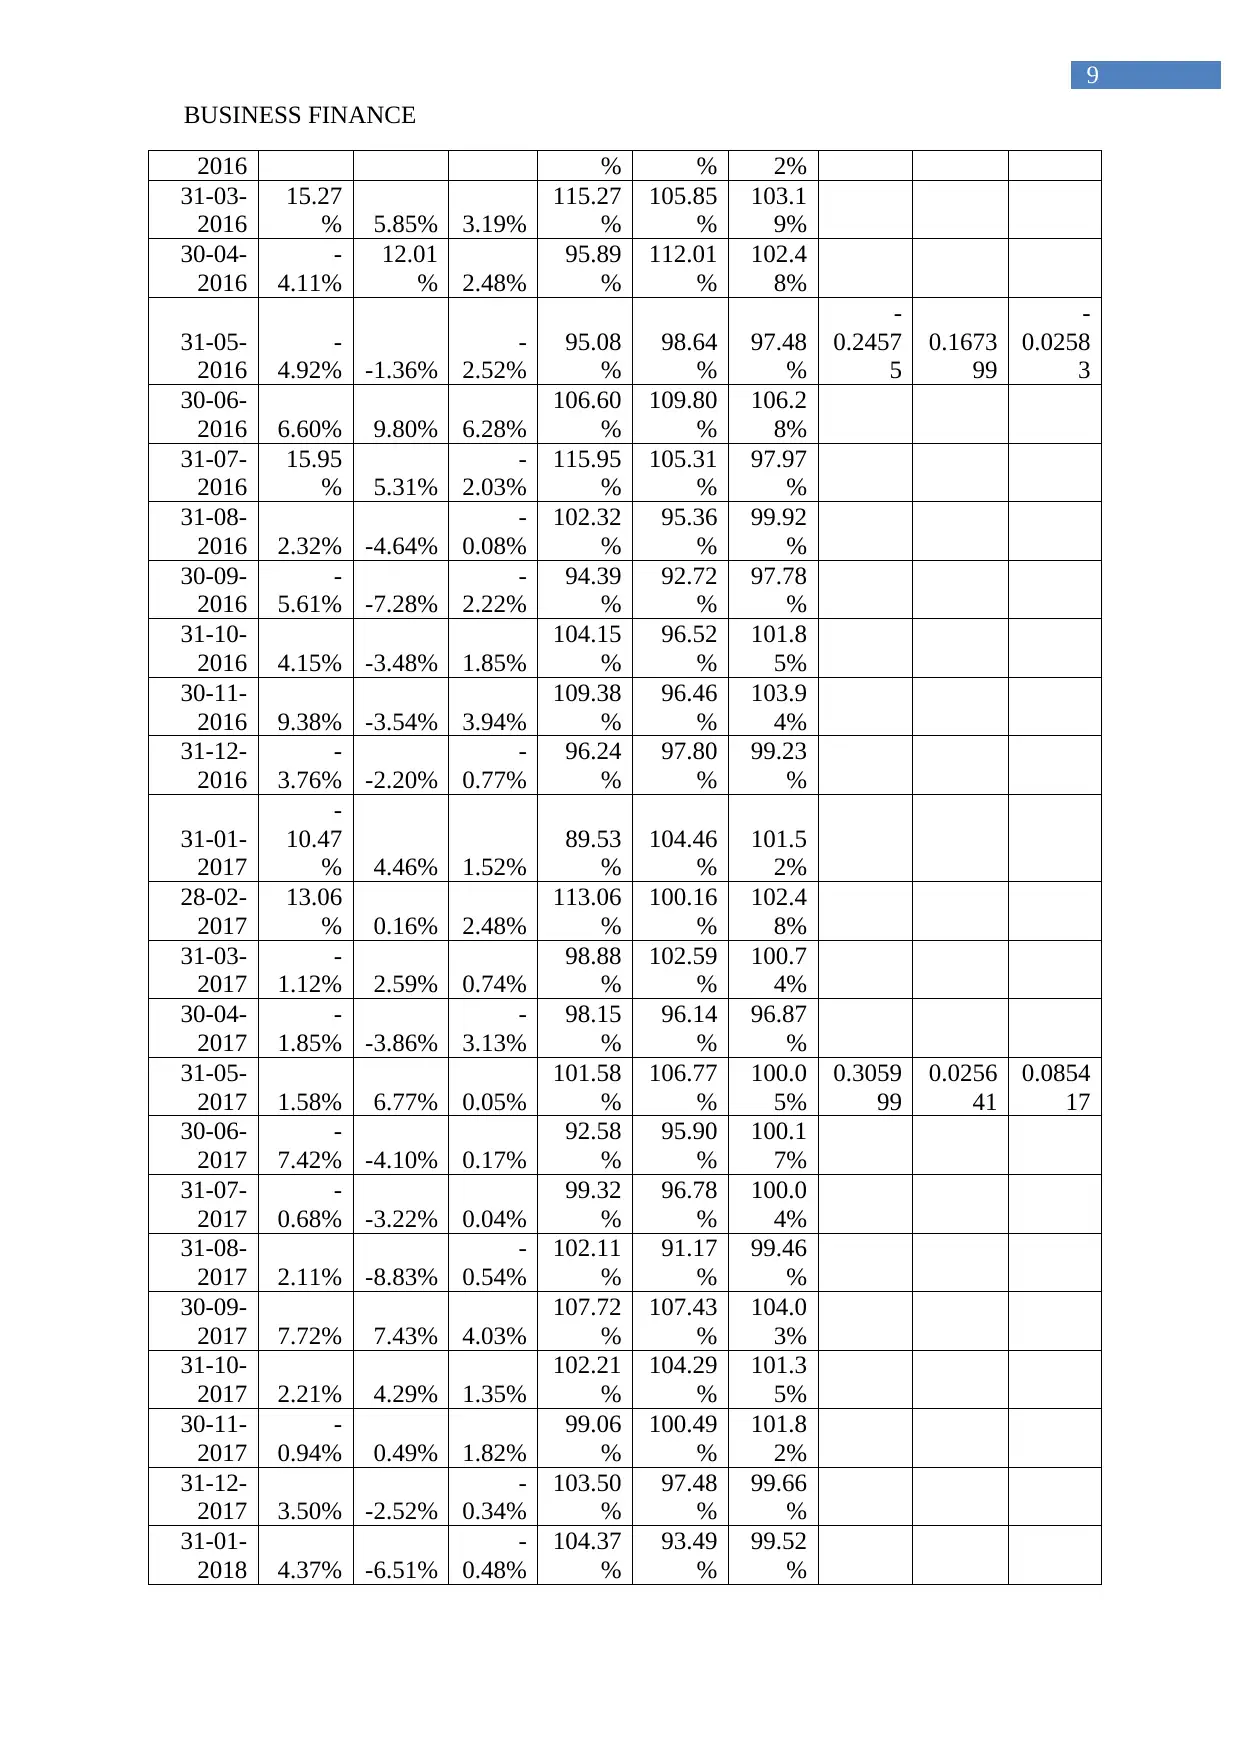
d) Discussing the performance of the company by analysing share price data:
Date Return Return +1 Return Monthly
31-05-
2014
ANN.
AX
RHC.
AX
^AO
RD
ANN.
AX
RHC.
AX
^AO
RD
ANN.
AX
RHC.
AX
^AOR
D
30-06-
2014
-
4.03% 6.35% 4.48%
95.97
%
106.35
%
104.4
8%
31-07-
2014 4.57% 7.38% 0.03%
104.57
%
107.38
%
100.0
3%
31-08-
2014
-
2.26% -3.60%
-
5.83%
97.74
%
96.40
%
94.17
%
30-09-
2014 2.26% 4.29% 3.93%
102.26
%
104.29
%
103.9
3%
31-10-
2014 4.83% 3.66%
-
3.76%
104.83
%
103.66
%
96.24
%
30-11-
2014 8.01% 5.45% 1.71%
108.01
%
105.45
%
101.7
1%
31-12-
2014 0.67% 4.12% 3.02%
100.67
%
104.12
%
103.0
2%
31-01-
2015
10.98
%
12.53
% 6.25%
110.98
%
112.53
%
106.2
5%
28-02-
2015 9.50% 0.51%
-
0.62%
109.50
%
100.51
%
99.38
%
31-03-
2015
-
5.30% -6.92%
-
1.50%
94.70
%
93.08
%
98.50
%
30-04-
2015 2.53% 1.49% 0.02%
102.53
%
101.49
%
100.0
2%
31-05-
2015
-
9.94% -3.23%
-
5.61%
90.06
%
96.77
%
94.39
%
0.2148
26
0.3509
89
0.0128
58
30-06-
2015 4.03% 8.80% 4.23%
104.03
%
108.80
%
104.2
3%
31-07-
2015
-
11.69
% -6.61%
-
8.09%
88.31
%
93.39
%
91.91
%
31-08-
2015
-
15.27
% -6.39%
-
3.13%
84.73
%
93.61
%
96.87
%
30-09-
2015 7.31% 6.05% 4.55%
107.31
%
106.05
%
104.5
5%
31-10-
2015 8.40% 8.13%
-
1.33%
108.40
%
108.13
%
98.67
%
30-11-
2015
-
1.74% 1.33% 2.42%
98.26
%
101.33
%
102.4
2%
31-12-
2015
-
6.49%
-
10.83
%
-
5.39%
93.51
%
89.17
%
94.61
%
31-01-
2016
-
14.17
% 9.34%
-
2.15%
85.83
%
109.34
%
97.85
%
29-02- 0.52% -7.37% 4.12% 100.52 92.63 104.1
8
d) Discussing the performance of the company by analysing share price data:
Date Return Return +1 Return Monthly
31-05-
2014
ANN.
AX
RHC.
AX
^AO
RD
ANN.
AX
RHC.
AX
^AO
RD
ANN.
AX
RHC.
AX
^AOR
D
30-06-
2014
-
4.03% 6.35% 4.48%
95.97
%
106.35
%
104.4
8%
31-07-
2014 4.57% 7.38% 0.03%
104.57
%
107.38
%
100.0
3%
31-08-
2014
-
2.26% -3.60%
-
5.83%
97.74
%
96.40
%
94.17
%
30-09-
2014 2.26% 4.29% 3.93%
102.26
%
104.29
%
103.9
3%
31-10-
2014 4.83% 3.66%
-
3.76%
104.83
%
103.66
%
96.24
%
30-11-
2014 8.01% 5.45% 1.71%
108.01
%
105.45
%
101.7
1%
31-12-
2014 0.67% 4.12% 3.02%
100.67
%
104.12
%
103.0
2%
31-01-
2015
10.98
%
12.53
% 6.25%
110.98
%
112.53
%
106.2
5%
28-02-
2015 9.50% 0.51%
-
0.62%
109.50
%
100.51
%
99.38
%
31-03-
2015
-
5.30% -6.92%
-
1.50%
94.70
%
93.08
%
98.50
%
30-04-
2015 2.53% 1.49% 0.02%
102.53
%
101.49
%
100.0
2%
31-05-
2015
-
9.94% -3.23%
-
5.61%
90.06
%
96.77
%
94.39
%
0.2148
26
0.3509
89
0.0128
58
30-06-
2015 4.03% 8.80% 4.23%
104.03
%
108.80
%
104.2
3%
31-07-
2015
-
11.69
% -6.61%
-
8.09%
88.31
%
93.39
%
91.91
%
31-08-
2015
-
15.27
% -6.39%
-
3.13%
84.73
%
93.61
%
96.87
%
30-09-
2015 7.31% 6.05% 4.55%
107.31
%
106.05
%
104.5
5%
31-10-
2015 8.40% 8.13%
-
1.33%
108.40
%
108.13
%
98.67
%
30-11-
2015
-
1.74% 1.33% 2.42%
98.26
%
101.33
%
102.4
2%
31-12-
2015
-
6.49%
-
10.83
%
-
5.39%
93.51
%
89.17
%
94.61
%
31-01-
2016
-
14.17
% 9.34%
-
2.15%
85.83
%
109.34
%
97.85
%
29-02- 0.52% -7.37% 4.12% 100.52 92.63 104.1
⊘ This is a preview!⊘
Do you want full access?
Subscribe today to unlock all pages.
Trusted by 1+ million students worldwide
BUSINESS FINANCE
9
2016 % % 2%
31-03-
2016
15.27
% 5.85% 3.19%
115.27
%
105.85
%
103.1
9%
30-04-
2016
-
4.11%
12.01
% 2.48%
95.89
%
112.01
%
102.4
8%
31-05-
2016
-
4.92% -1.36%
-
2.52%
95.08
%
98.64
%
97.48
%
-
0.2457
5
0.1673
99
-
0.0258
3
30-06-
2016 6.60% 9.80% 6.28%
106.60
%
109.80
%
106.2
8%
31-07-
2016
15.95
% 5.31%
-
2.03%
115.95
%
105.31
%
97.97
%
31-08-
2016 2.32% -4.64%
-
0.08%
102.32
%
95.36
%
99.92
%
30-09-
2016
-
5.61% -7.28%
-
2.22%
94.39
%
92.72
%
97.78
%
31-10-
2016 4.15% -3.48% 1.85%
104.15
%
96.52
%
101.8
5%
30-11-
2016 9.38% -3.54% 3.94%
109.38
%
96.46
%
103.9
4%
31-12-
2016
-
3.76% -2.20%
-
0.77%
96.24
%
97.80
%
99.23
%
31-01-
2017
-
10.47
% 4.46% 1.52%
89.53
%
104.46
%
101.5
2%
28-02-
2017
13.06
% 0.16% 2.48%
113.06
%
100.16
%
102.4
8%
31-03-
2017
-
1.12% 2.59% 0.74%
98.88
%
102.59
%
100.7
4%
30-04-
2017
-
1.85% -3.86%
-
3.13%
98.15
%
96.14
%
96.87
%
31-05-
2017 1.58% 6.77% 0.05%
101.58
%
106.77
%
100.0
5%
0.3059
99
0.0256
41
0.0854
17
30-06-
2017
-
7.42% -4.10% 0.17%
92.58
%
95.90
%
100.1
7%
31-07-
2017
-
0.68% -3.22% 0.04%
99.32
%
96.78
%
100.0
4%
31-08-
2017 2.11% -8.83%
-
0.54%
102.11
%
91.17
%
99.46
%
30-09-
2017 7.72% 7.43% 4.03%
107.72
%
107.43
%
104.0
3%
31-10-
2017 2.21% 4.29% 1.35%
102.21
%
104.29
%
101.3
5%
30-11-
2017
-
0.94% 0.49% 1.82%
99.06
%
100.49
%
101.8
2%
31-12-
2017 3.50% -2.52%
-
0.34%
103.50
%
97.48
%
99.66
%
31-01-
2018 4.37% -6.51%
-
0.48%
104.37
%
93.49
%
99.52
%
Paraphrase This Document
Need a fresh take? Get an instant paraphrase of this document with our AI Paraphraser
BUSINESS FINANCE
10
28-02-
2018
-
3.77% -2.47%
-
4.06%
96.23
%
97.53
%
95.94
%
31-03-
2018 3.25% 3.80% 3.45%
103.25
%
103.80
%
103.4
5%
30-04-
2018 0.65% -5.19% 0.85%
100.65
%
94.81
%
100.8
5%
31-05-
2018 3.58%
-
11.98
% 2.71%
103.58
%
88.02
%
102.7
1%
0.1458
07
-
0.2665
8
0.0912
04
30-06-
2018 5.96% 4.19% 1.22%
105.96
%
104.19
%
101.2
2%
31-07-
2018
-
12.88
% -0.96% 0.97%
87.12
%
99.04
%
100.9
7%
31-08-
2018 0.60% -1.38%
-
1.59%
100.60
%
98.62
%
98.41
%
30-09-
2018
-
8.20% 2.35%
-
6.52%
91.80
%
102.35
%
93.48
%
31-10-
2018
-
1.60% -3.56%
-
2.77%
98.40
%
96.44
%
97.23
%
30-11-
2018
-
3.38% 6.47%
-
0.69%
96.62
%
106.47
%
99.31
%
31-12-
2018 6.26% -1.75% 3.99%
106.26
%
98.25
%
103.9
9%
31-01-
2019 5.12%
14.21
% 5.31%
105.12
%
114.21
%
105.3
1%
28-02-
2019 3.25% -0.66% 0.14%
103.25
%
99.34
%
100.1
4%
31-03-
2019 6.22% 1.51% 2.50%
106.22
%
101.51
%
102.5
0%
30-04-
2019
-
1.00% 7.55% 1.98%
99.00
%
107.55
%
101.9
8%
0.0182
86
0.1454
43
0.0689
31
Particular
s ANN.AX RHC.AX
Year 1 21.48% 35.10%
Year 2 -24.57% 16.74%
Year 3 30.60% 2.56%
Year 4 14.58% -26.66%
Year 5 1.83% 14.54%
Average 8.78% 8.46%
The calculation has mainly indicated that performance of Ramsay Health Care
Limited is relevantly lower than Ansell Limited. This has mainly indicated that investments
10
28-02-
2018
-
3.77% -2.47%
-
4.06%
96.23
%
97.53
%
95.94
%
31-03-
2018 3.25% 3.80% 3.45%
103.25
%
103.80
%
103.4
5%
30-04-
2018 0.65% -5.19% 0.85%
100.65
%
94.81
%
100.8
5%
31-05-
2018 3.58%
-
11.98
% 2.71%
103.58
%
88.02
%
102.7
1%
0.1458
07
-
0.2665
8
0.0912
04
30-06-
2018 5.96% 4.19% 1.22%
105.96
%
104.19
%
101.2
2%
31-07-
2018
-
12.88
% -0.96% 0.97%
87.12
%
99.04
%
100.9
7%
31-08-
2018 0.60% -1.38%
-
1.59%
100.60
%
98.62
%
98.41
%
30-09-
2018
-
8.20% 2.35%
-
6.52%
91.80
%
102.35
%
93.48
%
31-10-
2018
-
1.60% -3.56%
-
2.77%
98.40
%
96.44
%
97.23
%
30-11-
2018
-
3.38% 6.47%
-
0.69%
96.62
%
106.47
%
99.31
%
31-12-
2018 6.26% -1.75% 3.99%
106.26
%
98.25
%
103.9
9%
31-01-
2019 5.12%
14.21
% 5.31%
105.12
%
114.21
%
105.3
1%
28-02-
2019 3.25% -0.66% 0.14%
103.25
%
99.34
%
100.1
4%
31-03-
2019 6.22% 1.51% 2.50%
106.22
%
101.51
%
102.5
0%
30-04-
2019
-
1.00% 7.55% 1.98%
99.00
%
107.55
%
101.9
8%
0.0182
86
0.1454
43
0.0689
31
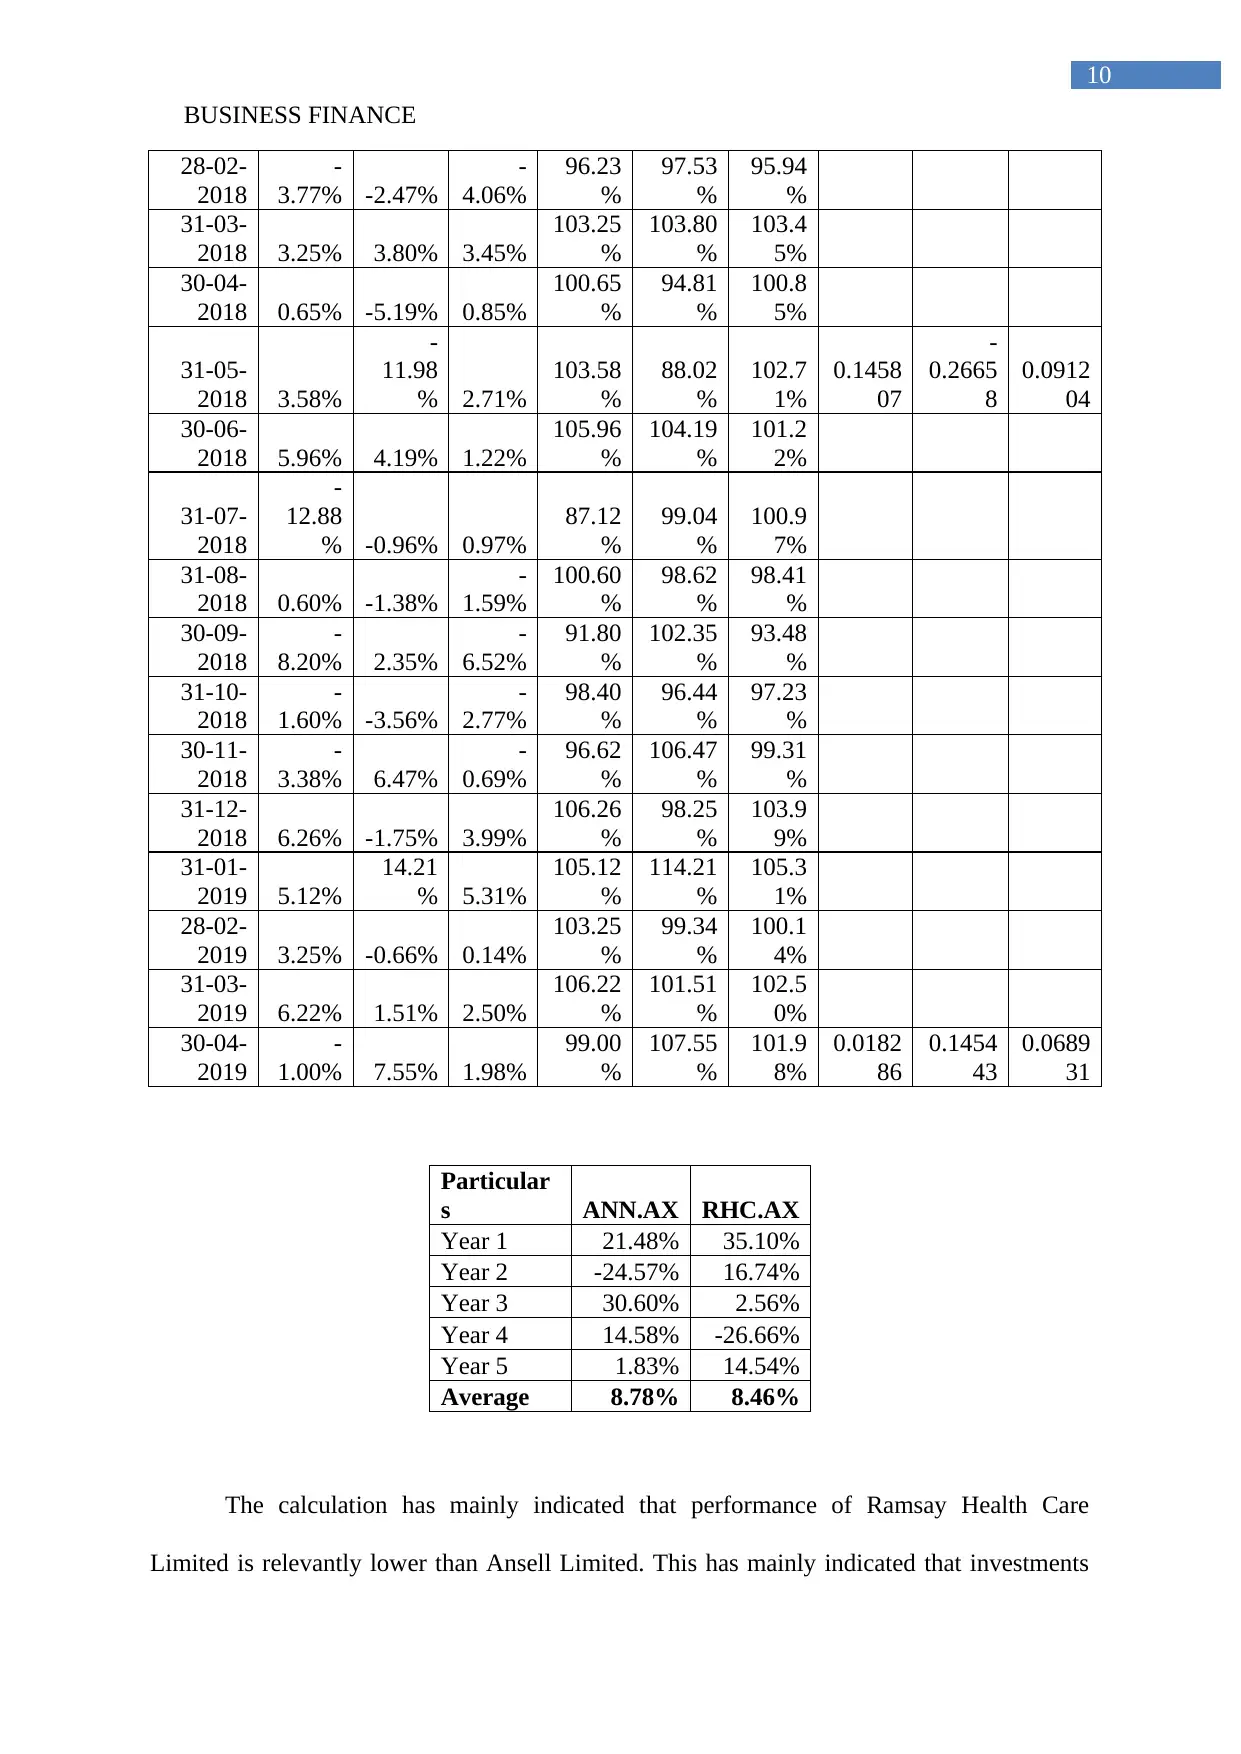
Particular
s ANN.AX RHC.AX
Year 1 21.48% 35.10%
Year 2 -24.57% 16.74%
Year 3 30.60% 2.56%
Year 4 14.58% -26.66%
Year 5 1.83% 14.54%
Average 8.78% 8.46%
The calculation has mainly indicated that performance of Ramsay Health Care
Limited is relevantly lower than Ansell Limited. This has mainly indicated that investments

BUSINESS FINANCE
11
in Ramsay Health Care Limited would provide low level of returns in comparison to Ansell
Limited (Au.finance.yahoo.com, 2019).
Conclusion:
From the relevant evaluation, it can be detected that investment sin Ramsay Health
Care Limited is relevantly adequate in comparison to Ansell Limited. In addition, this would
eventually help in improving the level of income for the investors and reducing the level of
risk involved in investments.
⊘ This is a preview!⊘
Do you want full access?
Subscribe today to unlock all pages.
Trusted by 1+ million students worldwide
1 out of 14
Your All-in-One AI-Powered Toolkit for Academic Success.
+13062052269
info@desklib.com
Available 24*7 on WhatsApp / Email
![[object Object]](/_next/static/media/star-bottom.7253800d.svg)
Unlock your academic potential
Copyright © 2020–2025 A2Z Services. All Rights Reserved. Developed and managed by ZUCOL.