Comprehensive Report: CVP Analysis and Financial Statements
VerifiedAdded on 2023/01/06
|12
|3430
|77
Report
AI Summary
This report provides a comprehensive analysis of financial statements, focusing on Cost-Volume-Profit (CVP) analysis and budgeting. The report begins with an analysis of financial statements, including the statement of profit and loss and the statement of financial position, using ratio analysis to assess liquidity, profitability, and efficiency. The report then delves into the differences between accrual and cash accounting, explaining the distinctions between profit and cash flow. Finally, the report defines budgeting, outlines its purposes, and discusses the benefits of forming a limited company and listing it on a stock exchange. The analysis includes key financial ratios, providing insights into the financial health of the company. The report recommends improvements in sales, debt management, and resource utilization. The document is contributed by a student and is available on Desklib.

CVP AND FINANCIAL STATEMENT
ANALYSIS
ANALYSIS
Paraphrase This Document
Need a fresh take? Get an instant paraphrase of this document with our AI Paraphraser
Table of Contents
TASK 1.................................................................................................................................................3
Statement of profit and loss.............................................................................................................3
Statement of financial position........................................................................................................4
TASK 2.................................................................................................................................................5
Accrual Accounting & Cash Accounting.........................................................................................5
Difference Between Profit & Cash Flow.........................................................................................6
Difference Between Profit & Cash Flow.........................................................................................7
TASK 3.................................................................................................................................................7
Define Budget and explain purposes of preparing a budget............................................................7
Benefit of forming limited company and getting it registered on stock exchange..........................8
REFERENCES...................................................................................................................................10
APPENDIX.........................................................................................................................................11
Ratio analysis calculation..............................................................................................................11
TASK 1
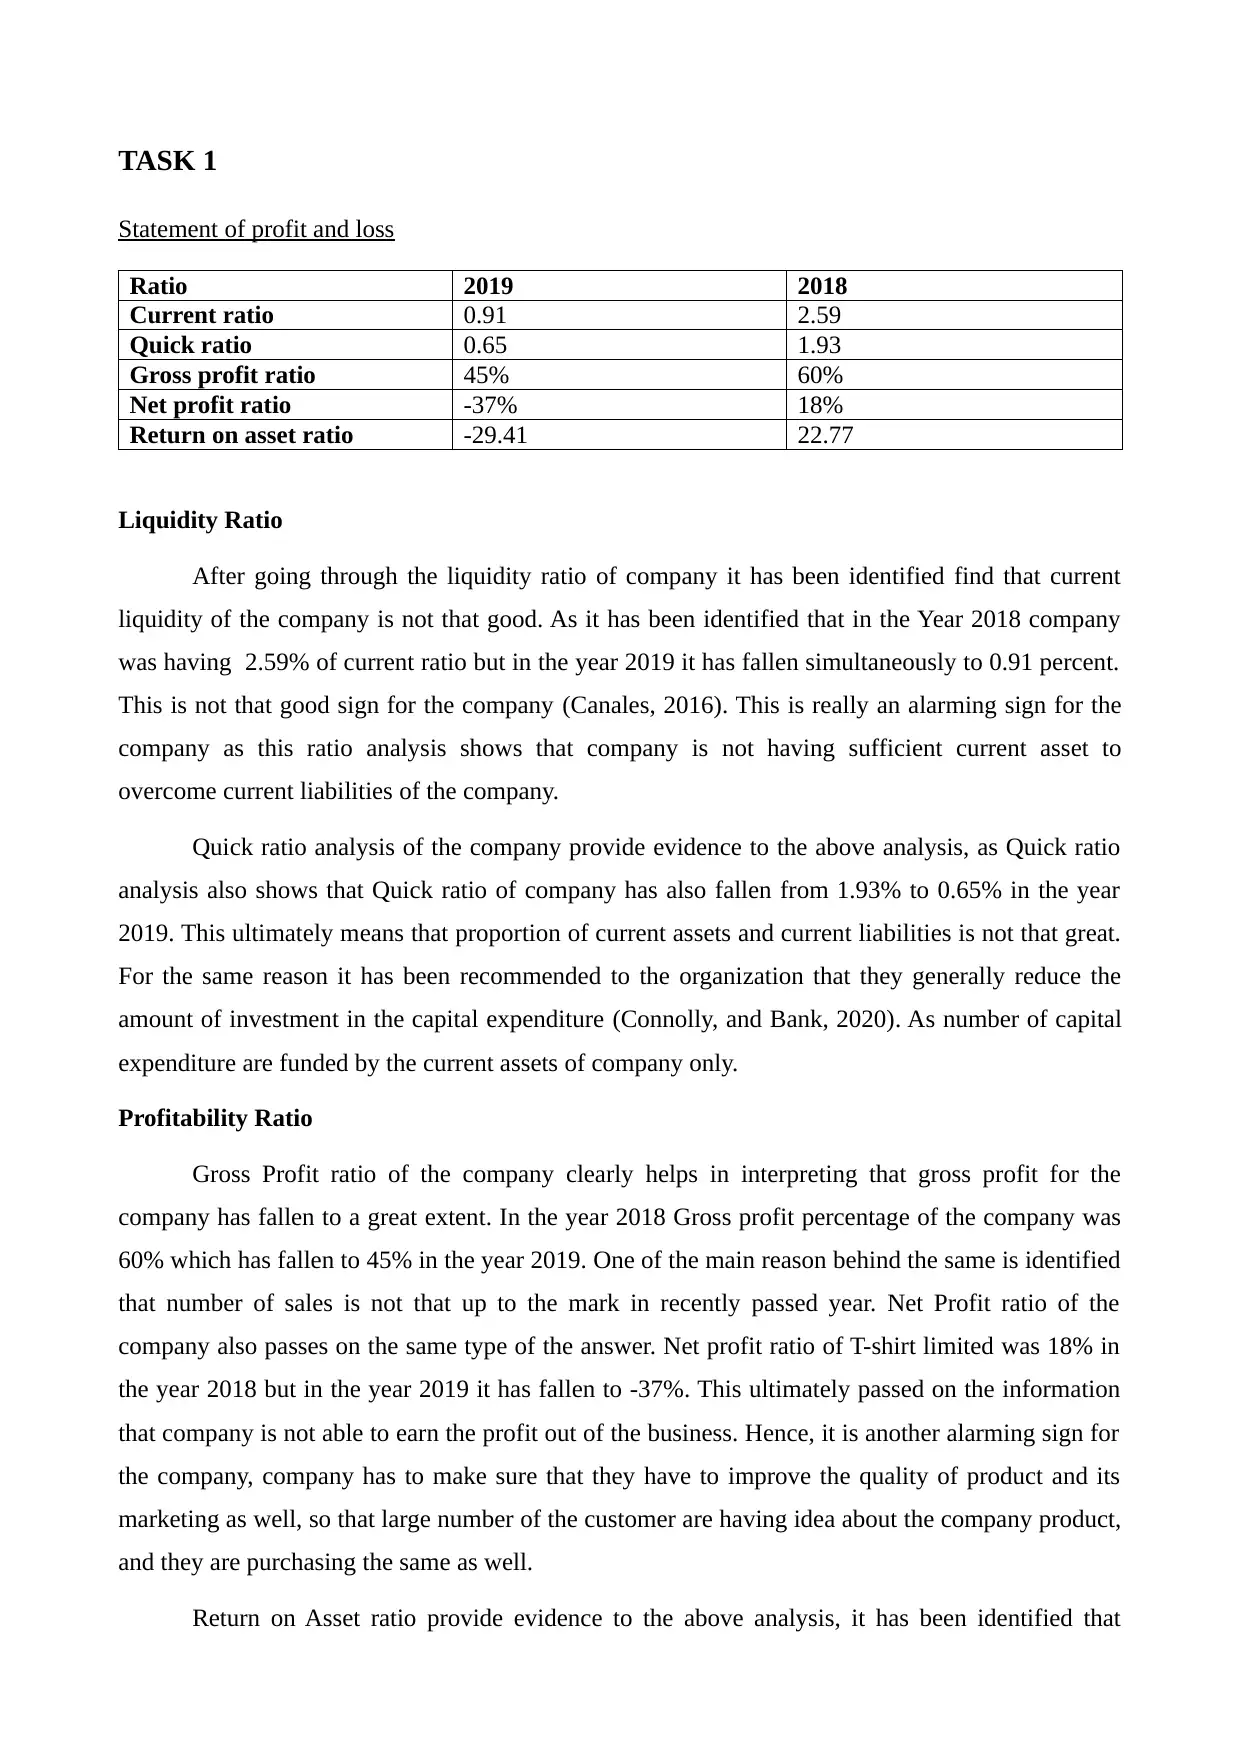
Statement of profit and loss
Ratio 2019 2018
Current ratio 0.91 2.59
Quick ratio 0.65 1.93
Gross profit ratio 45% 60%
Net profit ratio -37% 18%
Return on asset ratio -29.41 22.77
Liquidity Ratio
After going through the liquidity ratio of company it has been identified find that current
liquidity of the company is not that good. As it has been identified that in the Year 2018 company
was having 2.59% of current ratio but in the year 2019 it has fallen simultaneously to 0.91 percent.
This is not that good sign for the company (Canales, 2016). This is really an alarming sign for the
company as this ratio analysis shows that company is not having sufficient current asset to
overcome current liabilities of the company.
Quick ratio analysis of the company provide evidence to the above analysis, as Quick ratio
analysis also shows that Quick ratio of company has also fallen from 1.93% to 0.65% in the year
2019. This ultimately means that proportion of current assets and current liabilities is not that great.
For the same reason it has been recommended to the organization that they generally reduce the
amount of investment in the capital expenditure (Connolly, and Bank, 2020). As number of capital
expenditure are funded by the current assets of company only.
Profitability Ratio
Gross Profit ratio of the company clearly helps in interpreting that gross profit for the
company has fallen to a great extent. In the year 2018 Gross profit percentage of the company was
60% which has fallen to 45% in the year 2019. One of the main reason behind the same is identified
that number of sales is not that up to the mark in recently passed year. Net Profit ratio of the
company also passes on the same type of the answer. Net profit ratio of T-shirt limited was 18% in
the year 2018 but in the year 2019 it has fallen to -37%. This ultimately passed on the information
that company is not able to earn the profit out of the business. Hence, it is another alarming sign for
the company, company has to make sure that they have to improve the quality of product and its
marketing as well, so that large number of the customer are having idea about the company product,
and they are purchasing the same as well.
Return on Asset ratio provide evidence to the above analysis, it has been identified that
⊘ This is a preview!⊘
Do you want full access?
Subscribe today to unlock all pages.
Trusted by 1+ million students worldwide
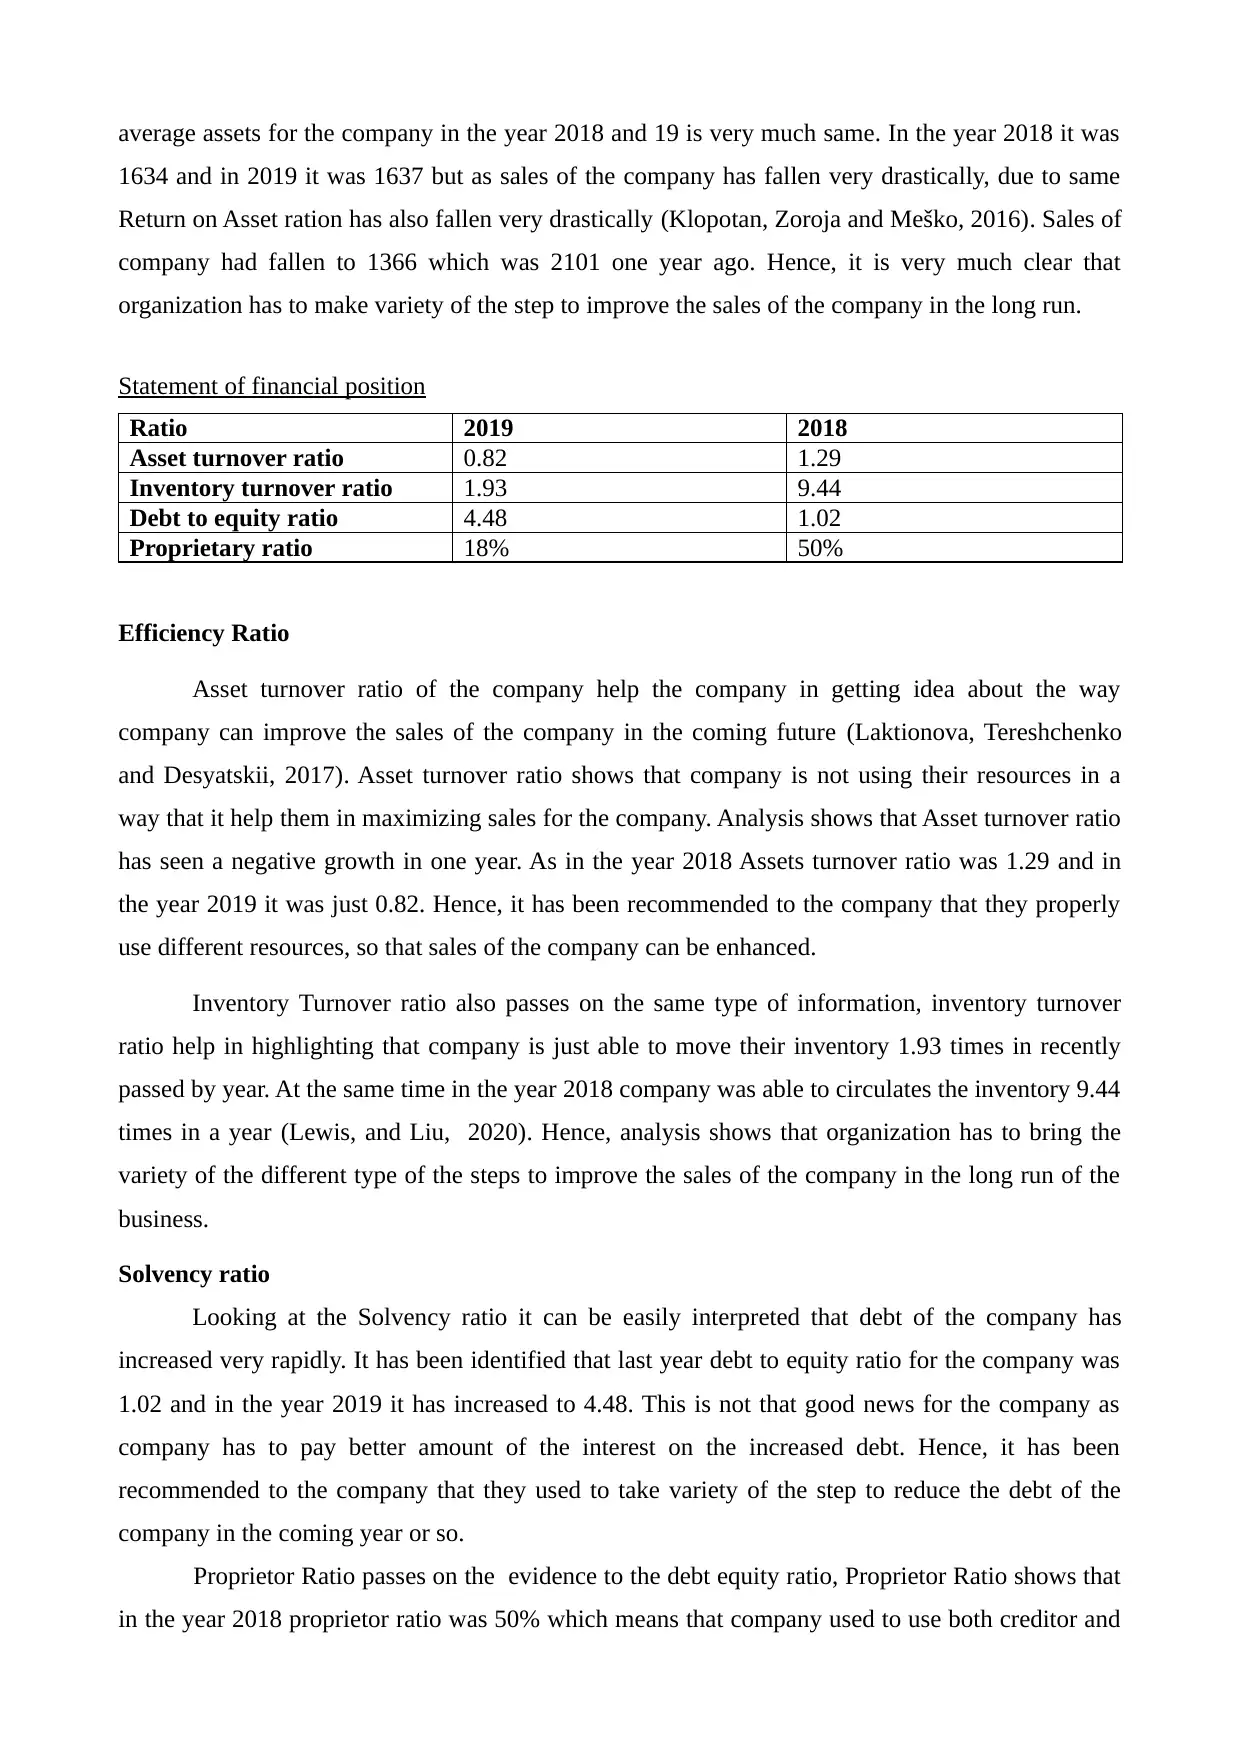
average assets for the company in the year 2018 and 19 is very much same. In the year 2018 it was
1634 and in 2019 it was 1637 but as sales of the company has fallen very drastically, due to same
Return on Asset ration has also fallen very drastically (Klopotan, Zoroja and Meško, 2016). Sales of
company had fallen to 1366 which was 2101 one year ago. Hence, it is very much clear that
organization has to make variety of the step to improve the sales of the company in the long run.
Statement of financial position
Ratio 2019 2018
Asset turnover ratio 0.82 1.29
Inventory turnover ratio 1.93 9.44
Debt to equity ratio 4.48 1.02
Proprietary ratio 18% 50%
Efficiency Ratio
Asset turnover ratio of the company help the company in getting idea about the way
company can improve the sales of the company in the coming future (Laktionova, Tereshchenko
and Desyatskii, 2017). Asset turnover ratio shows that company is not using their resources in a
way that it help them in maximizing sales for the company. Analysis shows that Asset turnover ratio
has seen a negative growth in one year. As in the year 2018 Assets turnover ratio was 1.29 and in
the year 2019 it was just 0.82. Hence, it has been recommended to the company that they properly
use different resources, so that sales of the company can be enhanced.
Inventory Turnover ratio also passes on the same type of information, inventory turnover
ratio help in highlighting that company is just able to move their inventory 1.93 times in recently
passed by year. At the same time in the year 2018 company was able to circulates the inventory 9.44
times in a year (Lewis, and Liu, 2020). Hence, analysis shows that organization has to bring the
variety of the different type of the steps to improve the sales of the company in the long run of the
business.
Solvency ratio
Looking at the Solvency ratio it can be easily interpreted that debt of the company has
increased very rapidly. It has been identified that last year debt to equity ratio for the company was
1.02 and in the year 2019 it has increased to 4.48. This is not that good news for the company as
company has to pay better amount of the interest on the increased debt. Hence, it has been
recommended to the company that they used to take variety of the step to reduce the debt of the
company in the coming year or so.
Proprietor Ratio passes on the evidence to the debt equity ratio, Proprietor Ratio shows that
in the year 2018 proprietor ratio was 50% which means that company used to use both creditor and
Paraphrase This Document
Need a fresh take? Get an instant paraphrase of this document with our AI Paraphraser
equity in their capital structure but in the year 2019 proprietorship ratio has fallen to 18% it clearly
means that amount of debt has generally increased in the capital structure of the company. Hence, it
has been recommended to the organization that they used to reduce the amount of debt in capital
structure of the company.
After understanding the all the different type of ratio it is concluded that overall
performance of T-Shirt is not that appreciable. Reason behind the same is falling sales of the
company and also increasing Debt of the company (Ylhäinen, 2017). As sales has fallen very
drastically and debt for the company has also increased. For the same reason it has been
recommended to the organization that they improve the quality of the product or consider variety of
different factor and invest good sort of the resources to improve the sales of the company in the
long run.
TASK 2
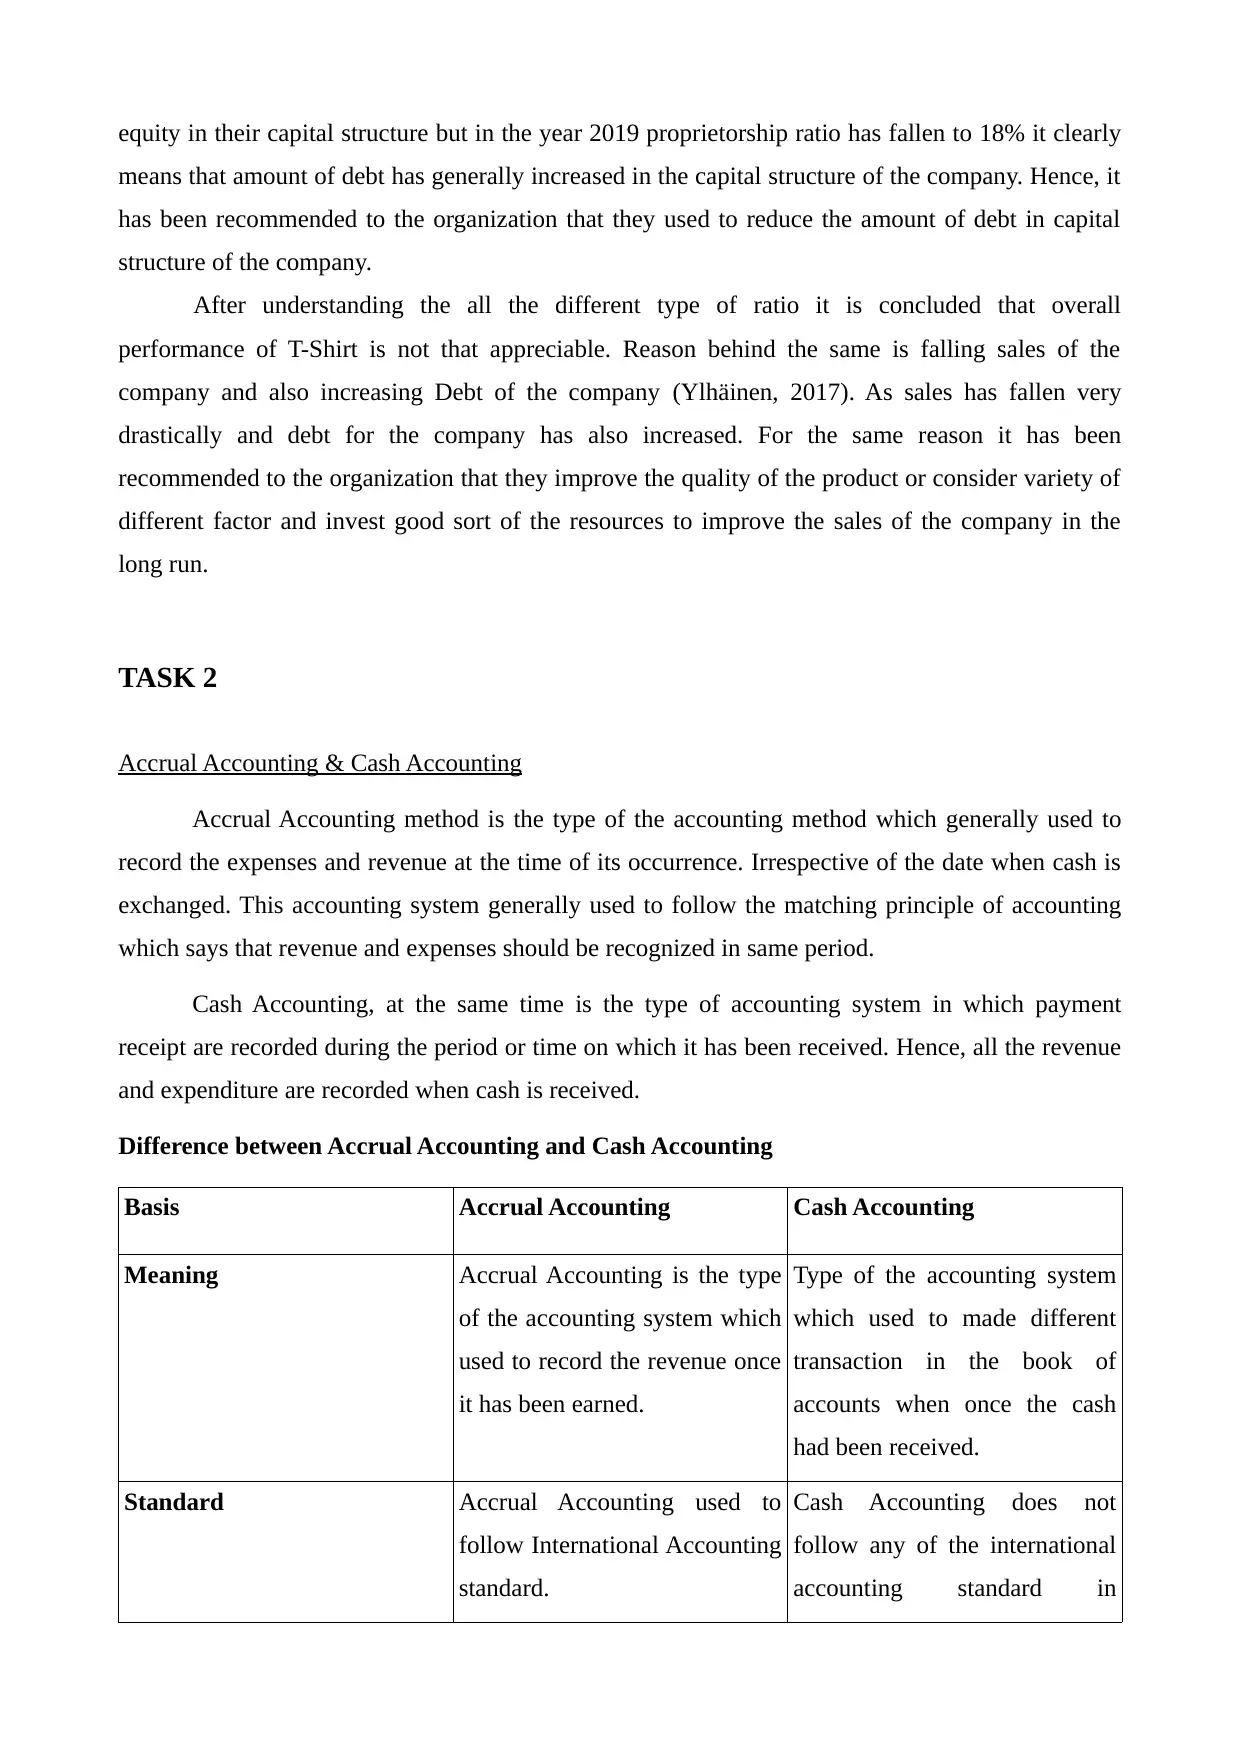
Accrual Accounting & Cash Accounting
Accrual Accounting method is the type of the accounting method which generally used to
record the expenses and revenue at the time of its occurrence. Irrespective of the date when cash is
exchanged. This accounting system generally used to follow the matching principle of accounting
which says that revenue and expenses should be recognized in same period.
Cash Accounting, at the same time is the type of accounting system in which payment
receipt are recorded during the period or time on which it has been received. Hence, all the revenue
and expenditure are recorded when cash is received.
Difference between Accrual Accounting and Cash Accounting
Basis Accrual Accounting Cash Accounting
Meaning Accrual Accounting is the type
of the accounting system which
used to record the revenue once
it has been earned.
Type of the accounting system
which used to made different
transaction in the book of
accounts when once the cash
had been received.
Standard Accrual Accounting used to
follow International Accounting
standard.
Cash Accounting does not
follow any of the international
accounting standard in
means that amount of debt has generally increased in the capital structure of the company. Hence, it
has been recommended to the organization that they used to reduce the amount of debt in capital
structure of the company.
After understanding the all the different type of ratio it is concluded that overall
performance of T-Shirt is not that appreciable. Reason behind the same is falling sales of the
company and also increasing Debt of the company (Ylhäinen, 2017). As sales has fallen very
drastically and debt for the company has also increased. For the same reason it has been
recommended to the organization that they improve the quality of the product or consider variety of
different factor and invest good sort of the resources to improve the sales of the company in the
long run.
TASK 2
Accrual Accounting & Cash Accounting
Accrual Accounting method is the type of the accounting method which generally used to
record the expenses and revenue at the time of its occurrence. Irrespective of the date when cash is
exchanged. This accounting system generally used to follow the matching principle of accounting
which says that revenue and expenses should be recognized in same period.
Cash Accounting, at the same time is the type of accounting system in which payment
receipt are recorded during the period or time on which it has been received. Hence, all the revenue
and expenditure are recorded when cash is received.
Difference between Accrual Accounting and Cash Accounting
Basis Accrual Accounting Cash Accounting
Meaning Accrual Accounting is the type
of the accounting system which
used to record the revenue once
it has been earned.
Type of the accounting system
which used to made different
transaction in the book of
accounts when once the cash
had been received.
Standard Accrual Accounting used to
follow International Accounting
standard.
Cash Accounting does not
follow any of the international
accounting standard in
accounting system.
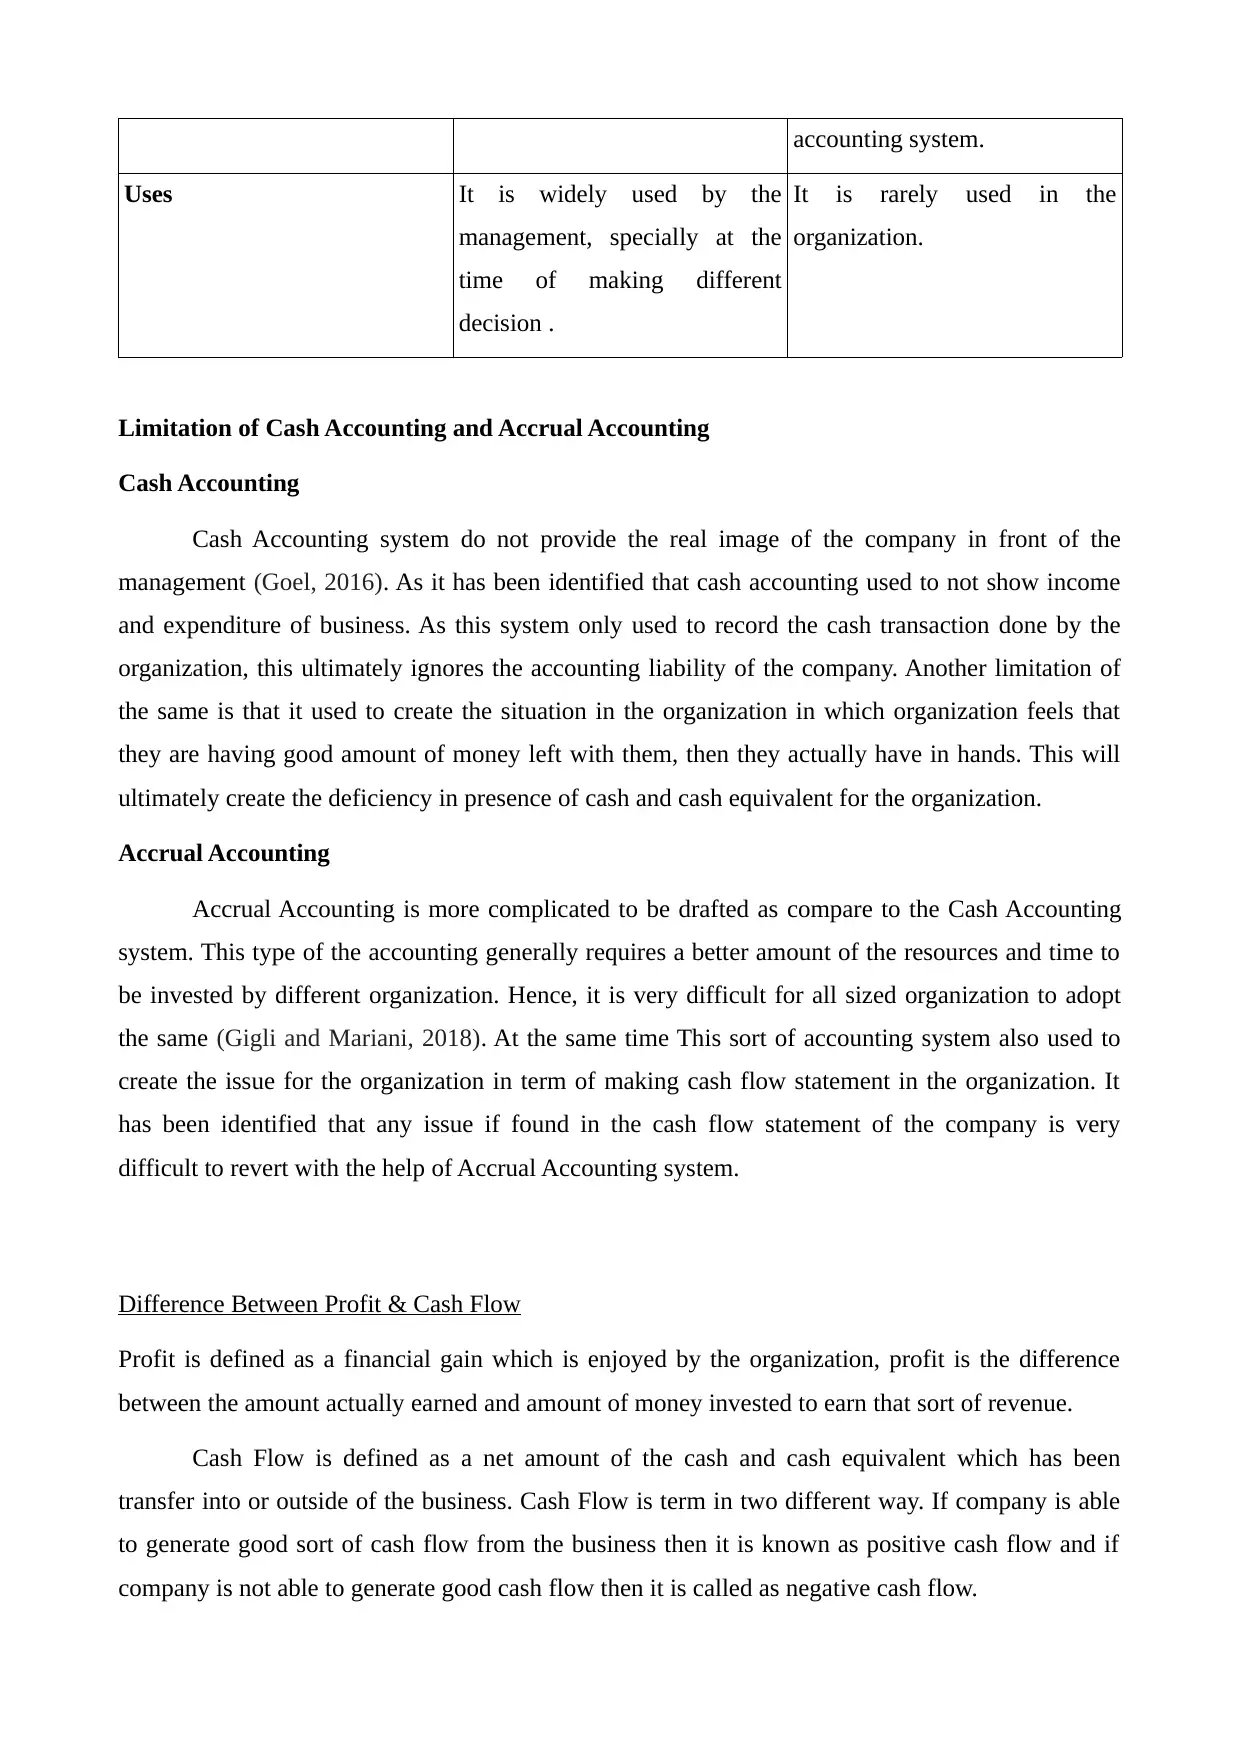
Uses It is widely used by the
management, specially at the
time of making different
decision .
It is rarely used in the
organization.
Limitation of Cash Accounting and Accrual Accounting
Cash Accounting
Cash Accounting system do not provide the real image of the company in front of the
management (Goel, 2016). As it has been identified that cash accounting used to not show income
and expenditure of business. As this system only used to record the cash transaction done by the
organization, this ultimately ignores the accounting liability of the company. Another limitation of
the same is that it used to create the situation in the organization in which organization feels that
they are having good amount of money left with them, then they actually have in hands. This will
ultimately create the deficiency in presence of cash and cash equivalent for the organization.
Accrual Accounting
Accrual Accounting is more complicated to be drafted as compare to the Cash Accounting
system. This type of the accounting generally requires a better amount of the resources and time to
be invested by different organization. Hence, it is very difficult for all sized organization to adopt
the same (Gigli and Mariani, 2018). At the same time This sort of accounting system also used to
create the issue for the organization in term of making cash flow statement in the organization. It
has been identified that any issue if found in the cash flow statement of the company is very
difficult to revert with the help of Accrual Accounting system.
Difference Between Profit & Cash Flow
Profit is defined as a financial gain which is enjoyed by the organization, profit is the difference
between the amount actually earned and amount of money invested to earn that sort of revenue.
Cash Flow is defined as a net amount of the cash and cash equivalent which has been
transfer into or outside of the business. Cash Flow is term in two different way. If company is able
to generate good sort of cash flow from the business then it is known as positive cash flow and if
company is not able to generate good cash flow then it is called as negative cash flow.
⊘ This is a preview!⊘
Do you want full access?
Subscribe today to unlock all pages.
Trusted by 1+ million students worldwide
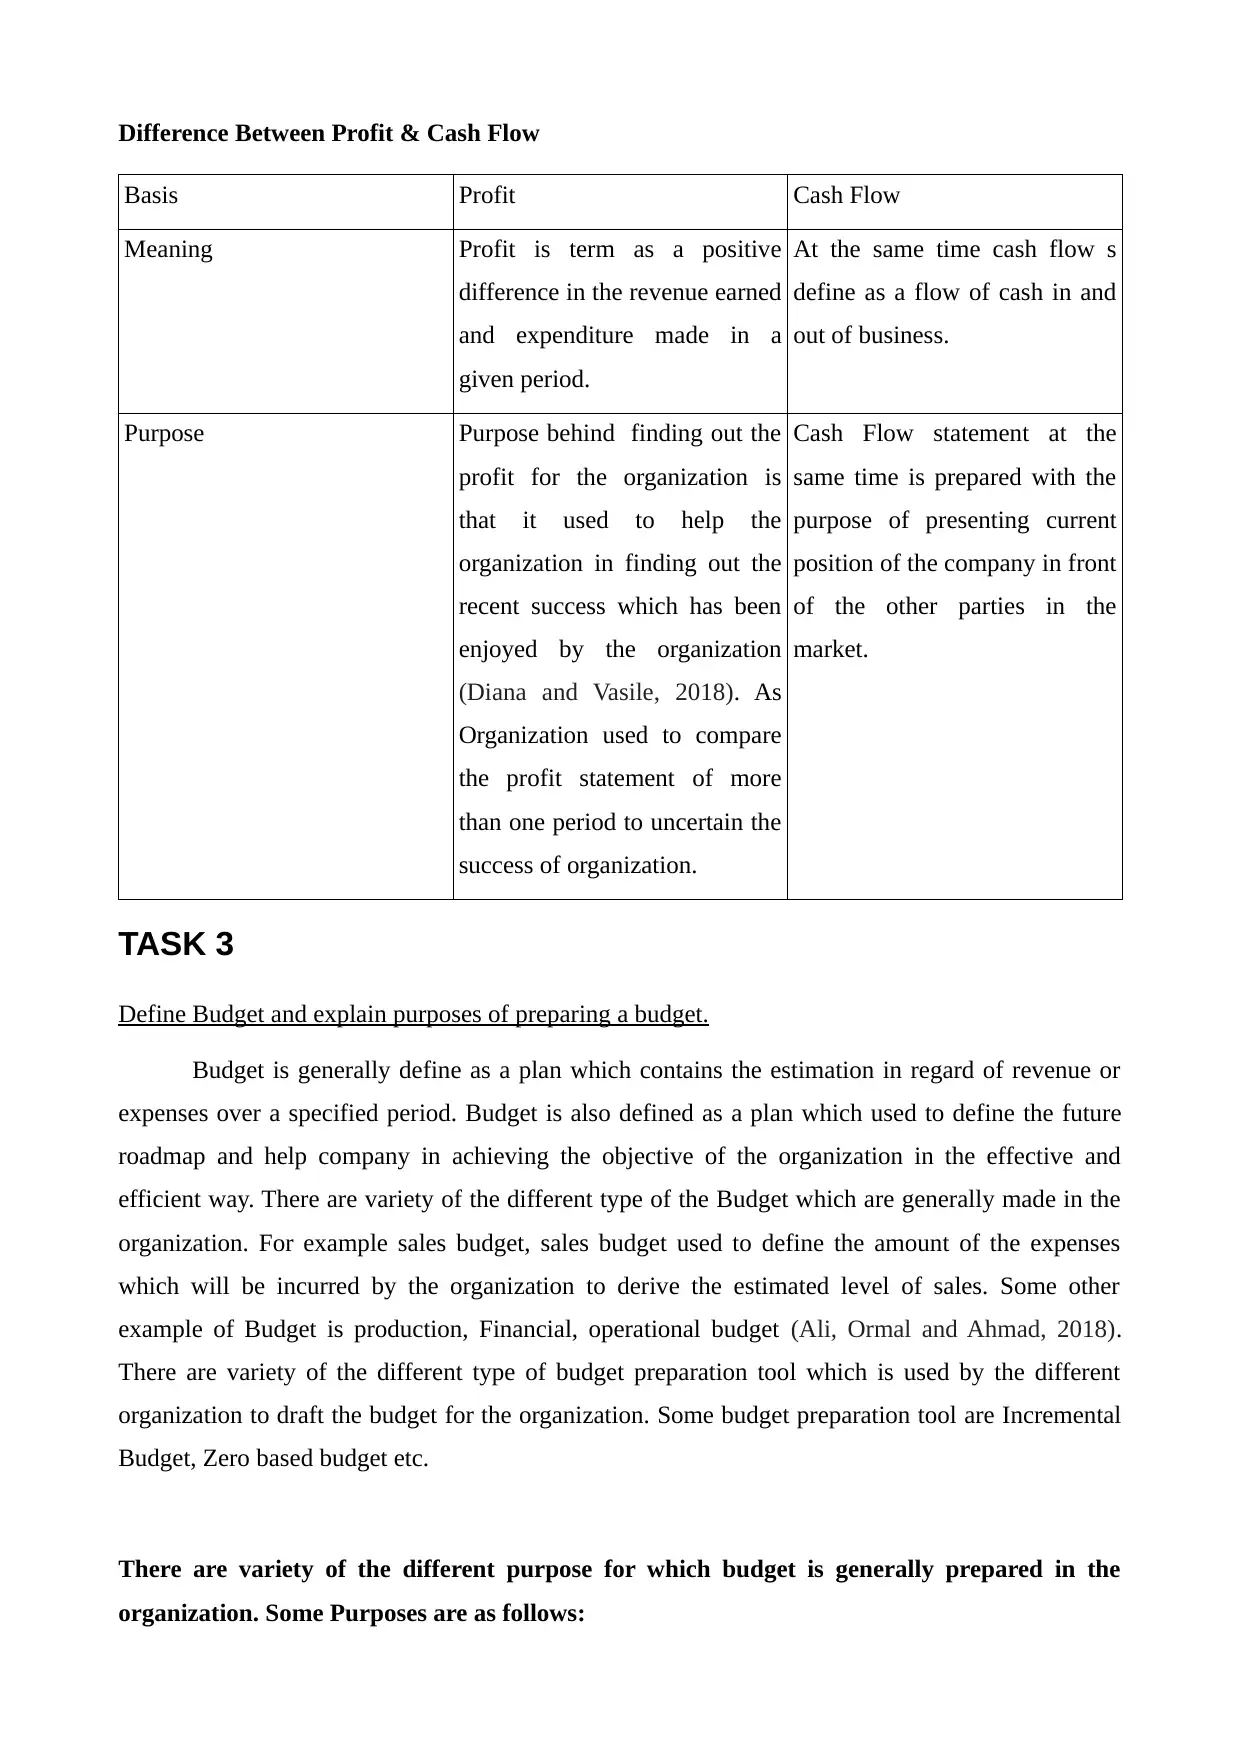
Difference Between Profit & Cash Flow
Basis Profit Cash Flow
Meaning Profit is term as a positive
difference in the revenue earned
and expenditure made in a
given period.
At the same time cash flow s
define as a flow of cash in and
out of business.
Purpose Purpose behind finding out the
profit for the organization is
that it used to help the
organization in finding out the
recent success which has been
enjoyed by the organization
(Diana and Vasile, 2018). As
Organization used to compare
the profit statement of more
than one period to uncertain the
success of organization.
Cash Flow statement at the
same time is prepared with the
purpose of presenting current
position of the company in front
of the other parties in the
market.
TASK 3
Define Budget and explain purposes of preparing a budget.
Budget is generally define as a plan which contains the estimation in regard of revenue or
expenses over a specified period. Budget is also defined as a plan which used to define the future
roadmap and help company in achieving the objective of the organization in the effective and
efficient way. There are variety of the different type of the Budget which are generally made in the
organization. For example sales budget, sales budget used to define the amount of the expenses
which will be incurred by the organization to derive the estimated level of sales. Some other
example of Budget is production, Financial, operational budget (Ali, Ormal and Ahmad, 2018).
There are variety of the different type of budget preparation tool which is used by the different
organization to draft the budget for the organization. Some budget preparation tool are Incremental
Budget, Zero based budget etc.
There are variety of the different purpose for which budget is generally prepared in the
organization. Some Purposes are as follows:
Paraphrase This Document
Need a fresh take? Get an instant paraphrase of this document with our AI Paraphraser
Clarity: Management in the organization always looks at managing good sort of clarity in
the organization, for the same reason they used to prepare different budget and pass on the same in
different department. This help the management in maintaining good sort of communication in the
organization and also help the employee in understanding resources which in their hand.
Decision making: It is another important purpose for which budget is generally prepared in
the organization. Management with the help of the budget generally looks to improve the quality of
decision-making in the organization.
Financial Goal Setting: It is another important purpose for which budget is generally
formed in the organization. Management of the organization generally looks at setting the Financial
goal of the business on the basis of the budget which had been drafted for coming financial year.
Benefit of forming limited company and getting it registered on stock exchange
A Limited company is a general form of incorporation that used to limit the amount of the
liability which has been born by the different stakeholder of the company (Rafi, M and et.al.,
2020). It is the type of legal structure of the company which ensure that companies member and
subscriber are limited to a certain amount of the investment or commitment in the organization. A
company can limited by two different method first method is limited by the shares and another
method is limited by guarantee. Stock exchange listing is another aspect of stock exchange, Listing
refers to process of the company through which they used to offer the shares of the company on the
trading platform of different stock exchange company. There are variety of the different type of
benefit which is seen by the organization by listing companies security on different stock exchange
platform. Some benefit which is seen by the organization are as follows:
Fund Raising: It is one of the benefit which is seen by the organization by listing security of
the company over a stock exchange platform. It has been analysed that with the help of listing the
company over the stock market company is able to raise good sort of fund from the market. There
are variety of the different way through which organization can raise fund but benefit which is seen
by organization from this source of fund is that there is no sort of the interest which has to be paid
by the organization over these source of the fund in general.
Ready Marketable securities: It is another sort of the benefit which is seen by the
organization. Listing security to stock market help the company in enhancing the Liquidity of the
company as it stock exchange used to bring ready marketability of securities on the continues basis
which used to add prestige and importance to listed companies.
Timely Disclosure of corporate information: It is another type of the benefit which is seen
by the organization due to incorporating themselves over stock exchange board. Listing agreement

which has been signed with the exchange board help the company in timely understanding the
amount of the dividend, bonuses and right issues. Hence, it can be said that Stock exchange
generally used to provide good sort of transparency and builds investors confidence.
Ability to raise further capital: Stock exchange not only help company in building current
capital structure of the company, it also used to help the company in raising further capital for the
company as well. This capital is generally used by the management in planning variety of different
activity in a way that they find it very easy to overcome variety of the future uncertainity.
⊘ This is a preview!⊘
Do you want full access?
Subscribe today to unlock all pages.
Trusted by 1+ million students worldwide
REFERENCES
Books and Journals
Canales, R., 2016. From ideals to institutions: Institutional entrepreneurship and the growth of
Mexican small business finance. Organization Science. 27(6). pp.1548-1573.
Connolly, E. and Bank, J., 2020. Access to small business finance. RBA Bulletin, September,
viewed. 10.
Klopotan, I., Zoroja, J. and Meško, M., 2018. Early warning system in business, finance, and
economics: Bibliometric and topic analysis. International Journal of Engineering Business
Management. 10. p.1847979018797013.
Laktionova, O.E., Tereshchenko, E.Y. and Desyatskii, S.P., 2017. Transformation of the
organization and management of small and medium-sized business' finance. Finansovaya
analitika: problemy i resheniya= Financial Analytics: Science and Experience. 10(7). pp.767-
789.
Lewis, M. and Liu, Q., 2020. The COVID-19 Outbreak and Access to Small Business Finance. 1. 1
Managing the Risks of Holding Self-securitisations as Collateral 2. 11 Government Bond
Market Functioning and COVID-19 3. The Economic Effects of Low Interest Rates and
Unconventional 21 Monetary Policy 4. Retail Central Bank Digital Currency: Design
Considerations, Rationales, p.58.
Ylhäinen, I., 2017. Life-cycle effects in small business finance. Journal of Banking & Finance. 77.
pp.176-196.
Goel, D., 2016. The earnings management motivation: Accrual accounting vs. cash
accounting. Australasian Accounting, Business and Finance Journal. 10(3). pp.48-66.
Gigli, S. and Mariani, L., 2018. Lost in the transition from cash to accrual accounting. International
Journal of Public Sector Management.
Diana, H. I. and Vasile, B., 2018. INTERFERENCE BETWEEN PROFIT AND CASH-FLOW IN
EVALUATING ECONOMIC PERFORMANCE. Annals of'Constantin
Brancusi'University of Targu-Jiu. Economy Series, (3).
Ali, U., Ormal, L. and Ahmad, F., 2018. Impact of free cash flow on profitability of the firms in
automobile sector of Germany. Journal of Economics and Management Sciences. 1(1).
pp.57-67.
Rafi, M and et.al., 2020. Budget harmonization and challenges: understanding the competence of
professionals in the budget process for structural and policy reforms in public
libraries. Performance Measurement and Metrics.
Online
Advantages and disadvantages of private limited company. 2020. [Online]. Available through: <
https://taxguru.in/company-law/advantages-disadvantages-private-limited-
company.html#:~:text=It%20can%20be%20registered%20with,family%20owned%20or
%20professionally%20managed. >
Paraphrase This Document
Need a fresh take? Get an instant paraphrase of this document with our AI Paraphraser
APPENDIX
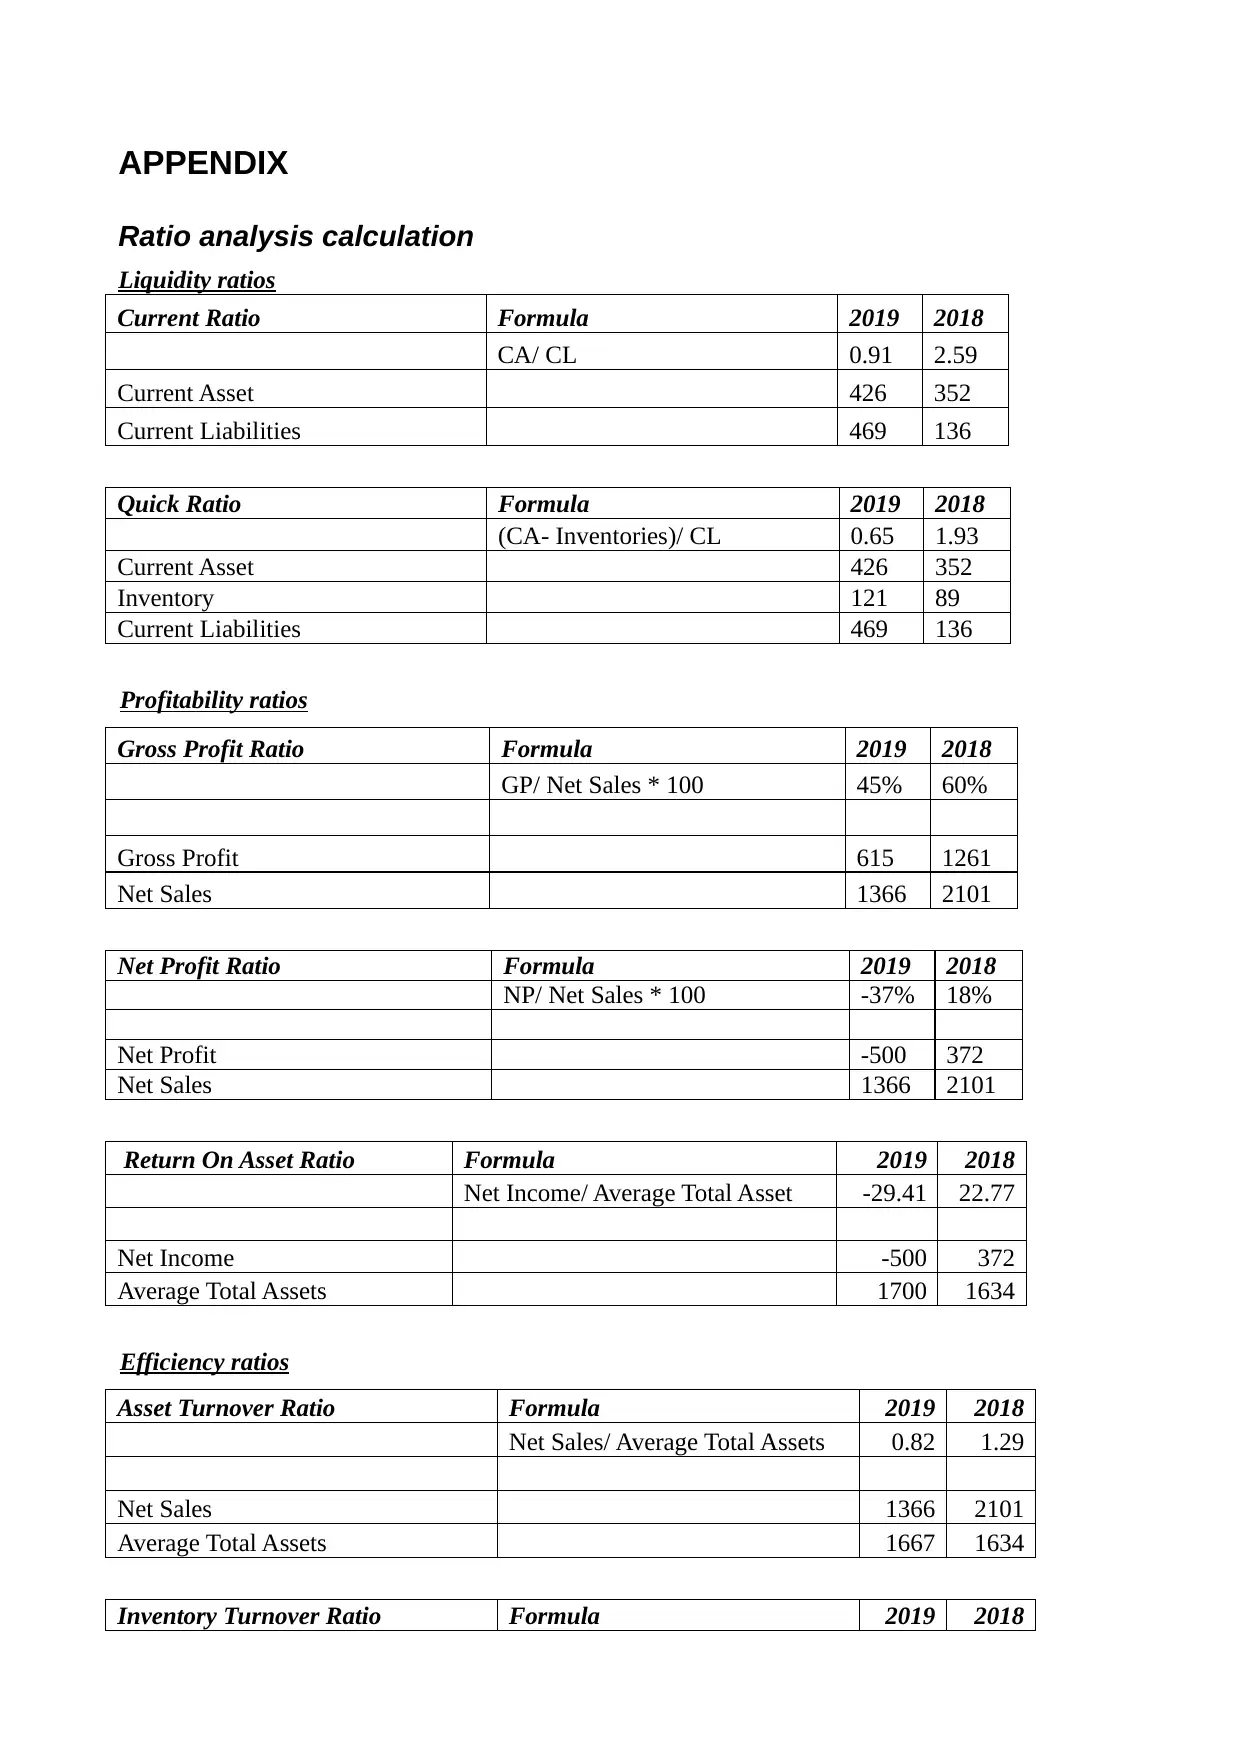
Ratio analysis calculation
Liquidity ratios
Current Ratio Formula 2019 2018
CA/ CL 0.91 2.59
Current Asset 426 352
Current Liabilities 469 136
Quick Ratio Formula 2019 2018
(CA- Inventories)/ CL 0.65 1.93
Current Asset 426 352
Inventory 121 89
Current Liabilities 469 136
Profitability ratios
Gross Profit Ratio Formula 2019 2018
GP/ Net Sales * 100 45% 60%
Gross Profit 615 1261
Net Sales 1366 2101
Net Profit Ratio Formula 2019 2018
NP/ Net Sales * 100 -37% 18%
Net Profit -500 372
Net Sales 1366 2101
Return On Asset Ratio Formula 2019 2018
Net Income/ Average Total Asset -29.41 22.77
Net Income -500 372
Average Total Assets 1700 1634
Efficiency ratios
Asset Turnover Ratio Formula 2019 2018
Net Sales/ Average Total Assets 0.82 1.29
Net Sales 1366 2101
Average Total Assets 1667 1634
Inventory Turnover Ratio Formula 2019 2018
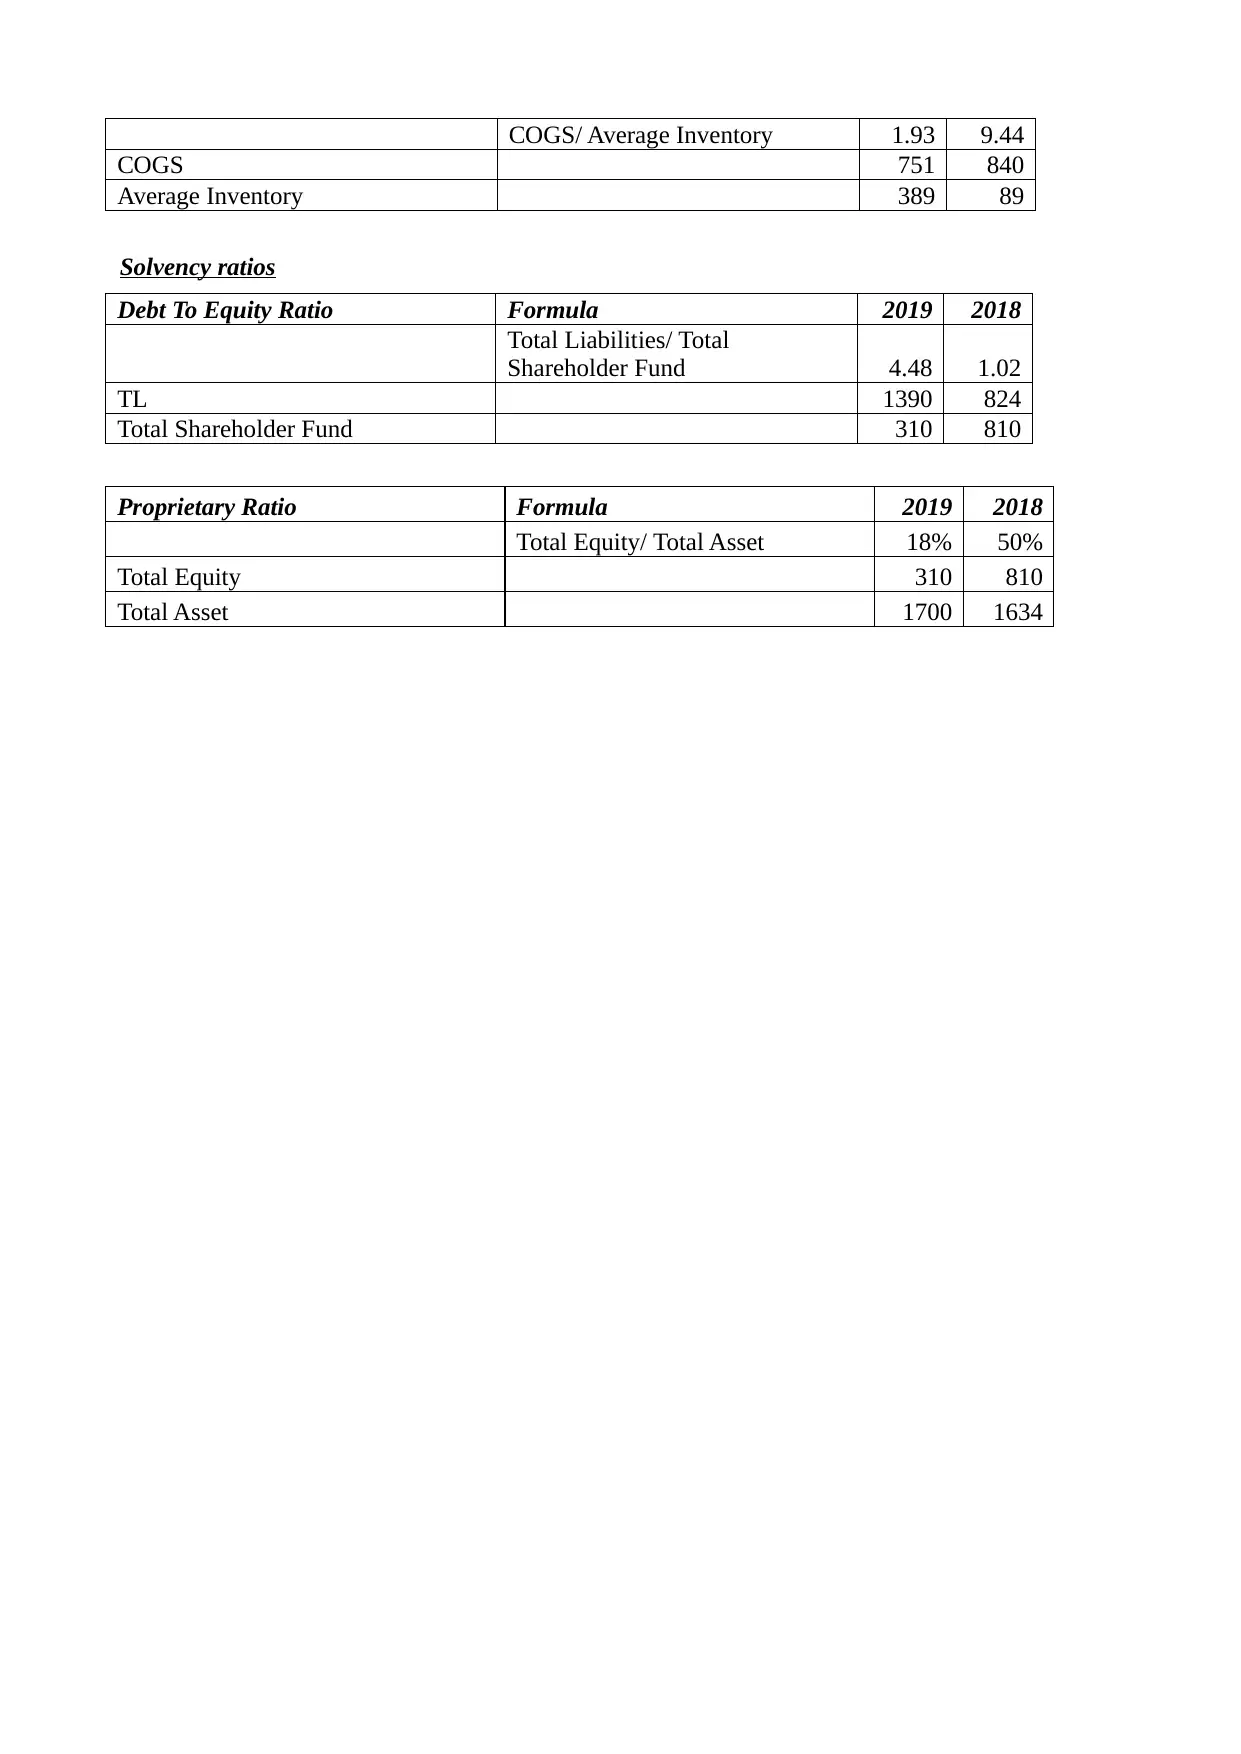
COGS/ Average Inventory 1.93 9.44
COGS 751 840
Average Inventory 389 89
Solvency ratios
Debt To Equity Ratio Formula 2019 2018
Total Liabilities/ Total
Shareholder Fund 4.48 1.02
TL 1390 824
Total Shareholder Fund 310 810
Proprietary Ratio Formula 2019 2018
Total Equity/ Total Asset 18% 50%
Total Equity 310 810
Total Asset 1700 1634
⊘ This is a preview!⊘
Do you want full access?
Subscribe today to unlock all pages.
Trusted by 1+ million students worldwide
1 out of 12
Related Documents


Your All-in-One AI-Powered Toolkit for Academic Success.
+13062052269
info@desklib.com
Available 24*7 on WhatsApp / Email
![[object Object]](/_next/static/media/star-bottom.7253800d.svg)
Unlock your academic potential
Copyright © 2020–2025 A2Z Services. All Rights Reserved. Developed and managed by ZUCOL.