Business Finance Assignment | Capital Asset Pricing Model (CAPM)
Added on 2020-04-07
12 Pages2309 Words226 Views
Business Finance[Type the abstract of the document here. The abstract is typically a short summary of the contentsof the document. Type the abstract of the document here. The abstract is typically a short summary of the contents of the document.]

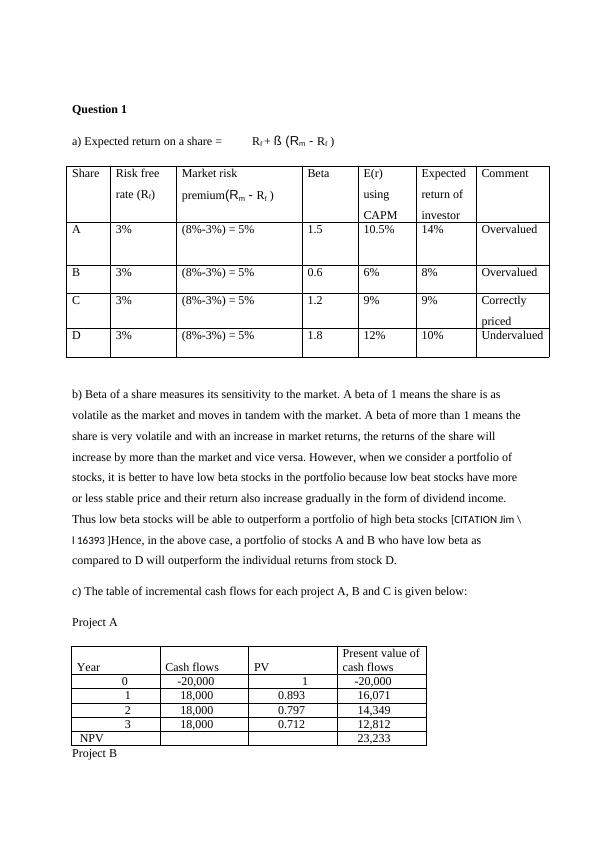
Question 1a) Expected return on a share = Rf + ß (Rm - Rf )ShareRisk free rate (Rf)Market risk premium(Rm - Rf )BetaE(r) using CAPMExpected return of investorCommentA3%(8%-3%) = 5%1.510.5%14%OvervaluedB3%(8%-3%) = 5%0.66%8%OvervaluedC3%(8%-3%) = 5%1.29%9%Correctly pricedD3%(8%-3%) = 5%1.812%10%Undervaluedb) Beta of a share measures its sensitivity to the market. A beta of 1 means the share is as volatile as the market and moves in tandem with the market. A beta of more than 1 means theshare is very volatile and with an increase in market returns, the returns of the share will increase by more than the market and vice versa. However, when we consider a portfolio of stocks, it is better to have low beta stocks in the portfolio because low beat stocks have more or less stable price and their return also increase gradually in the form of dividend income. Thus low beta stocks will be able to outperform a portfolio of high beta stocks [CITATION Jim \l 16393 ]Hence, in the above case, a portfolio of stocks A and B who have low beta as compared to D will outperform the individual returns from stock D.c) The table of incremental cash flows for each project A, B and C is given below:Project AYearCash flowsPVPresent value ofcash flows 0 -20,000 1 -20,000 1 18,000 0.893 16,071 2 18,000 0.797 14,349 3 18,000 0.712 12,812 NPV 23,233 Project B
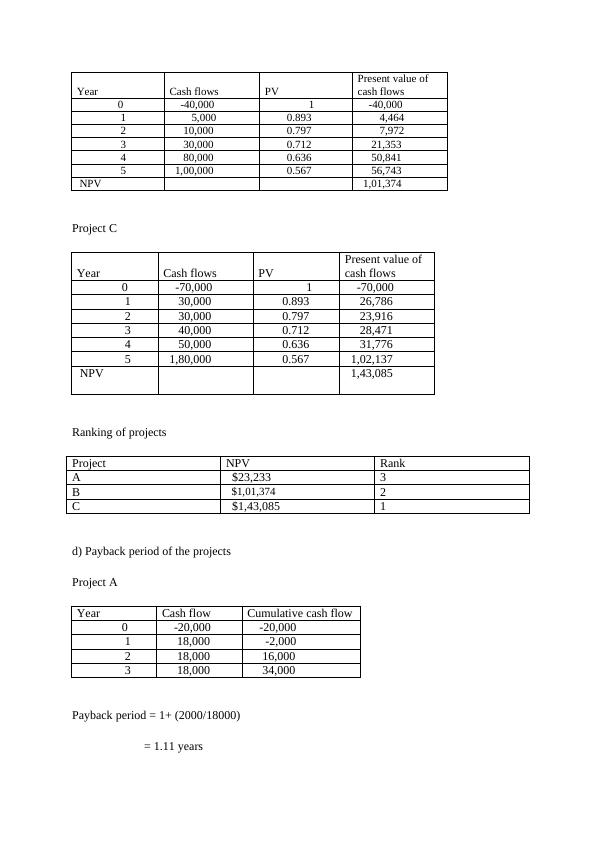
YearCash flowsPVPresent value of cash flows 0 -40,000 1 -40,000 1 5,000 0.893 4,464 2 10,000 0.797 7,972 3 30,000 0.712 21,353 4 80,000 0.636 50,841 5 1,00,000 0.567 56,743 NPV 1,01,374 Project CYearCash flowsPVPresent value of cash flows 0 -70,000 1 -70,000 1 30,000 0.893 26,786 2 30,000 0.797 23,916 3 40,000 0.712 28,471 4 50,000 0.636 31,776 5 1,80,000 0.567 1,02,137 NPV 1,43,085 Ranking of projectsProjectNPVRankA $23,2333B $1,01,3742C $1,43,0851d) Payback period of the projectsProject AYearCash flowCumulative cash flow 0 -20,000 -20,000 1 18,000 -2,000 2 18,000 16,000 3 18,000 34,000 Payback period = 1+ (2000/18000)= 1.11 years
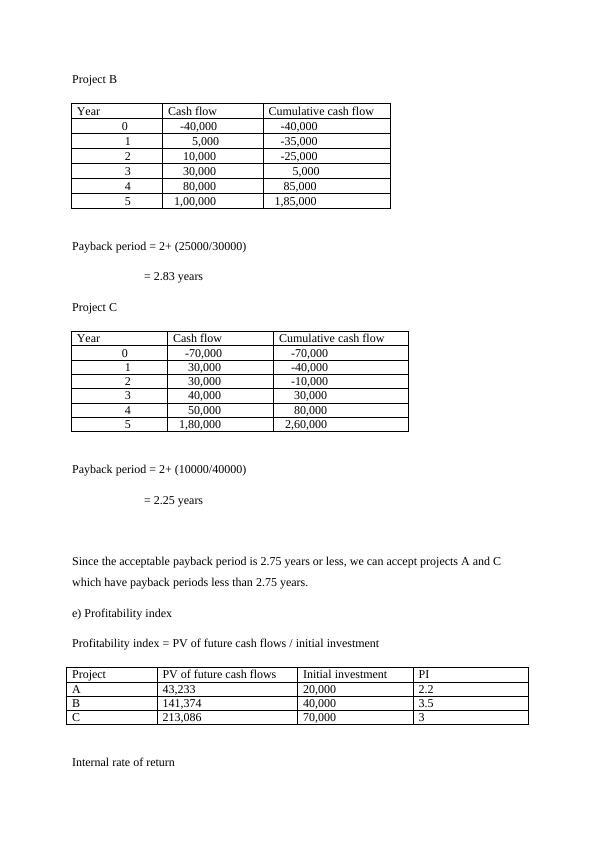
Project BYearCash flowCumulative cash flow 0 -40,000 -40,000 1 5,000 -35,000 2 10,000 -25,000 3 30,000 5,000 4 80,000 85,000 5 1,00,000 1,85,000 Payback period = 2+ (25000/30000)= 2.83 yearsProject CYearCash flowCumulative cash flow 0 -70,000 -70,000 1 30,000 -40,000 2 30,000 -10,000 3 40,000 30,000 4 50,000 80,000 5 1,80,000 2,60,000 Payback period = 2+ (10000/40000)= 2.25 yearsSince the acceptable payback period is 2.75 years or less, we can accept projects A and C which have payback periods less than 2.75 years.e) Profitability indexProfitability index = PV of future cash flows / initial investmentProjectPV of future cash flowsInitial investmentPIA43,23320,0002.2B141,37440,0003.5C213,08670,0003Internal rate of return
End of preview
Want to access all the pages? Upload your documents or become a member.
Related Documents
The Business Finance Assignmentlg...
|11
|2054
|51
Investment Appraisal Techniques: Payback Period and NPVlg...
|7
|1262
|85
Business Decision Making: Payback Period and NPV Analysislg...
|7
|1409
|63
Business Decision Makinglg...
|8
|1754
|24
Calculation of NPV and Payback Periodlg...
|7
|1350
|42
Capital Budgeting | Assignment-1lg...
|9
|1291
|22