Business Finance Assignment: Comprehensive Financial Analysis Report
VerifiedAdded on 2020/05/16
|15
|3168
|171
Homework Assignment
AI Summary
This business finance assignment solution encompasses a wide range of financial concepts and calculations. It begins with loan amortization schedules, exploring monthly payments, interest calculations, and the impact of refinancing. The analysis then extends to bond valuation, market rate of return, and rate of return calculations. The assignment also includes risk classification (systematic and unsystematic), investment appraisal techniques (payback period, NPV, and IRR), and project ranking based on these metrics. Furthermore, it covers the interpretation of financial ratios, capital structure analysis, and portfolio management including CAPM. Finally, the document provides detailed calculations and recommendations based on the financial data provided, offering a comprehensive overview of the financial concepts and their practical applications.

Running head: BUSINESS FINANCE
Business Finance
Name of the Student:
Name of the University:
Authors Note:
Business Finance
Name of the Student:
Name of the University:
Authors Note:
Paraphrase This Document
Need a fresh take? Get an instant paraphrase of this document with our AI Paraphraser
BUSINESS FINANCE
1
Table of Contents
1.1 Depicting the monthly payment:..........................................................................................3
1.2 Depicting how much is the first payment interest:...............................................................3
1.3 Depicting how much is the first payment is principal:........................................................3
1.4 Depicting how much money is owed by corporation after making monthly payments:.....3
1.5 Depicting should the loan be refinanced after three years:..................................................4
1.6 Depicting how much is the loan payment if these payments are scheduled for quarterly
rather than monthly payments:...................................................................................................4
1.7 Depicting how much will Casino.com Corporation owe on this loan after making
quarterly payments for three years:............................................................................................5
1.8 Depicting the annual percentage rate on the original ten-year 8 % loan:............................5
1.9 Depicting the effective annual rate (EAR) on the original ten-year 8 % loan:.....................5
2.a Depicting the market rate of return for the bond:.................................................................5
2.b Depicting the market rate of return for the bond if you hold for 1 year and submit it:.......6
2.c Depicting the return for the year:.........................................................................................6
3. Depicting the rate of return will be earned on that investment:.............................................7
4. Classifying each event as a source of systematic and unsystematic risk:..............................7
5.a Calculating payback period of the investment:....................................................................8
5.b Calculating NPV of the proposed investment:.....................................................................8
5.c Calculating IRR of the proposed investment:......................................................................8
5.d Recommending relevant implementation of the proposed project:.....................................9
6.a Ranking investment based on NPVs:...................................................................................9
6.b Ranking investment based on IRR:......................................................................................9
6.c Depicting why the result yield mixed result:......................................................................10
7 Calculating NPV for each project:........................................................................................10
BUSINESS FINANCE
2
8.a Calculating payback period for the investment:.................................................................11
8.b Depicting whether the company will accept the project of payback period is 3 years and 4
years:........................................................................................................................................11
8.c Selecting which investment is selected if shortest payback period is identified:...............12
8.d Depicting which projects will be accepted:.......................................................................12
8.e Depicting the investment which will be selected if company uses payback period:.........12
8.f Depicting the project will be accepted:...............................................................................12
9. Explaining the information the following ratios provides about a firm:..............................12
10.a Calculating required rate of return for each of the above stocks:....................................14
10.b Calculating the required rate of return for the above portfolio:.......................................14
10.c Calculating beta of the portfolio and weighted average beta and the CAPM formula:. . .15
10.d Calculating the required rate of return for the new portfolio using the above method:...15
10.e Describing the above change in investor’s portfolio reflects about the new risk attitude:
..................................................................................................................................................15
Reference and Bibliography:....................................................................................................17
⊘ This is a preview!⊘
Do you want full access?
Subscribe today to unlock all pages.
Trusted by 1+ million students worldwide
BUSINESS FINANCE
3
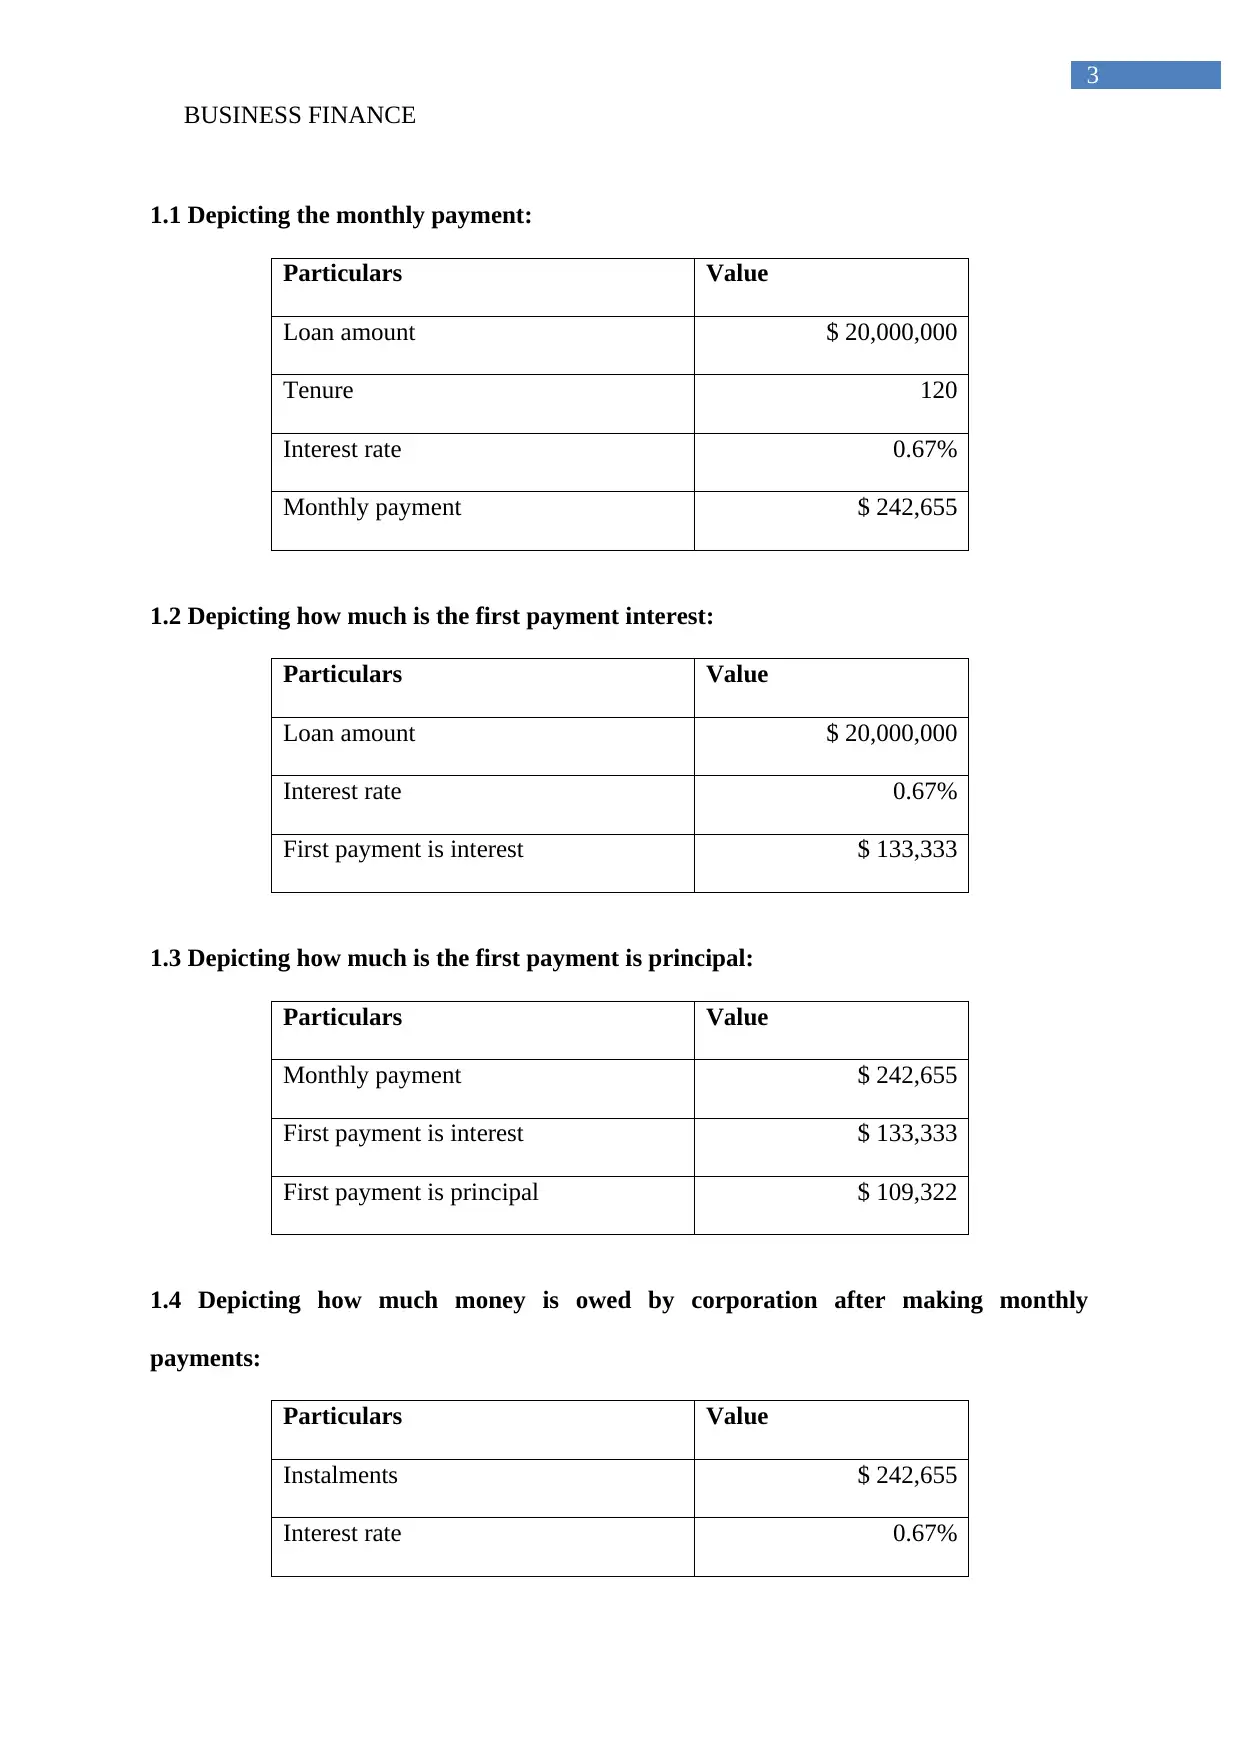
1.1 Depicting the monthly payment:
Particulars Value
Loan amount $ 20,000,000
Tenure 120
Interest rate 0.67%
Monthly payment $ 242,655
1.2 Depicting how much is the first payment interest:
Particulars Value
Loan amount $ 20,000,000
Interest rate 0.67%
First payment is interest $ 133,333
1.3 Depicting how much is the first payment is principal:
Particulars Value
Monthly payment $ 242,655
First payment is interest $ 133,333
First payment is principal $ 109,322
1.4 Depicting how much money is owed by corporation after making monthly
payments:
Particulars Value
Instalments $ 242,655
Interest rate 0.67%
3
1.1 Depicting the monthly payment:
Particulars Value
Loan amount $ 20,000,000
Tenure 120
Interest rate 0.67%
Monthly payment $ 242,655
1.2 Depicting how much is the first payment interest:
Particulars Value
Loan amount $ 20,000,000
Interest rate 0.67%
First payment is interest $ 133,333
1.3 Depicting how much is the first payment is principal:
Particulars Value
Monthly payment $ 242,655
First payment is interest $ 133,333
First payment is principal $ 109,322
1.4 Depicting how much money is owed by corporation after making monthly
payments:
Particulars Value
Instalments $ 242,655
Interest rate 0.67%
Paraphrase This Document
Need a fresh take? Get an instant paraphrase of this document with our AI Paraphraser
BUSINESS FINANCE
4
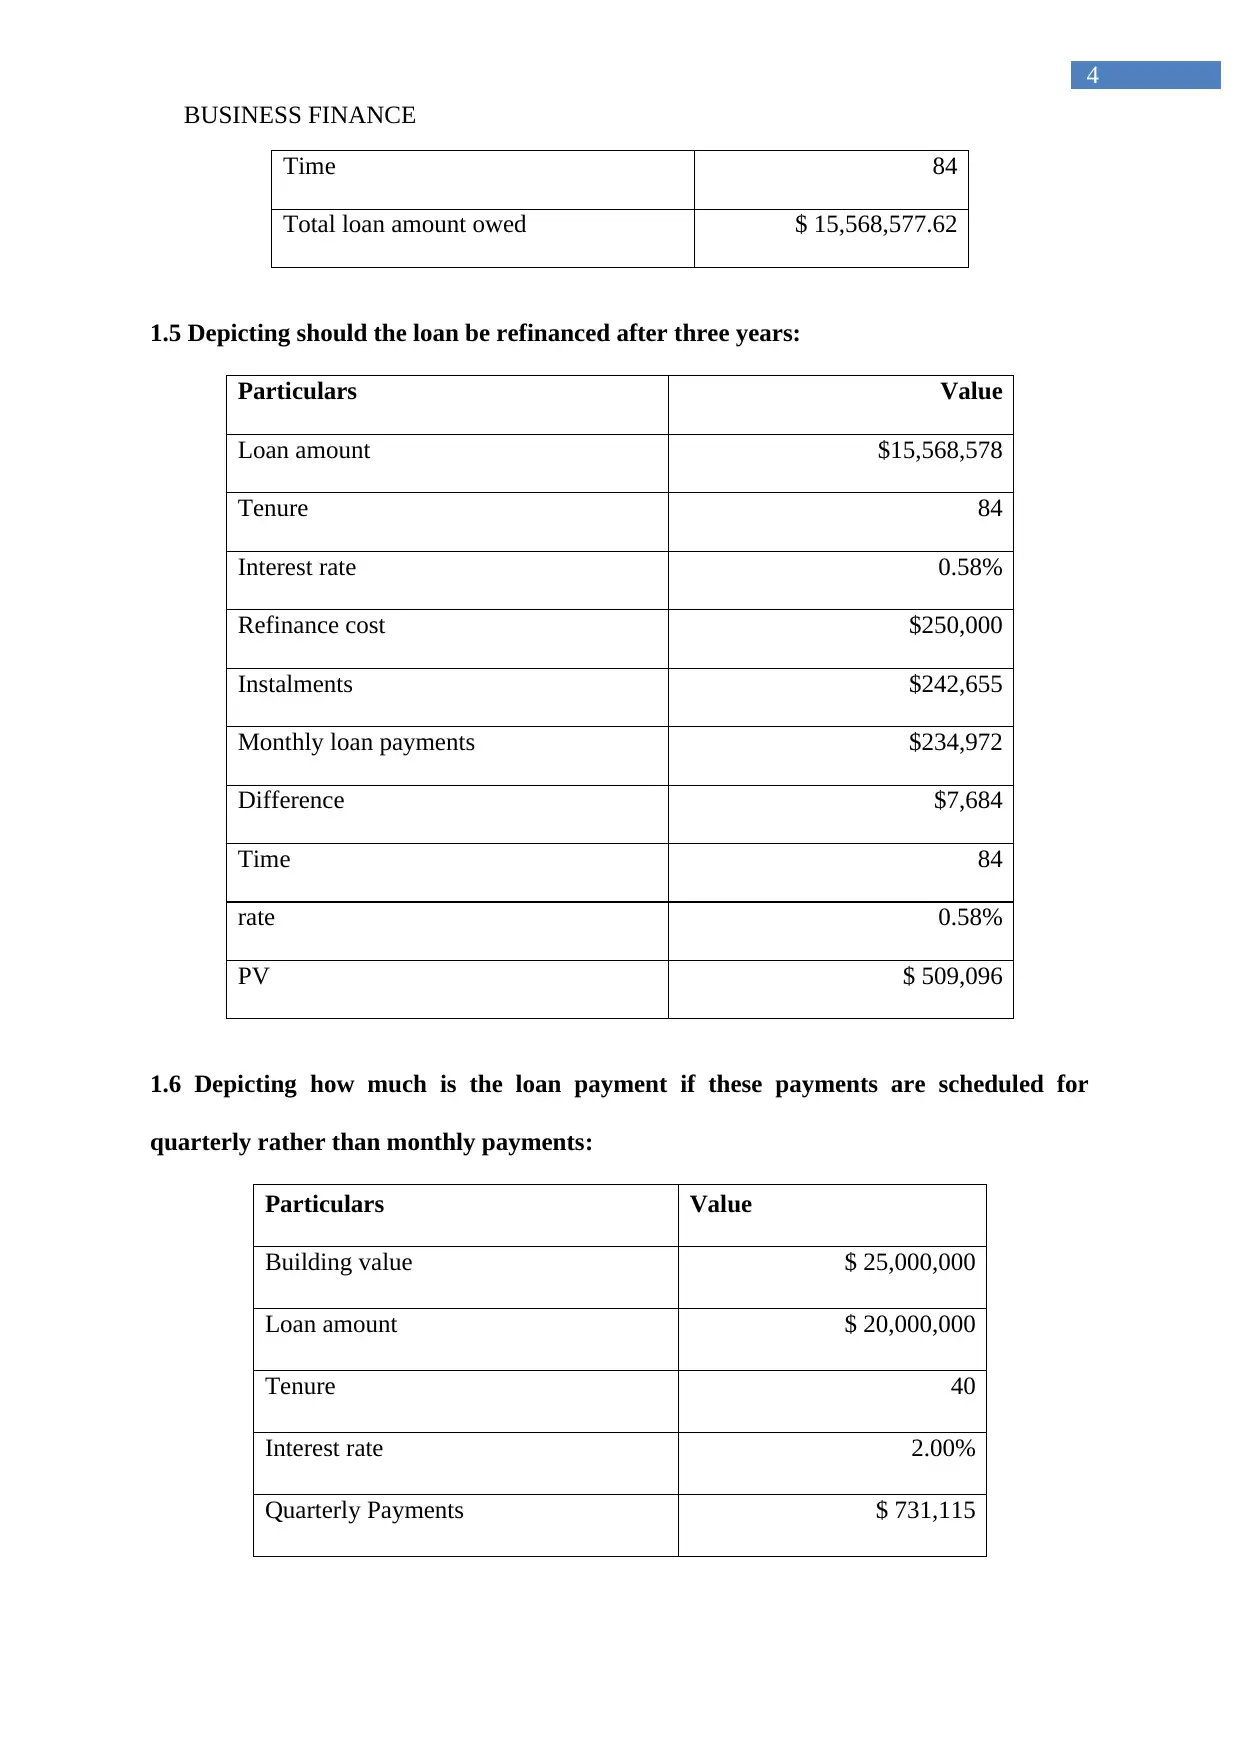
Time 84
Total loan amount owed $ 15,568,577.62
1.5 Depicting should the loan be refinanced after three years:
Particulars Value
Loan amount $15,568,578
Tenure 84
Interest rate 0.58%
Refinance cost $250,000
Instalments $242,655
Monthly loan payments $234,972
Difference $7,684
Time 84
rate 0.58%
PV $ 509,096
1.6 Depicting how much is the loan payment if these payments are scheduled for
quarterly rather than monthly payments:
Particulars Value
Building value $ 25,000,000
Loan amount $ 20,000,000
Tenure 40
Interest rate 2.00%
Quarterly Payments $ 731,115
4
Time 84
Total loan amount owed $ 15,568,577.62
1.5 Depicting should the loan be refinanced after three years:
Particulars Value
Loan amount $15,568,578
Tenure 84
Interest rate 0.58%
Refinance cost $250,000
Instalments $242,655
Monthly loan payments $234,972
Difference $7,684
Time 84
rate 0.58%
PV $ 509,096
1.6 Depicting how much is the loan payment if these payments are scheduled for
quarterly rather than monthly payments:
Particulars Value
Building value $ 25,000,000
Loan amount $ 20,000,000
Tenure 40
Interest rate 2.00%
Quarterly Payments $ 731,115
BUSINESS FINANCE
5
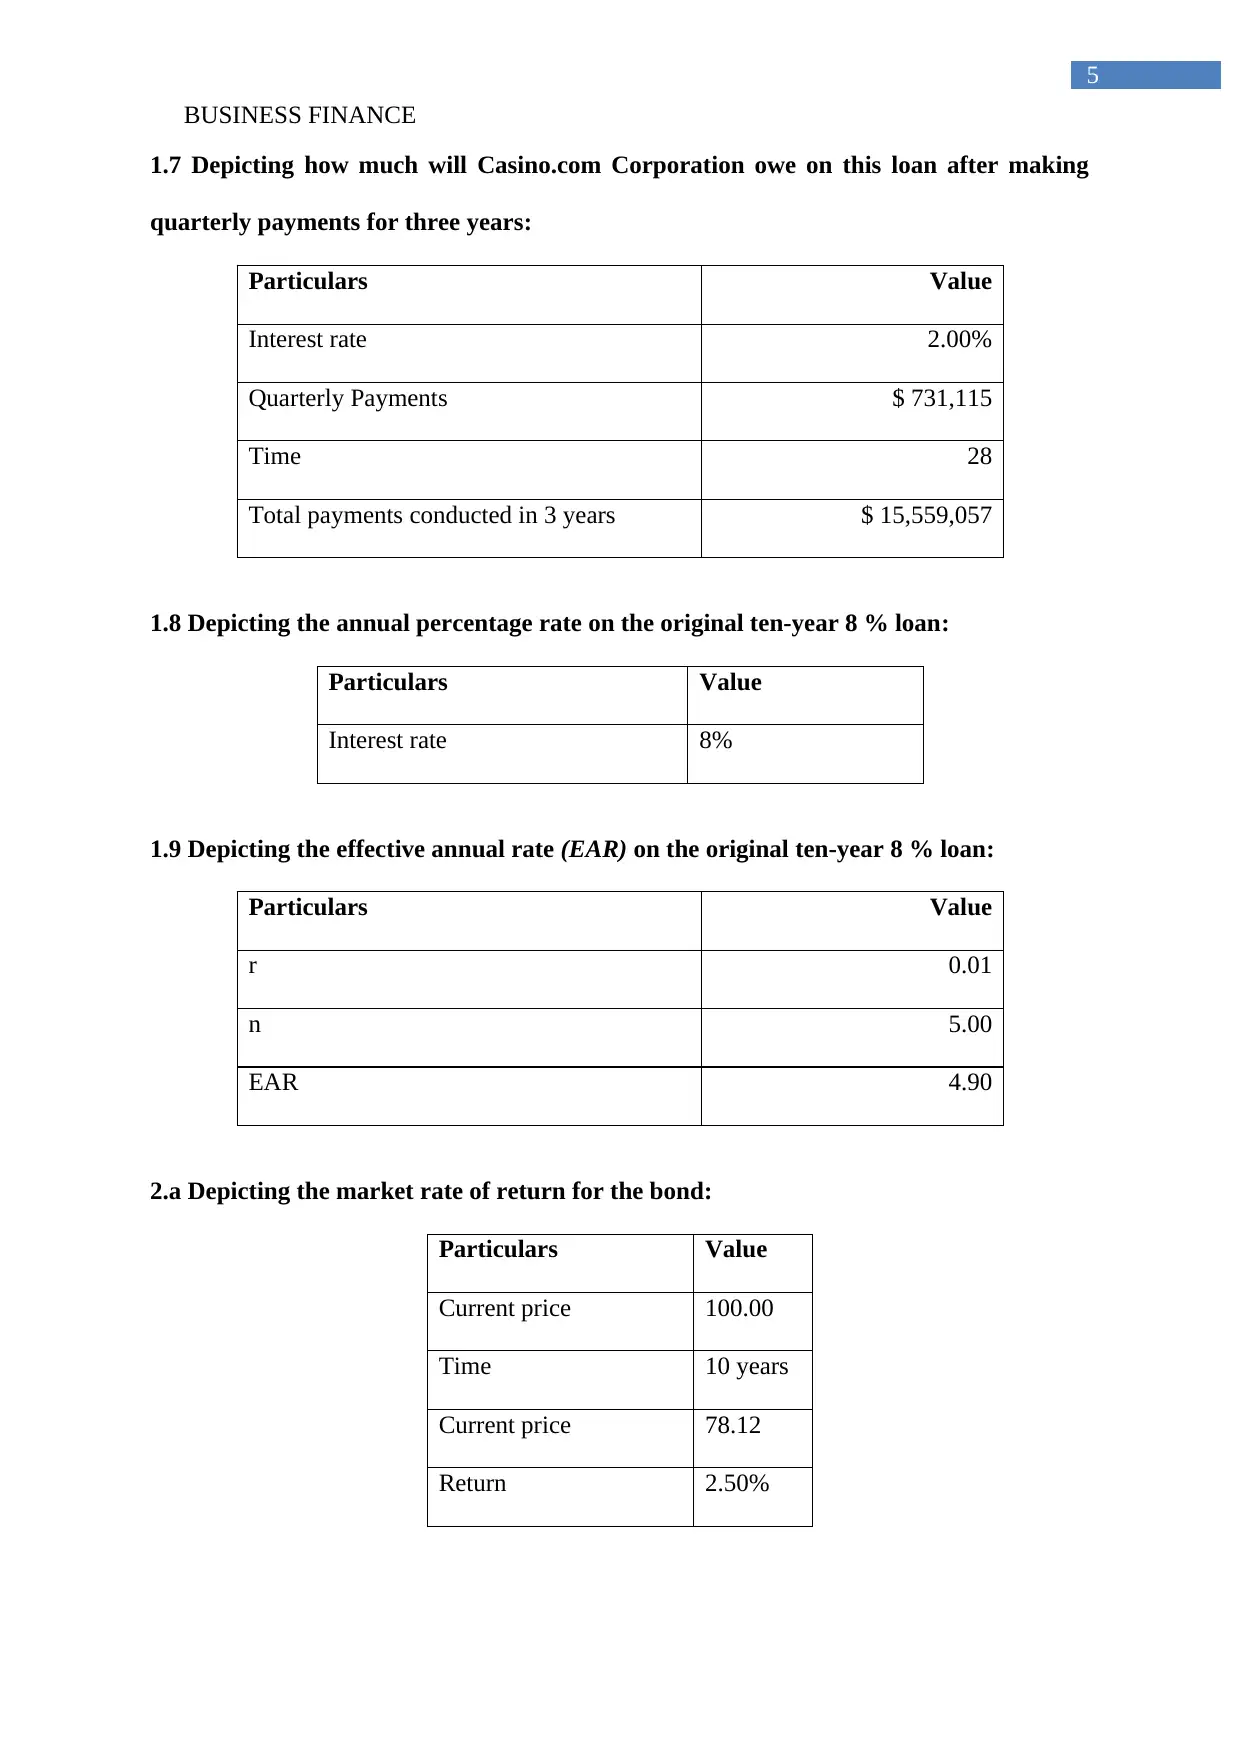
1.7 Depicting how much will Casino.com Corporation owe on this loan after making
quarterly payments for three years:
Particulars Value
Interest rate 2.00%
Quarterly Payments $ 731,115
Time 28
Total payments conducted in 3 years $ 15,559,057
1.8 Depicting the annual percentage rate on the original ten-year 8 % loan:
Particulars Value
Interest rate 8%
1.9 Depicting the effective annual rate (EAR) on the original ten-year 8 % loan:
Particulars Value
r 0.01
n 5.00
EAR 4.90
2.a Depicting the market rate of return for the bond:
Particulars Value
Current price 100.00
Time 10 years
Current price 78.12
Return 2.50%
5
1.7 Depicting how much will Casino.com Corporation owe on this loan after making
quarterly payments for three years:
Particulars Value
Interest rate 2.00%
Quarterly Payments $ 731,115
Time 28
Total payments conducted in 3 years $ 15,559,057
1.8 Depicting the annual percentage rate on the original ten-year 8 % loan:
Particulars Value
Interest rate 8%
1.9 Depicting the effective annual rate (EAR) on the original ten-year 8 % loan:
Particulars Value
r 0.01
n 5.00
EAR 4.90
2.a Depicting the market rate of return for the bond:
Particulars Value
Current price 100.00
Time 10 years
Current price 78.12
Return 2.50%
⊘ This is a preview!⊘
Do you want full access?
Subscribe today to unlock all pages.
Trusted by 1+ million students worldwide
BUSINESS FINANCE
6
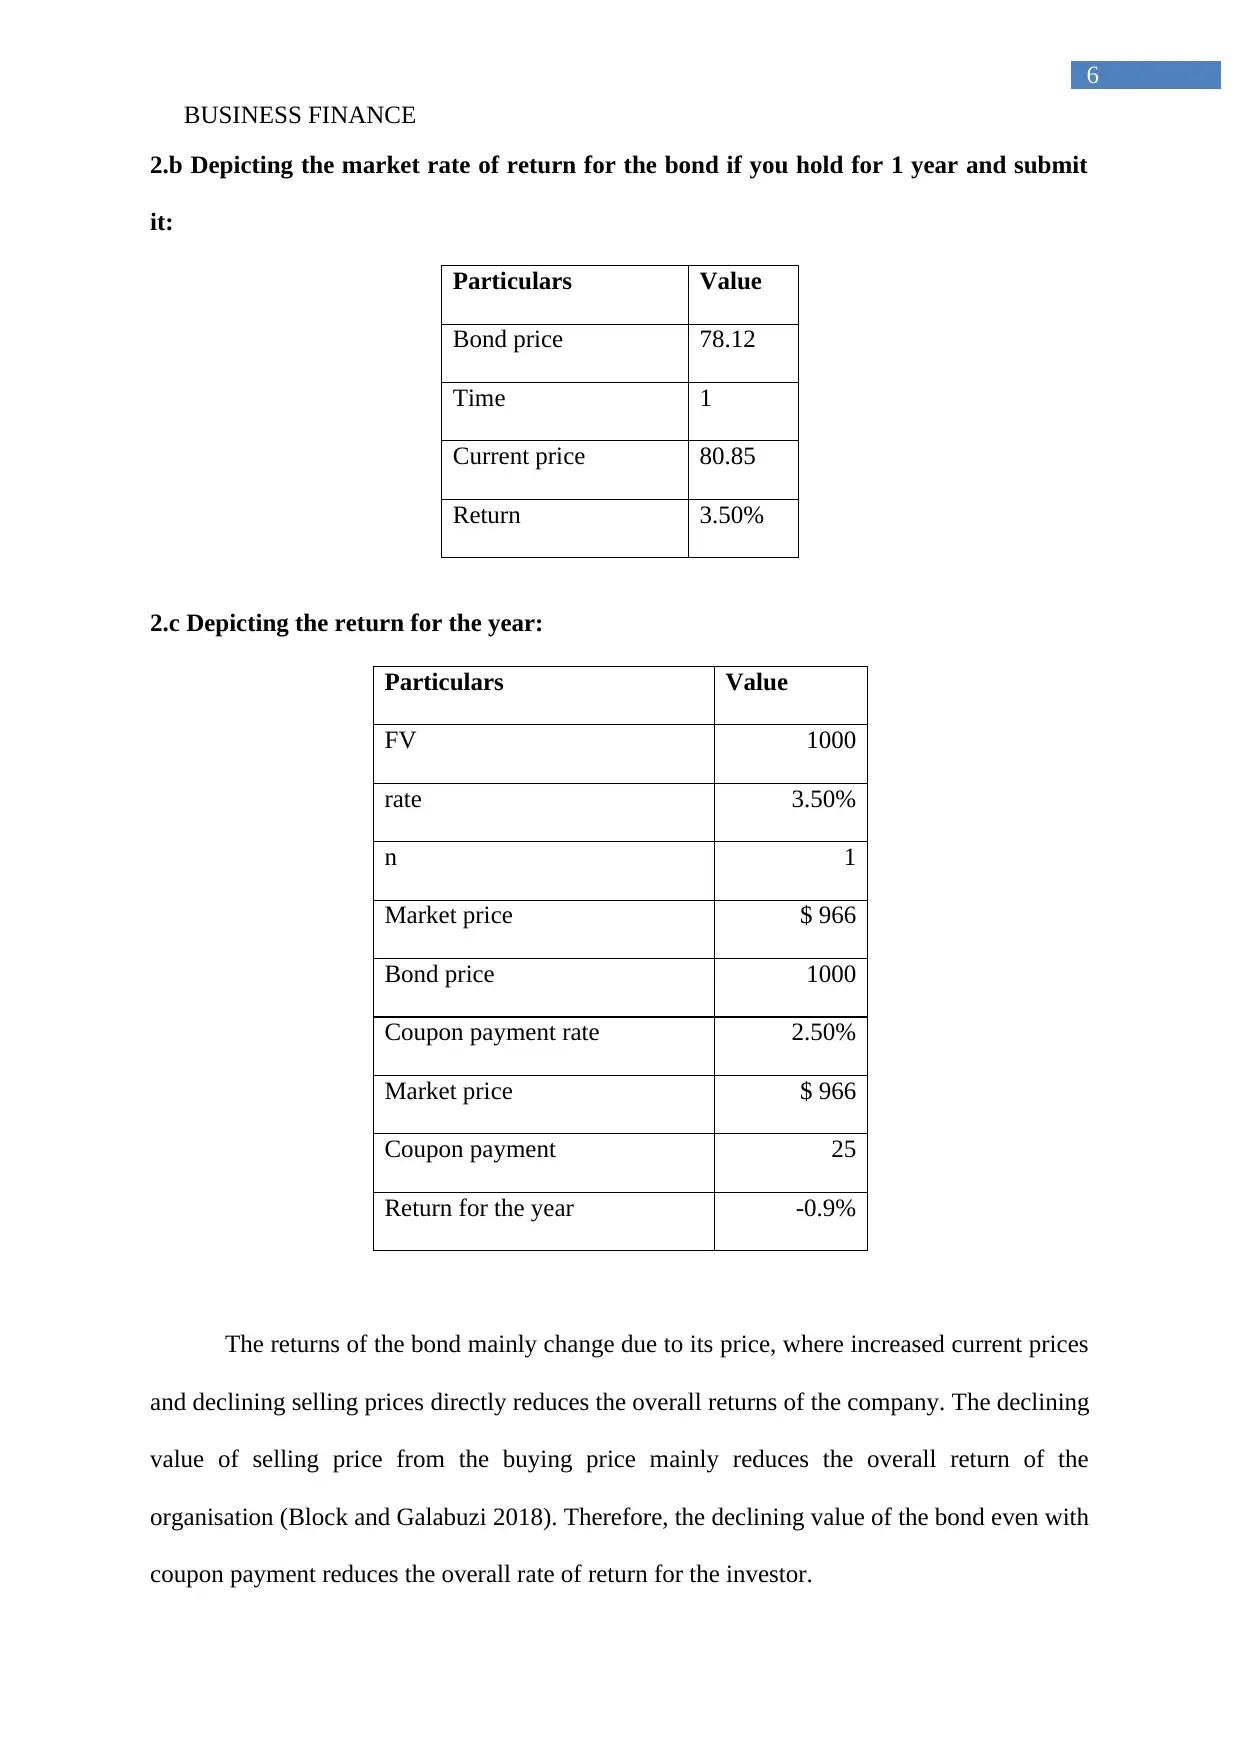
2.b Depicting the market rate of return for the bond if you hold for 1 year and submit
it:
Particulars Value
Bond price 78.12
Time 1
Current price 80.85
Return 3.50%
2.c Depicting the return for the year:
Particulars Value
FV 1000
rate 3.50%
n 1
Market price $ 966
Bond price 1000
Coupon payment rate 2.50%
Market price $ 966
Coupon payment 25
Return for the year -0.9%
The returns of the bond mainly change due to its price, where increased current prices
and declining selling prices directly reduces the overall returns of the company. The declining
value of selling price from the buying price mainly reduces the overall return of the
organisation (Block and Galabuzi 2018). Therefore, the declining value of the bond even with
coupon payment reduces the overall rate of return for the investor.
6
2.b Depicting the market rate of return for the bond if you hold for 1 year and submit
it:
Particulars Value
Bond price 78.12
Time 1
Current price 80.85
Return 3.50%
2.c Depicting the return for the year:
Particulars Value
FV 1000
rate 3.50%
n 1
Market price $ 966
Bond price 1000
Coupon payment rate 2.50%
Market price $ 966
Coupon payment 25
Return for the year -0.9%
The returns of the bond mainly change due to its price, where increased current prices
and declining selling prices directly reduces the overall returns of the company. The declining
value of selling price from the buying price mainly reduces the overall return of the
organisation (Block and Galabuzi 2018). Therefore, the declining value of the bond even with
coupon payment reduces the overall rate of return for the investor.
Paraphrase This Document
Need a fresh take? Get an instant paraphrase of this document with our AI Paraphraser
BUSINESS FINANCE
7
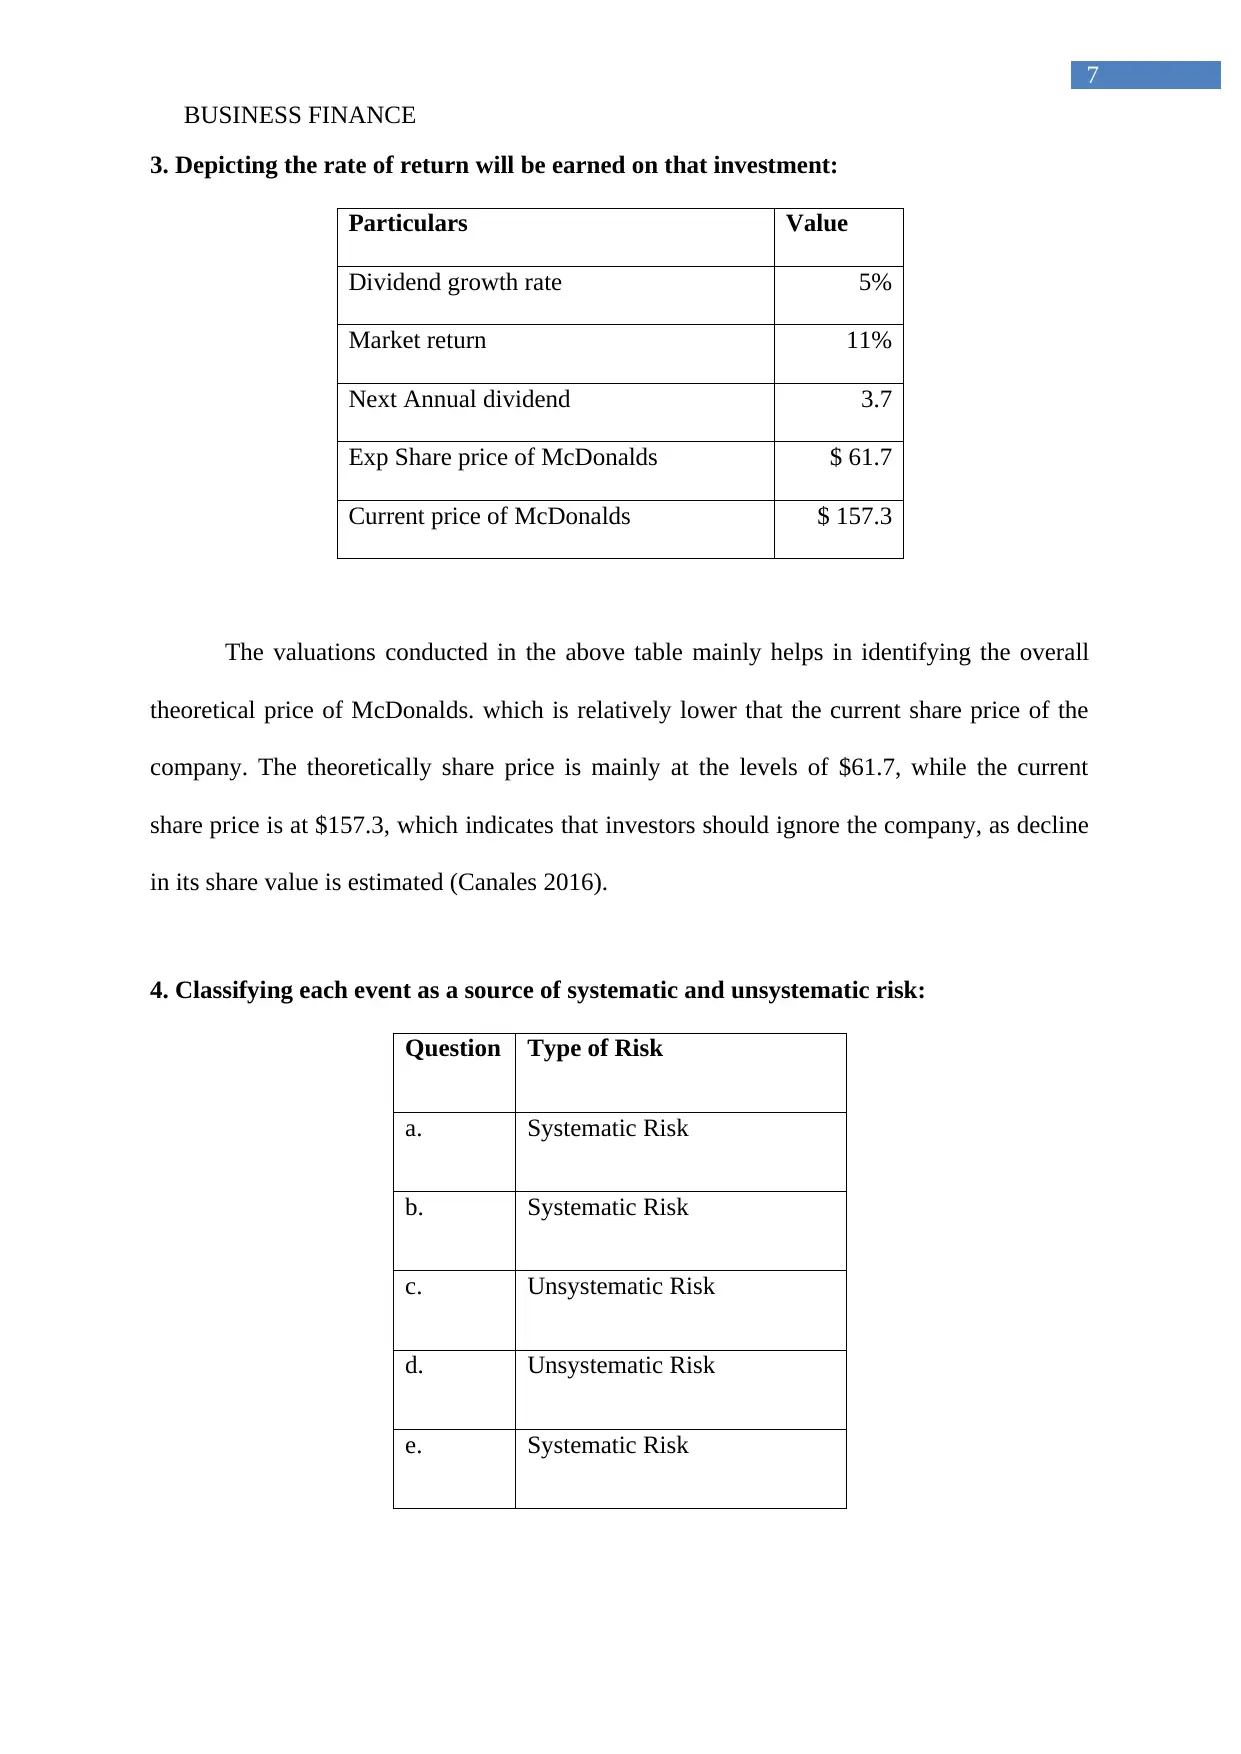
3. Depicting the rate of return will be earned on that investment:
Particulars Value
Dividend growth rate 5%
Market return 11%
Next Annual dividend 3.7
Exp Share price of McDonalds $ 61.7
Current price of McDonalds $ 157.3
The valuations conducted in the above table mainly helps in identifying the overall
theoretical price of McDonalds. which is relatively lower that the current share price of the
company. The theoretically share price is mainly at the levels of $61.7, while the current
share price is at $157.3, which indicates that investors should ignore the company, as decline
in its share value is estimated (Canales 2016).
4. Classifying each event as a source of systematic and unsystematic risk:
Question Type of Risk
a. Systematic Risk
b. Systematic Risk
c. Unsystematic Risk
d. Unsystematic Risk
e. Systematic Risk
7
3. Depicting the rate of return will be earned on that investment:
Particulars Value
Dividend growth rate 5%
Market return 11%
Next Annual dividend 3.7
Exp Share price of McDonalds $ 61.7
Current price of McDonalds $ 157.3
The valuations conducted in the above table mainly helps in identifying the overall
theoretical price of McDonalds. which is relatively lower that the current share price of the
company. The theoretically share price is mainly at the levels of $61.7, while the current
share price is at $157.3, which indicates that investors should ignore the company, as decline
in its share value is estimated (Canales 2016).
4. Classifying each event as a source of systematic and unsystematic risk:
Question Type of Risk
a. Systematic Risk
b. Systematic Risk
c. Unsystematic Risk
d. Unsystematic Risk
e. Systematic Risk
BUSINESS FINANCE
8
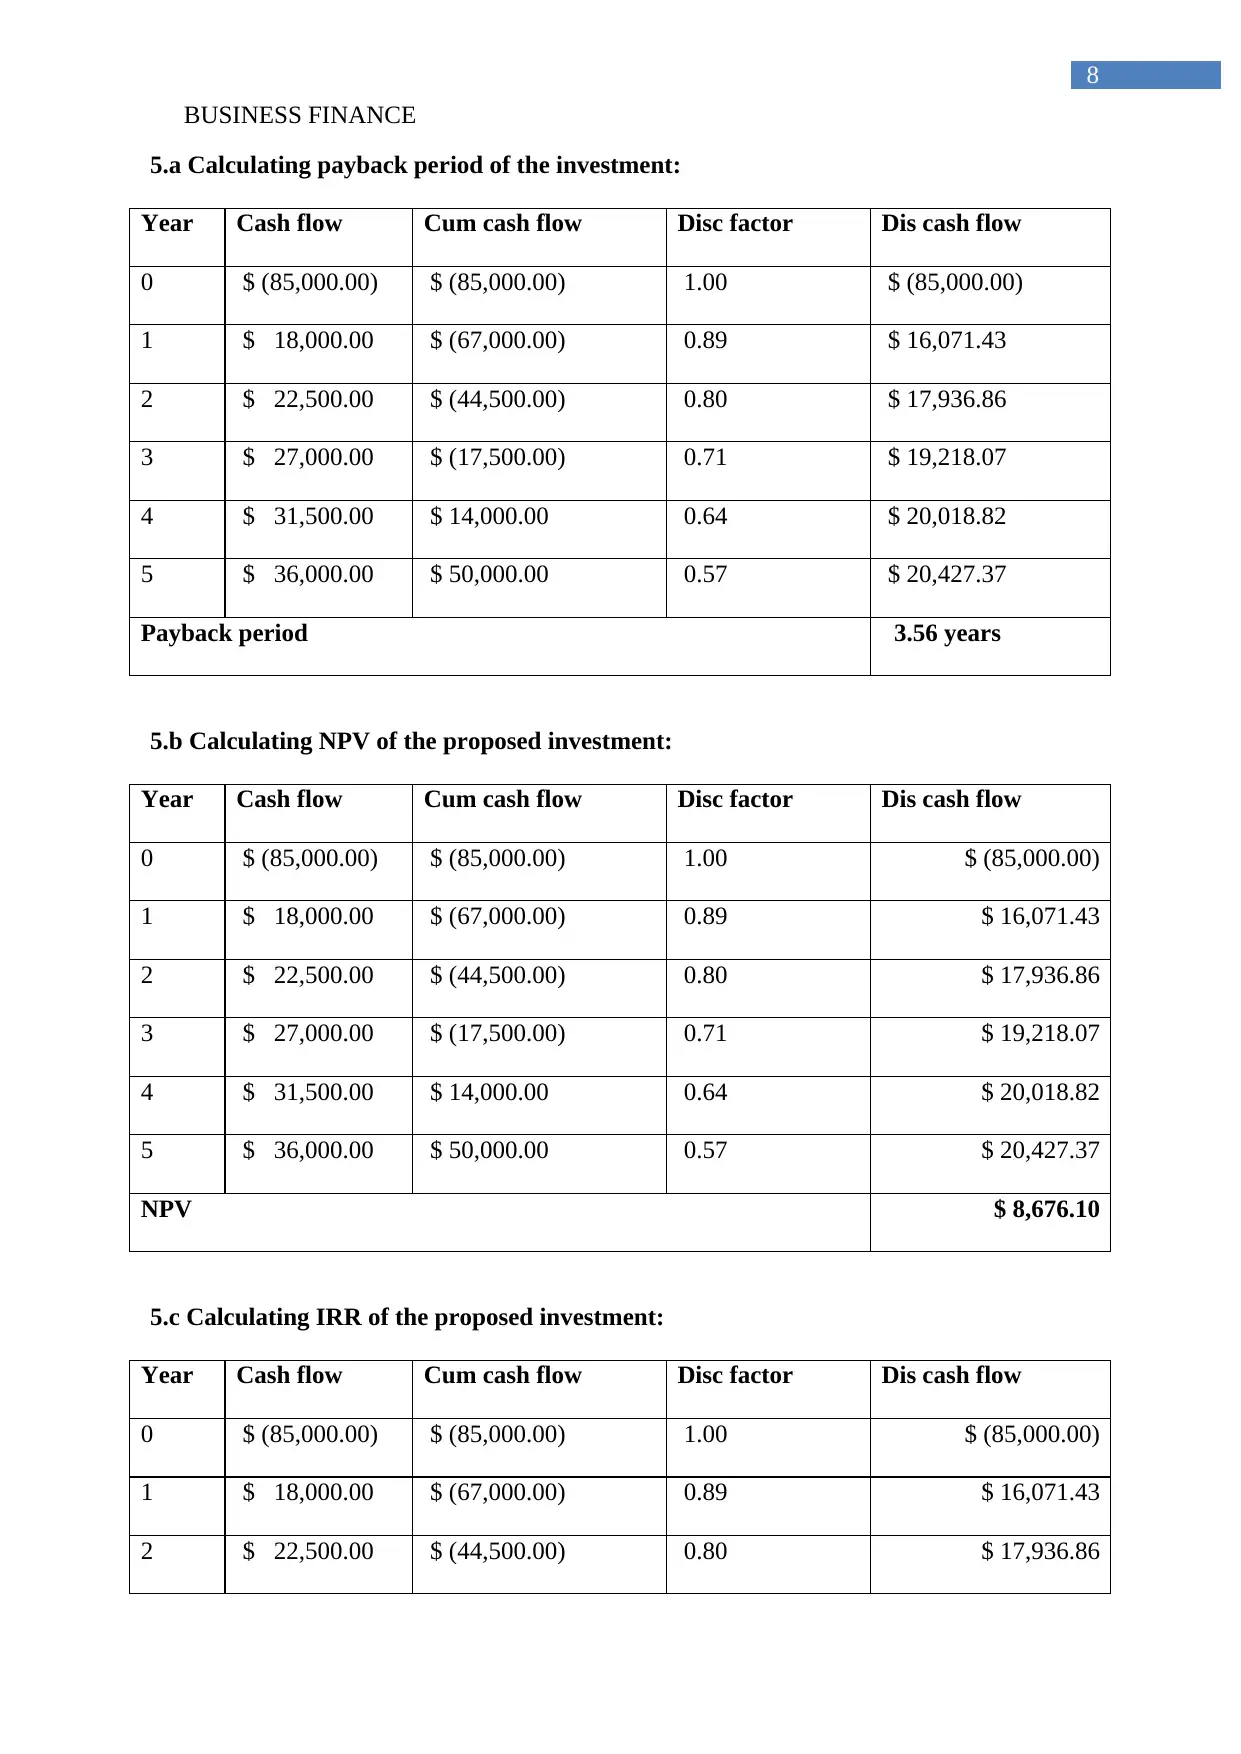
5.a Calculating payback period of the investment:
Year Cash flow Cum cash flow Disc factor Dis cash flow
0 $ (85,000.00) $ (85,000.00) 1.00 $ (85,000.00)
1 $ 18,000.00 $ (67,000.00) 0.89 $ 16,071.43
2 $ 22,500.00 $ (44,500.00) 0.80 $ 17,936.86
3 $ 27,000.00 $ (17,500.00) 0.71 $ 19,218.07
4 $ 31,500.00 $ 14,000.00 0.64 $ 20,018.82
5 $ 36,000.00 $ 50,000.00 0.57 $ 20,427.37
Payback period 3.56 years
5.b Calculating NPV of the proposed investment:
Year Cash flow Cum cash flow Disc factor Dis cash flow
0 $ (85,000.00) $ (85,000.00) 1.00 $ (85,000.00)
1 $ 18,000.00 $ (67,000.00) 0.89 $ 16,071.43
2 $ 22,500.00 $ (44,500.00) 0.80 $ 17,936.86
3 $ 27,000.00 $ (17,500.00) 0.71 $ 19,218.07
4 $ 31,500.00 $ 14,000.00 0.64 $ 20,018.82
5 $ 36,000.00 $ 50,000.00 0.57 $ 20,427.37
NPV $ 8,676.10
5.c Calculating IRR of the proposed investment:
Year Cash flow Cum cash flow Disc factor Dis cash flow
0 $ (85,000.00) $ (85,000.00) 1.00 $ (85,000.00)
1 $ 18,000.00 $ (67,000.00) 0.89 $ 16,071.43
2 $ 22,500.00 $ (44,500.00) 0.80 $ 17,936.86
8
5.a Calculating payback period of the investment:
Year Cash flow Cum cash flow Disc factor Dis cash flow
0 $ (85,000.00) $ (85,000.00) 1.00 $ (85,000.00)
1 $ 18,000.00 $ (67,000.00) 0.89 $ 16,071.43
2 $ 22,500.00 $ (44,500.00) 0.80 $ 17,936.86
3 $ 27,000.00 $ (17,500.00) 0.71 $ 19,218.07
4 $ 31,500.00 $ 14,000.00 0.64 $ 20,018.82
5 $ 36,000.00 $ 50,000.00 0.57 $ 20,427.37
Payback period 3.56 years
5.b Calculating NPV of the proposed investment:
Year Cash flow Cum cash flow Disc factor Dis cash flow
0 $ (85,000.00) $ (85,000.00) 1.00 $ (85,000.00)
1 $ 18,000.00 $ (67,000.00) 0.89 $ 16,071.43
2 $ 22,500.00 $ (44,500.00) 0.80 $ 17,936.86
3 $ 27,000.00 $ (17,500.00) 0.71 $ 19,218.07
4 $ 31,500.00 $ 14,000.00 0.64 $ 20,018.82
5 $ 36,000.00 $ 50,000.00 0.57 $ 20,427.37
NPV $ 8,676.10
5.c Calculating IRR of the proposed investment:
Year Cash flow Cum cash flow Disc factor Dis cash flow
0 $ (85,000.00) $ (85,000.00) 1.00 $ (85,000.00)
1 $ 18,000.00 $ (67,000.00) 0.89 $ 16,071.43
2 $ 22,500.00 $ (44,500.00) 0.80 $ 17,936.86
⊘ This is a preview!⊘
Do you want full access?
Subscribe today to unlock all pages.
Trusted by 1+ million students worldwide
BUSINESS FINANCE
9
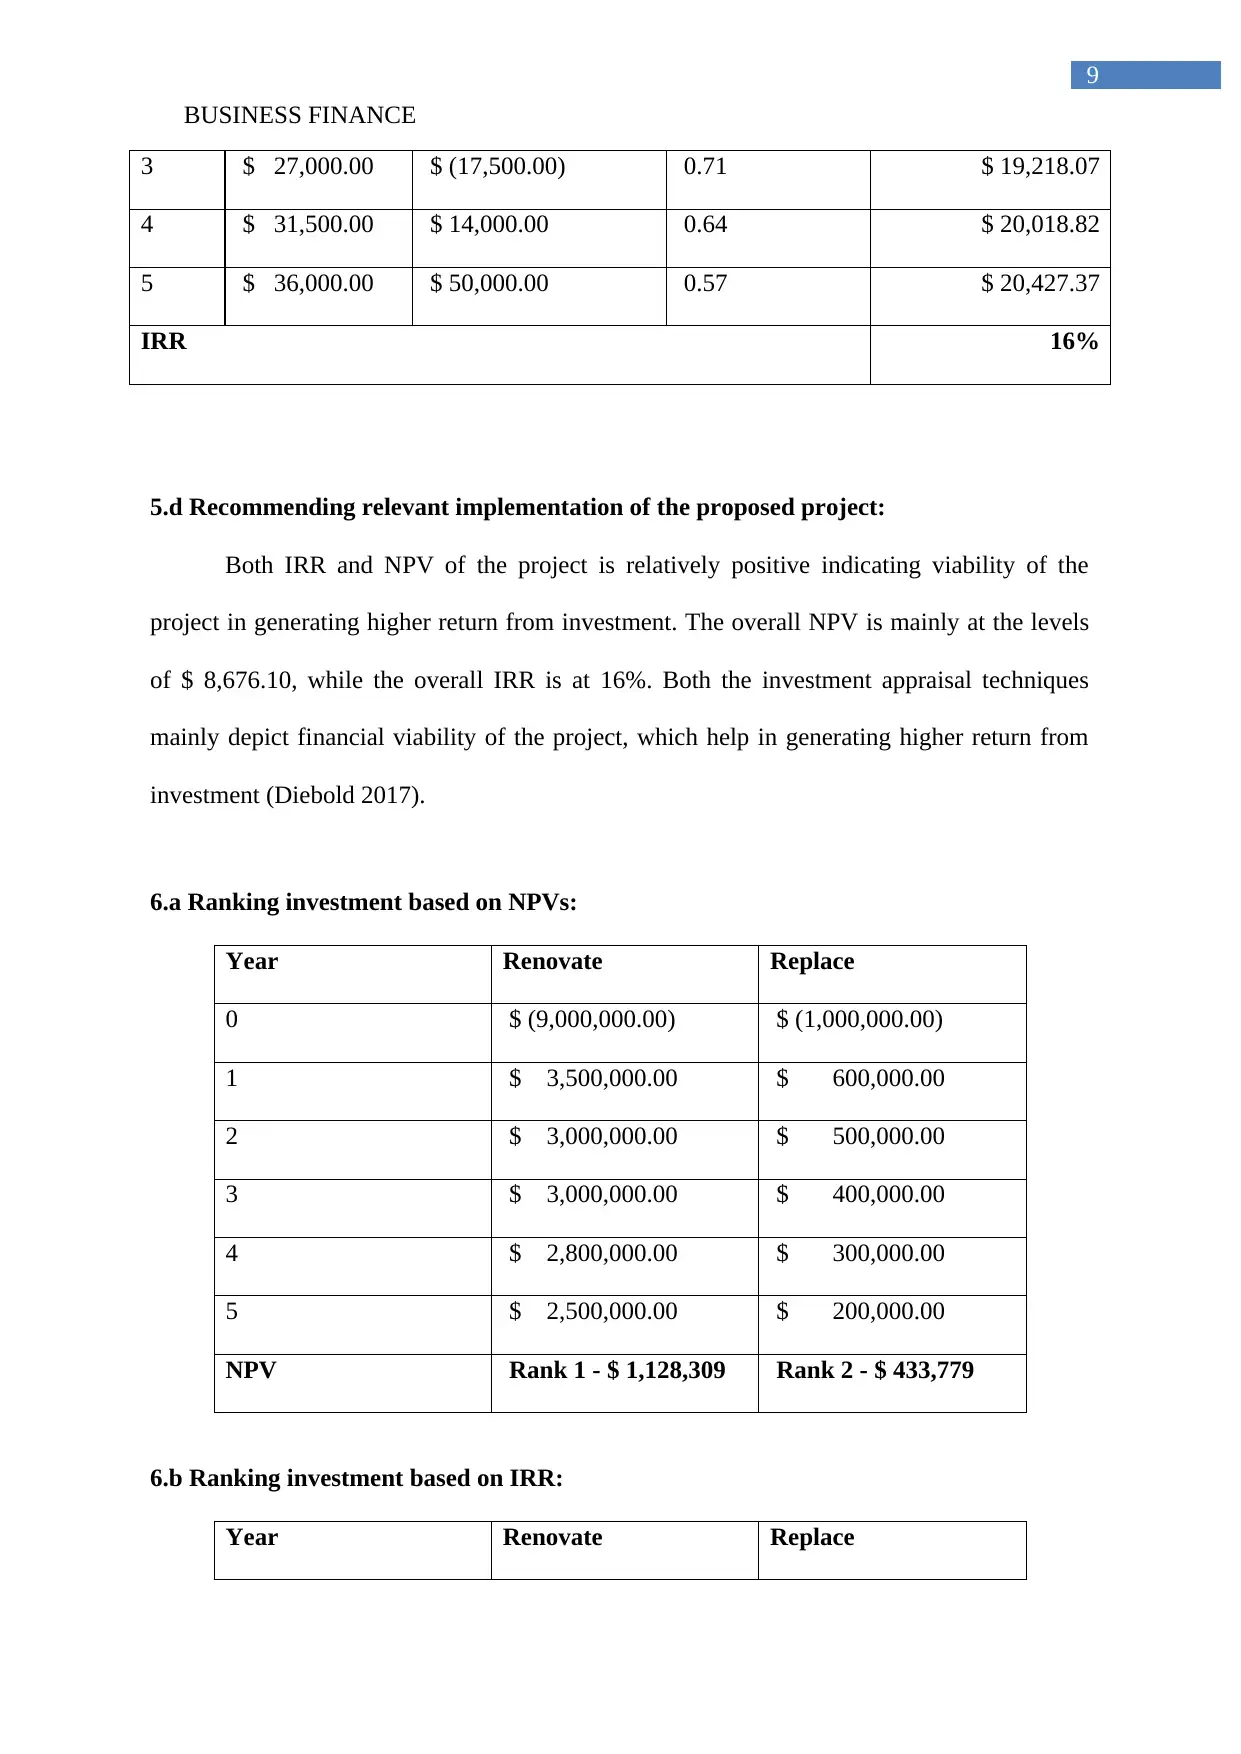
3 $ 27,000.00 $ (17,500.00) 0.71 $ 19,218.07
4 $ 31,500.00 $ 14,000.00 0.64 $ 20,018.82
5 $ 36,000.00 $ 50,000.00 0.57 $ 20,427.37
IRR 16%
5.d Recommending relevant implementation of the proposed project:
Both IRR and NPV of the project is relatively positive indicating viability of the
project in generating higher return from investment. The overall NPV is mainly at the levels
of $ 8,676.10, while the overall IRR is at 16%. Both the investment appraisal techniques
mainly depict financial viability of the project, which help in generating higher return from
investment (Diebold 2017).
6.a Ranking investment based on NPVs:
Year Renovate Replace
0 $ (9,000,000.00) $ (1,000,000.00)
1 $ 3,500,000.00 $ 600,000.00
2 $ 3,000,000.00 $ 500,000.00
3 $ 3,000,000.00 $ 400,000.00
4 $ 2,800,000.00 $ 300,000.00
5 $ 2,500,000.00 $ 200,000.00
NPV Rank 1 - $ 1,128,309 Rank 2 - $ 433,779
6.b Ranking investment based on IRR:
Year Renovate Replace
9
3 $ 27,000.00 $ (17,500.00) 0.71 $ 19,218.07
4 $ 31,500.00 $ 14,000.00 0.64 $ 20,018.82
5 $ 36,000.00 $ 50,000.00 0.57 $ 20,427.37
IRR 16%
5.d Recommending relevant implementation of the proposed project:
Both IRR and NPV of the project is relatively positive indicating viability of the
project in generating higher return from investment. The overall NPV is mainly at the levels
of $ 8,676.10, while the overall IRR is at 16%. Both the investment appraisal techniques
mainly depict financial viability of the project, which help in generating higher return from
investment (Diebold 2017).
6.a Ranking investment based on NPVs:
Year Renovate Replace
0 $ (9,000,000.00) $ (1,000,000.00)
1 $ 3,500,000.00 $ 600,000.00
2 $ 3,000,000.00 $ 500,000.00
3 $ 3,000,000.00 $ 400,000.00
4 $ 2,800,000.00 $ 300,000.00
5 $ 2,500,000.00 $ 200,000.00
NPV Rank 1 - $ 1,128,309 Rank 2 - $ 433,779
6.b Ranking investment based on IRR:
Year Renovate Replace
Paraphrase This Document
Need a fresh take? Get an instant paraphrase of this document with our AI Paraphraser
BUSINESS FINANCE
10
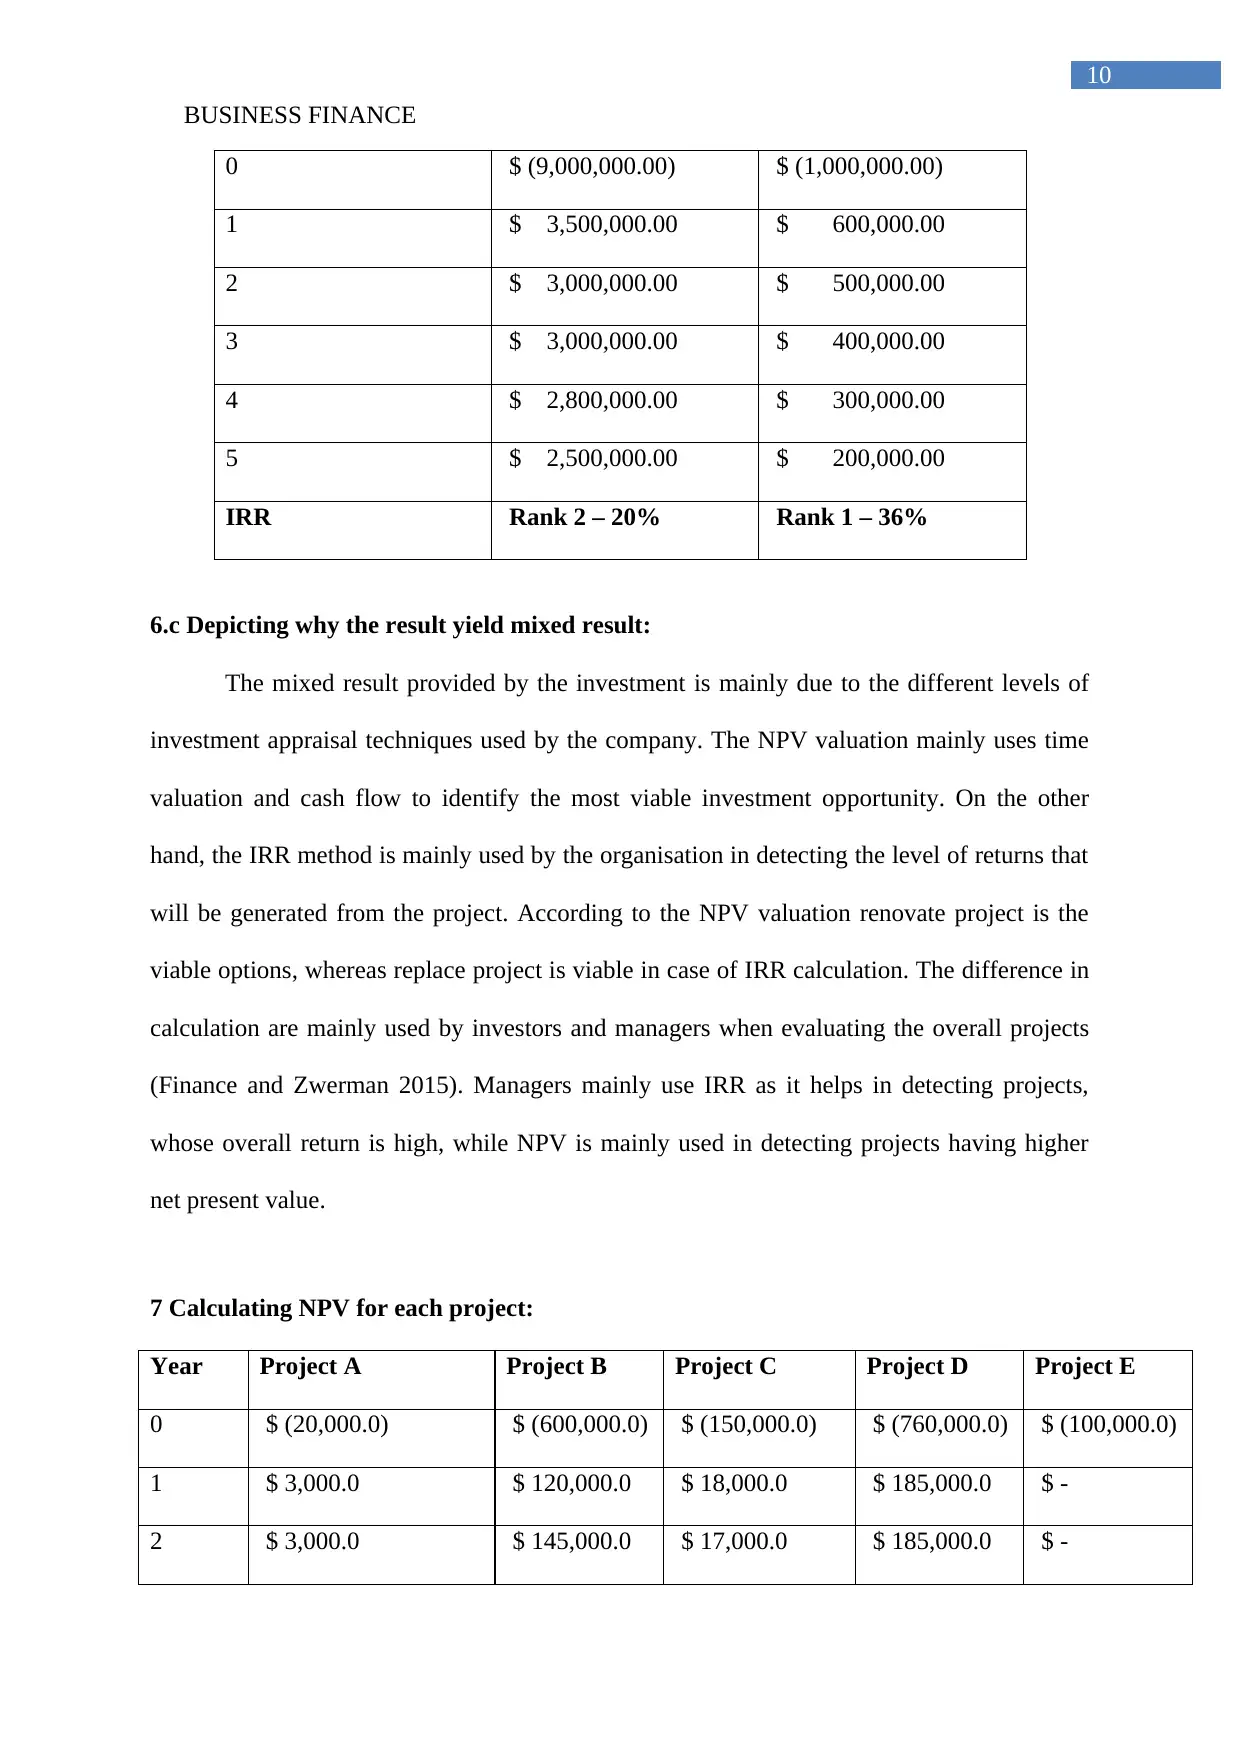
0 $ (9,000,000.00) $ (1,000,000.00)
1 $ 3,500,000.00 $ 600,000.00
2 $ 3,000,000.00 $ 500,000.00
3 $ 3,000,000.00 $ 400,000.00
4 $ 2,800,000.00 $ 300,000.00
5 $ 2,500,000.00 $ 200,000.00
IRR Rank 2 – 20% Rank 1 – 36%
6.c Depicting why the result yield mixed result:
The mixed result provided by the investment is mainly due to the different levels of
investment appraisal techniques used by the company. The NPV valuation mainly uses time
valuation and cash flow to identify the most viable investment opportunity. On the other
hand, the IRR method is mainly used by the organisation in detecting the level of returns that
will be generated from the project. According to the NPV valuation renovate project is the
viable options, whereas replace project is viable in case of IRR calculation. The difference in
calculation are mainly used by investors and managers when evaluating the overall projects
(Finance and Zwerman 2015). Managers mainly use IRR as it helps in detecting projects,
whose overall return is high, while NPV is mainly used in detecting projects having higher
net present value.
7 Calculating NPV for each project:
Year Project A Project B Project C Project D Project E
0 $ (20,000.0) $ (600,000.0) $ (150,000.0) $ (760,000.0) $ (100,000.0)
1 $ 3,000.0 $ 120,000.0 $ 18,000.0 $ 185,000.0 $ -
2 $ 3,000.0 $ 145,000.0 $ 17,000.0 $ 185,000.0 $ -
10
0 $ (9,000,000.00) $ (1,000,000.00)
1 $ 3,500,000.00 $ 600,000.00
2 $ 3,000,000.00 $ 500,000.00
3 $ 3,000,000.00 $ 400,000.00
4 $ 2,800,000.00 $ 300,000.00
5 $ 2,500,000.00 $ 200,000.00
IRR Rank 2 – 20% Rank 1 – 36%
6.c Depicting why the result yield mixed result:
The mixed result provided by the investment is mainly due to the different levels of
investment appraisal techniques used by the company. The NPV valuation mainly uses time
valuation and cash flow to identify the most viable investment opportunity. On the other
hand, the IRR method is mainly used by the organisation in detecting the level of returns that
will be generated from the project. According to the NPV valuation renovate project is the
viable options, whereas replace project is viable in case of IRR calculation. The difference in
calculation are mainly used by investors and managers when evaluating the overall projects
(Finance and Zwerman 2015). Managers mainly use IRR as it helps in detecting projects,
whose overall return is high, while NPV is mainly used in detecting projects having higher
net present value.
7 Calculating NPV for each project:
Year Project A Project B Project C Project D Project E
0 $ (20,000.0) $ (600,000.0) $ (150,000.0) $ (760,000.0) $ (100,000.0)
1 $ 3,000.0 $ 120,000.0 $ 18,000.0 $ 185,000.0 $ -
2 $ 3,000.0 $ 145,000.0 $ 17,000.0 $ 185,000.0 $ -
BUSINESS FINANCE
11
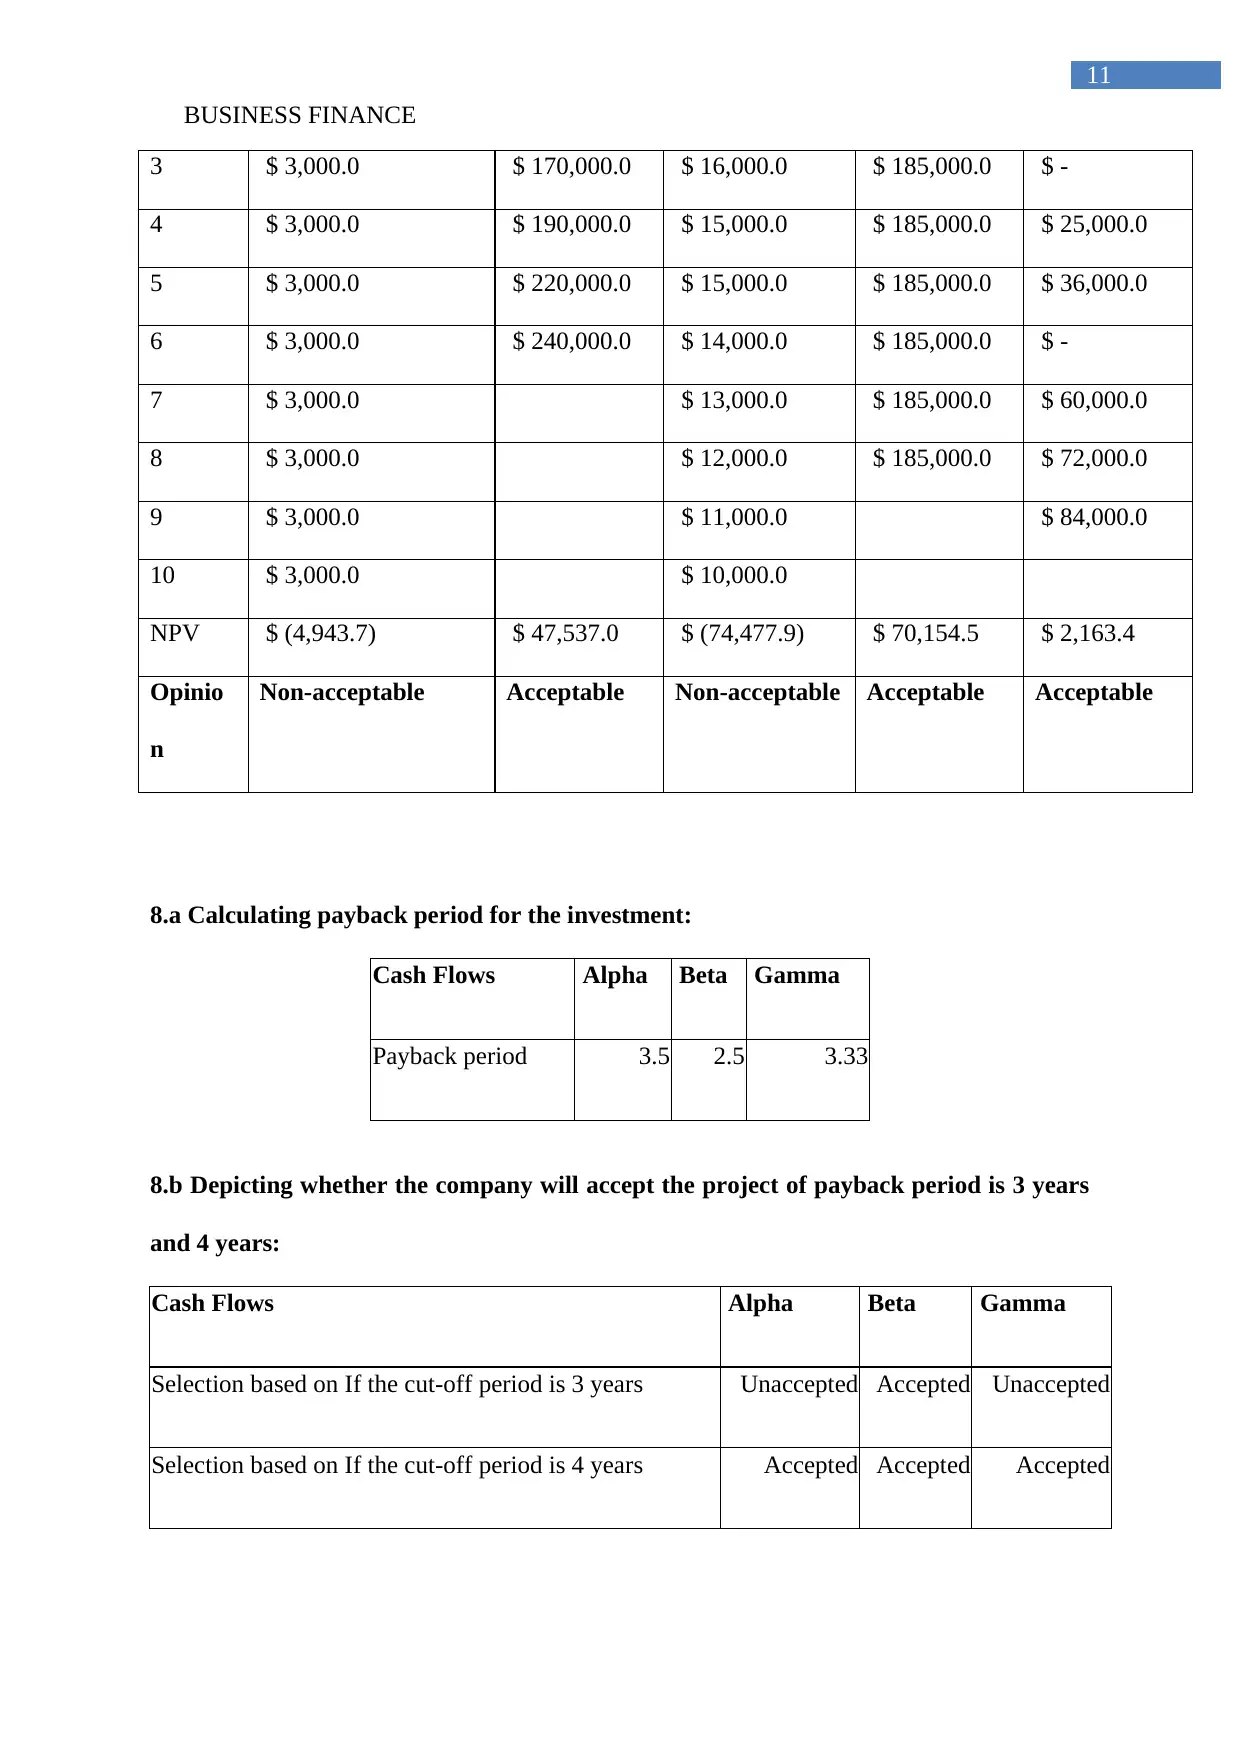
3 $ 3,000.0 $ 170,000.0 $ 16,000.0 $ 185,000.0 $ -
4 $ 3,000.0 $ 190,000.0 $ 15,000.0 $ 185,000.0 $ 25,000.0
5 $ 3,000.0 $ 220,000.0 $ 15,000.0 $ 185,000.0 $ 36,000.0
6 $ 3,000.0 $ 240,000.0 $ 14,000.0 $ 185,000.0 $ -
7 $ 3,000.0 $ 13,000.0 $ 185,000.0 $ 60,000.0
8 $ 3,000.0 $ 12,000.0 $ 185,000.0 $ 72,000.0
9 $ 3,000.0 $ 11,000.0 $ 84,000.0
10 $ 3,000.0 $ 10,000.0
NPV $ (4,943.7) $ 47,537.0 $ (74,477.9) $ 70,154.5 $ 2,163.4
Opinio
n
Non-acceptable Acceptable Non-acceptable Acceptable Acceptable
8.a Calculating payback period for the investment:
Cash Flows Alpha Beta Gamma
Payback period 3.5 2.5 3.33
8.b Depicting whether the company will accept the project of payback period is 3 years
and 4 years:
Cash Flows Alpha Beta Gamma
Selection based on If the cut-off period is 3 years Unaccepted Accepted Unaccepted
Selection based on If the cut-off period is 4 years Accepted Accepted Accepted
11
3 $ 3,000.0 $ 170,000.0 $ 16,000.0 $ 185,000.0 $ -
4 $ 3,000.0 $ 190,000.0 $ 15,000.0 $ 185,000.0 $ 25,000.0
5 $ 3,000.0 $ 220,000.0 $ 15,000.0 $ 185,000.0 $ 36,000.0
6 $ 3,000.0 $ 240,000.0 $ 14,000.0 $ 185,000.0 $ -
7 $ 3,000.0 $ 13,000.0 $ 185,000.0 $ 60,000.0
8 $ 3,000.0 $ 12,000.0 $ 185,000.0 $ 72,000.0
9 $ 3,000.0 $ 11,000.0 $ 84,000.0
10 $ 3,000.0 $ 10,000.0
NPV $ (4,943.7) $ 47,537.0 $ (74,477.9) $ 70,154.5 $ 2,163.4
Opinio
n
Non-acceptable Acceptable Non-acceptable Acceptable Acceptable
8.a Calculating payback period for the investment:
Cash Flows Alpha Beta Gamma
Payback period 3.5 2.5 3.33
8.b Depicting whether the company will accept the project of payback period is 3 years
and 4 years:
Cash Flows Alpha Beta Gamma
Selection based on If the cut-off period is 3 years Unaccepted Accepted Unaccepted
Selection based on If the cut-off period is 4 years Accepted Accepted Accepted
⊘ This is a preview!⊘
Do you want full access?
Subscribe today to unlock all pages.
Trusted by 1+ million students worldwide
1 out of 15
Related Documents


Your All-in-One AI-Powered Toolkit for Academic Success.
+13062052269
info@desklib.com
Available 24*7 on WhatsApp / Email
![[object Object]](/_next/static/media/star-bottom.7253800d.svg)
Unlock your academic potential
Copyright © 2020–2025 A2Z Services. All Rights Reserved. Developed and managed by ZUCOL.