Financial Analysis of TPG Telecom Ltd for Investment Recommendation
VerifiedAdded on 2022/11/13
|17
|3819
|109
AI Summary
This report is on the investment recommendation to an international investor that is interested in making an investment in the Australian market. TPG Telecom Limited is the company analysed in this report using last two years financial data from the company’s annual report. Analysis of two groups of ratios: profitability ratios and operating efficiency ratios is done.
Contribute Materials
Your contribution can guide someone’s learning journey. Share your
documents today.

Running Head: Business Finance
Business Finance
University Name
Student Name
Business Finance
University Name
Student Name
Secure Best Marks with AI Grader
Need help grading? Try our AI Grader for instant feedback on your assignments.
Business Finance
Abstract
This report is on the investment recommendation to an international investor that is
interested in making an investment in the Australian market. TPG Telecom Limited is the
company analysed in this report using last two years financial data from the company’s
annual report. Analysis of two groups of ratios: profitability ratios and operating efficiency
ratios is done. On the basis of this ratio analysis it is seen that most of these ratios for TPG
deteriorated in last two years. This document also analysed the share price movement of
TPG to found that its volatility of 11% is lot higher as compared to the 3% volatility of the
All Ordinaries index price. It is also noted that the company’s share price is positively
correlated to the index price as its correlation coefficient is calculated to be 0.395. This
report used Gordon growth model and calculated the TPG’s cost equity to be 4.72%. The
capital structure of the firm has only equity and debt but no preferred shares. So, the debt
to equity ratio of 47.37% is used to calculate the company’s WACC at 4.34%. Based on
the financial analysis, the report does not recommended investing in TPG Telecom Ltd.
The reasons for this investment decision are the company’s lack luster business
performance in the last two years and the increased uncertainty over the company’s future
depending upon the result of its potential merger with Vodafone.
Business Finance
Contents
1) Introduction......................................................................................................................1
2) Financial Analysis of TPG Telecom Ltd..........................................................................2
2.1. Description of TPG Telecom Ltd.................................................................................2
2.2. Analysis of financial ratios...........................................................................................3
2.2.1. Profitability Ratios:................................................................................................3
2.2.2. Efficiency Ratios:...................................................................................................4
2.3. Analysis of share price movement of TPG Telecom Ltd.............................................5
2.4. Calculation of cost of equity of TPG............................................................................8
4. Conclusion.......................................................................................................................12
5. References.......................................................................................................................13
Business Finance
1) Introduction
This consulting report performs the financial analysis of the business performance of TPG
Telecom Limited in the last two years to make an investment recommendation to an
international investor, interested in investing in the Australian market. TPG Telecom Ltd is
one of the largest telecom services providers in Australia. The company provides
consumer, wholesale and corporate telecommunication services. This report uses last two
years financial data from the company’s annual report to perform the ratio analysis of TPG.
The ratios this report uses are the profitability and operating efficiency ratios. The
profitability ratios that are used are net income margin, operating profit margin, return on
equity, return on assets and return on invested capital. The efficiency ratios used are
receivables turnover, payables turnover, total asset turnover and fixed-asset turnover.
This report also analyses the movement in the share price of the TPG to compare its
volatility with that of the index. The correlation in the movement of the stock price and its
riskiness in comparison to the general market is also measured. Then, the report uses
Gordon growth method to calculate TPG’s cost of equity. The capital structure of the firm is
also analysed to measure the proportion of debt and equity and to calculate the weighted
average cost of capital. Based on this financial analysis the report gives an investment
recommendation that whether or not the client should make an investment in TPG
Telecom Limited.
1
Secure Best Marks with AI Grader
Need help grading? Try our AI Grader for instant feedback on your assignments.
Business Finance
2) Financial Analysis of TPG Telecom Ltd
(Excel file with all the calculations is attached in the appendices)
2.1. Description of TPG Telecom Ltd
TPG Telecom Ltd. is one of the largest telecom services providers in Australia. The
company provides consumer, wholesale and corporate telecommunication services
(Morningstar, n.d.). These services include voice, data, internet, tele-housing and
broadband services. According to TPG (n.d.), the company has three business segments
for the provision of these services: TPG Consumer (provides internet, mobile and phone
products to residential and small business consumers), TPG corporate (provides
telecommunications networking and other services to government, corporate and
wholesale costumers), iiNet (provides cloud-based storage, networking and security
services).
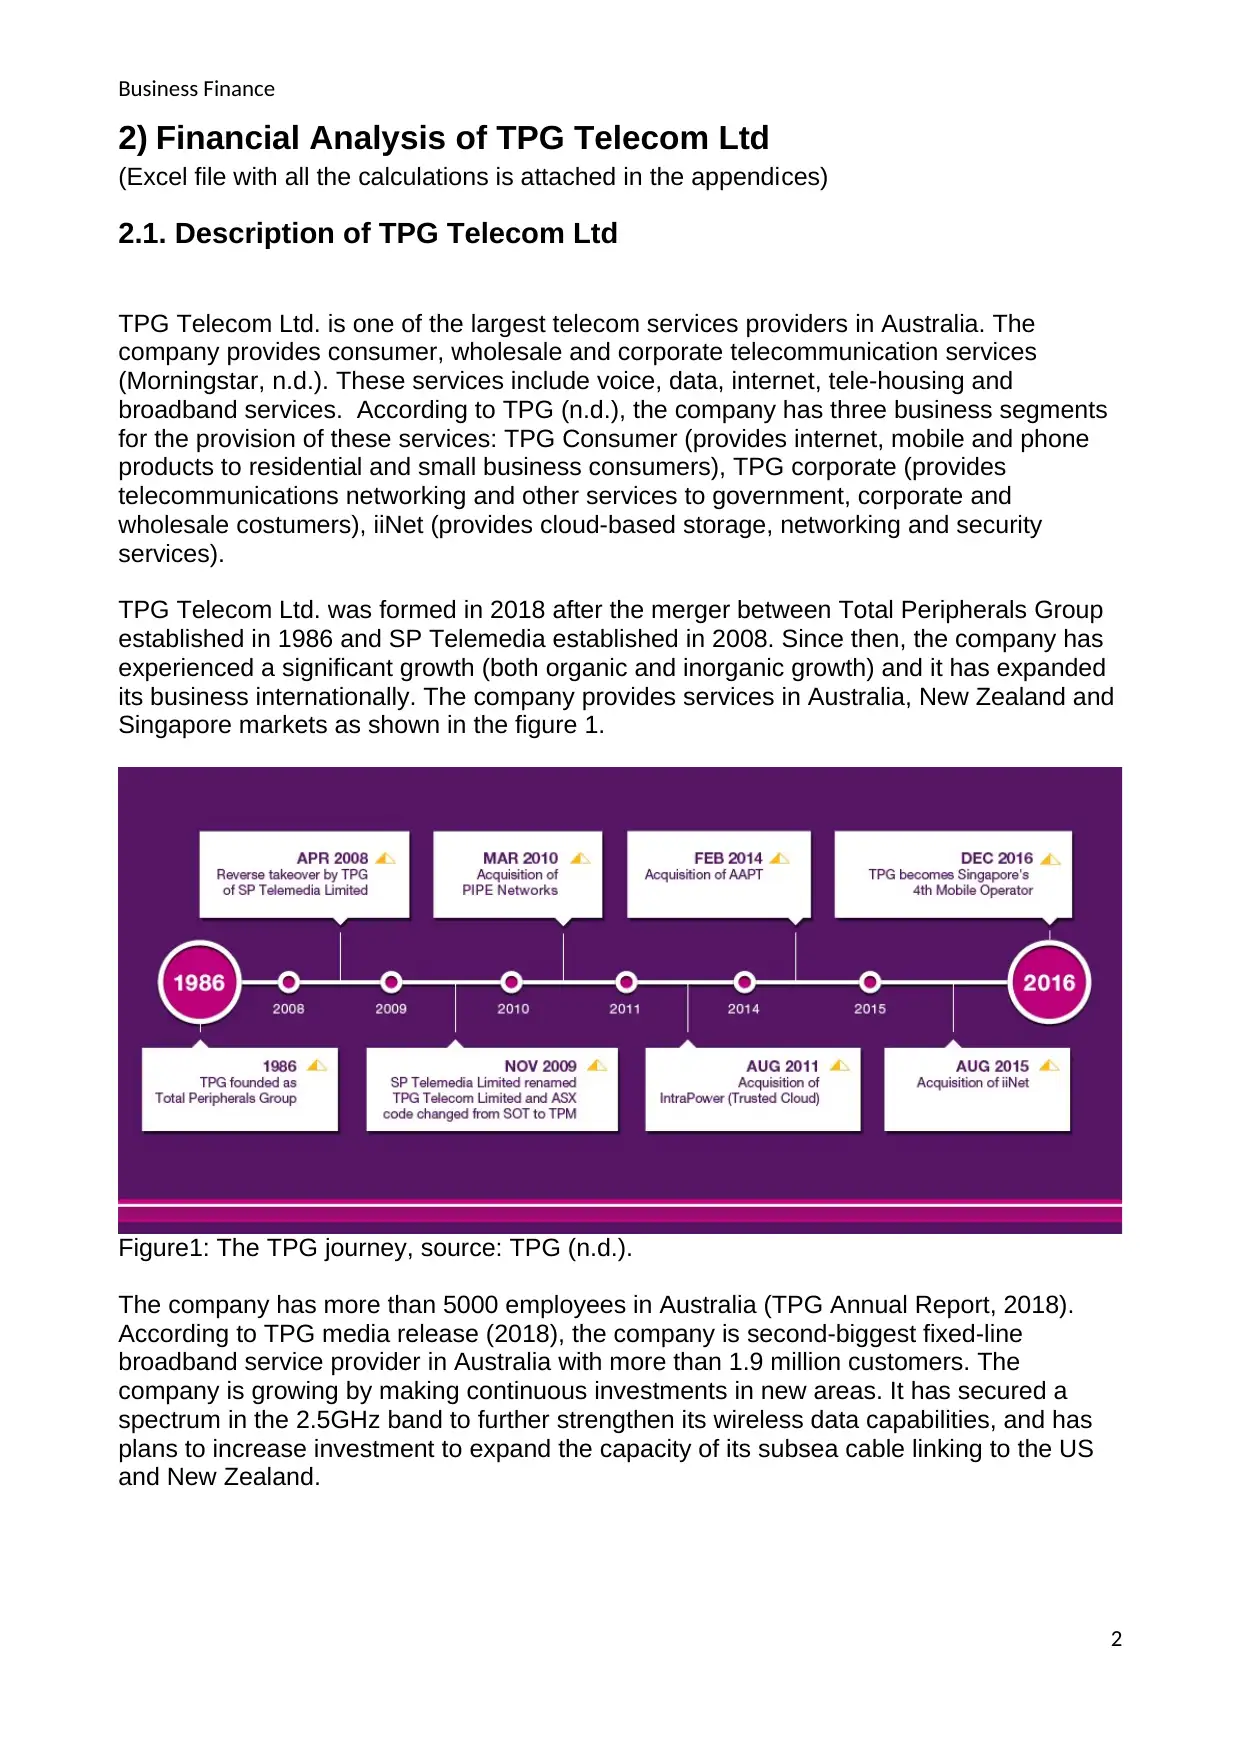
TPG Telecom Ltd. was formed in 2018 after the merger between Total Peripherals Group
established in 1986 and SP Telemedia established in 2008. Since then, the company has
experienced a significant growth (both organic and inorganic growth) and it has expanded
its business internationally. The company provides services in Australia, New Zealand and
Singapore markets as shown in the figure 1.
Figure1: The TPG journey, source: TPG (n.d.).
The company has more than 5000 employees in Australia (TPG Annual Report, 2018).
According to TPG media release (2018), the company is second-biggest fixed-line
broadband service provider in Australia with more than 1.9 million customers. The
company is growing by making continuous investments in new areas. It has secured a
spectrum in the 2.5GHz band to further strengthen its wireless data capabilities, and has
plans to increase investment to expand the capacity of its subsea cable linking to the US
and New Zealand.
2
2) Financial Analysis of TPG Telecom Ltd
(Excel file with all the calculations is attached in the appendices)
2.1. Description of TPG Telecom Ltd
TPG Telecom Ltd. is one of the largest telecom services providers in Australia. The
company provides consumer, wholesale and corporate telecommunication services
(Morningstar, n.d.). These services include voice, data, internet, tele-housing and
broadband services. According to TPG (n.d.), the company has three business segments
for the provision of these services: TPG Consumer (provides internet, mobile and phone
products to residential and small business consumers), TPG corporate (provides
telecommunications networking and other services to government, corporate and
wholesale costumers), iiNet (provides cloud-based storage, networking and security
services).
TPG Telecom Ltd. was formed in 2018 after the merger between Total Peripherals Group
established in 1986 and SP Telemedia established in 2008. Since then, the company has
experienced a significant growth (both organic and inorganic growth) and it has expanded
its business internationally. The company provides services in Australia, New Zealand and
Singapore markets as shown in the figure 1.
Figure1: The TPG journey, source: TPG (n.d.).
The company has more than 5000 employees in Australia (TPG Annual Report, 2018).
According to TPG media release (2018), the company is second-biggest fixed-line
broadband service provider in Australia with more than 1.9 million customers. The
company is growing by making continuous investments in new areas. It has secured a
spectrum in the 2.5GHz band to further strengthen its wireless data capabilities, and has
plans to increase investment to expand the capacity of its subsea cable linking to the US
and New Zealand.
2

Business Finance
TPG telecom limited has various competitive advantages because of its large size and
vast experience like: Strong distribution network and dealer community via which the
company can reach most of its potential market; extremely low-cost telecommunications
services and vast fibre networks but Telstra Corporation has a more scalable network.
Other advantage for TPG is that the company is led by its chairman David Teoh, who is
also a major share-holder. So, the company is run more like a private business with focus
on long run success rather than short term profitablility (Raszkiewicz, 2017).
3
Business Finance
2.2. Analysis of financial ratios
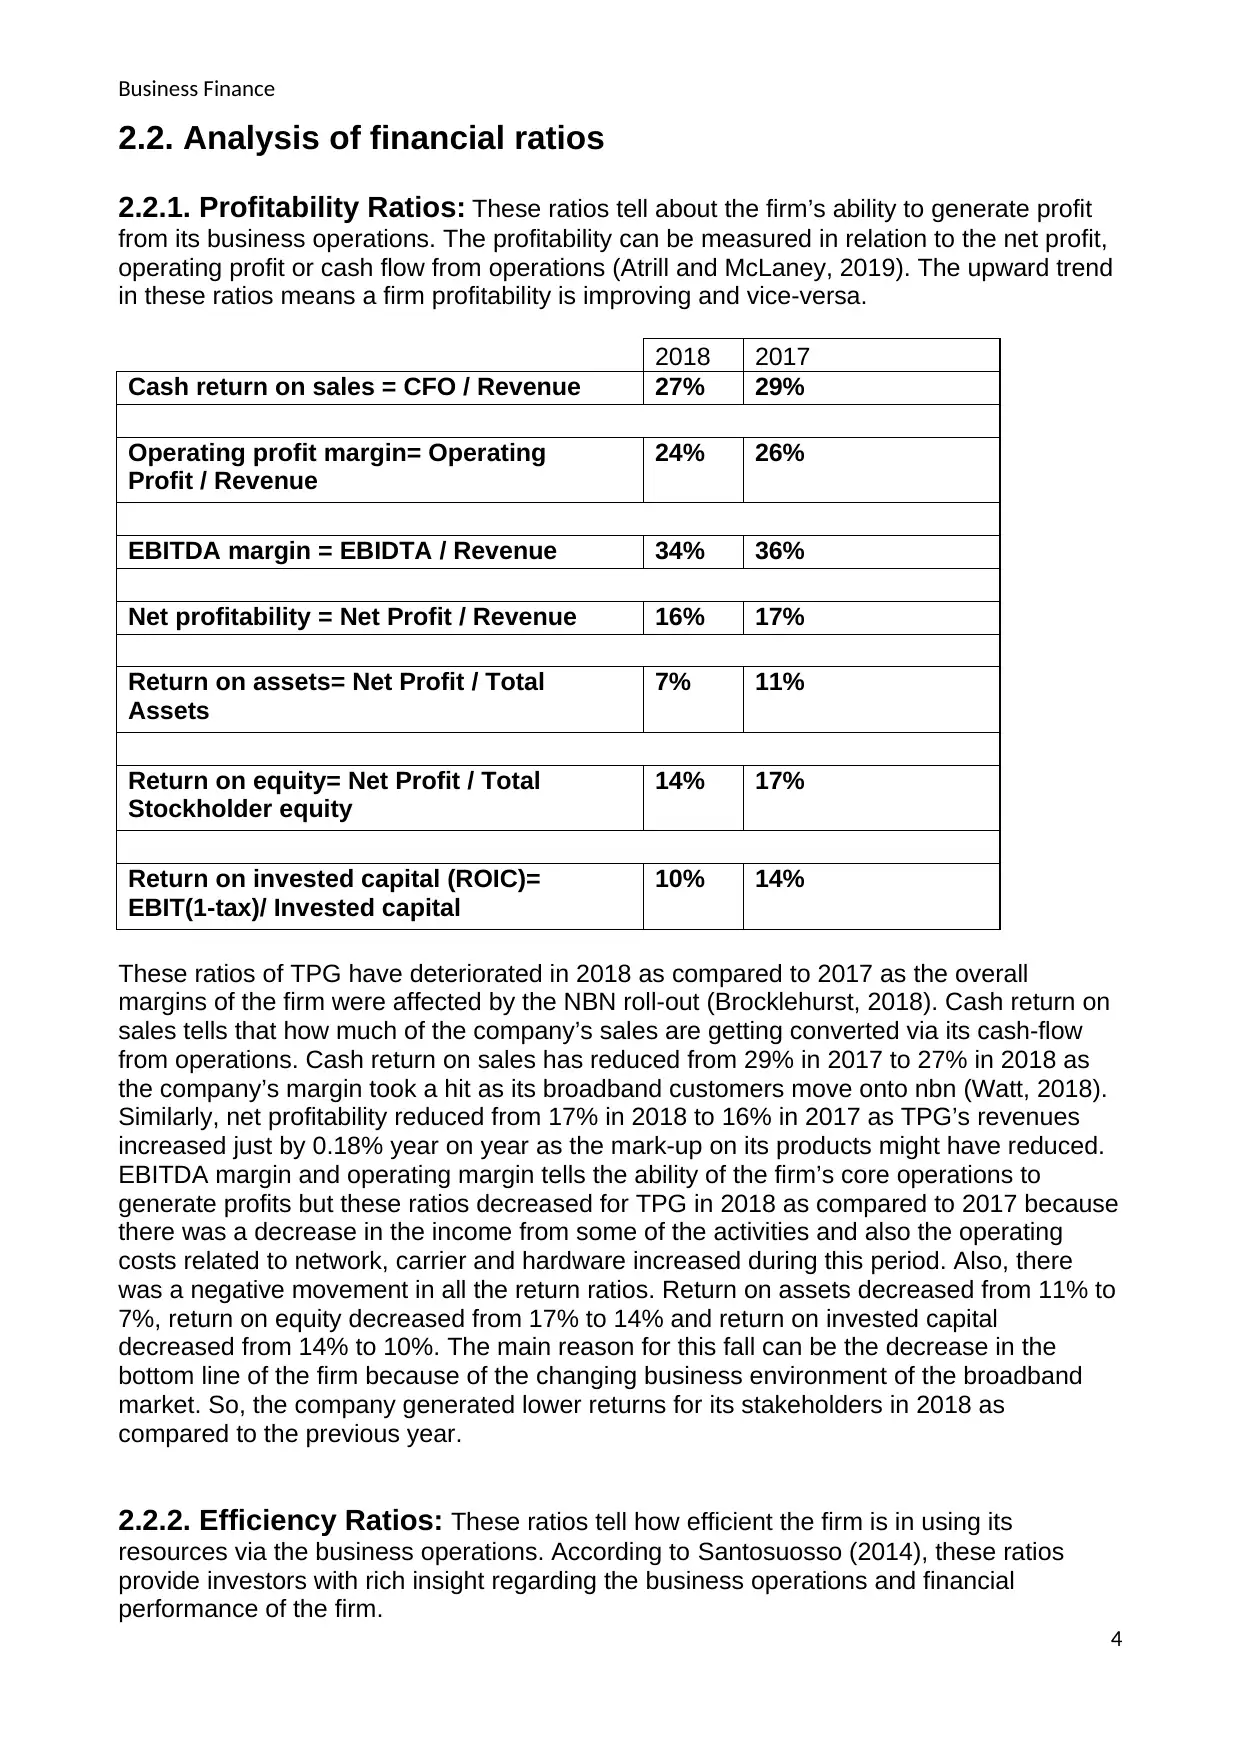
2.2.1. Profitability Ratios: These ratios tell about the firm’s ability to generate profit
from its business operations. The profitability can be measured in relation to the net profit,
operating profit or cash flow from operations (Atrill and McLaney, 2019). The upward trend
in these ratios means a firm profitability is improving and vice-versa.
2018 2017
Cash return on sales = CFO / Revenue 27% 29%
Operating profit margin= Operating
Profit / Revenue
24% 26%
EBITDA margin = EBIDTA / Revenue 34% 36%
Net profitability = Net Profit / Revenue 16% 17%
Return on assets= Net Profit / Total
Assets
7% 11%
Return on equity= Net Profit / Total
Stockholder equity
14% 17%
Return on invested capital (ROIC)=
EBIT(1-tax)/ Invested capital
10% 14%
These ratios of TPG have deteriorated in 2018 as compared to 2017 as the overall
margins of the firm were affected by the NBN roll-out (Brocklehurst, 2018). Cash return on
sales tells that how much of the company’s sales are getting converted via its cash-flow
from operations. Cash return on sales has reduced from 29% in 2017 to 27% in 2018 as
the company’s margin took a hit as its broadband customers move onto nbn (Watt, 2018).
Similarly, net profitability reduced from 17% in 2018 to 16% in 2017 as TPG’s revenues
increased just by 0.18% year on year as the mark-up on its products might have reduced.
EBITDA margin and operating margin tells the ability of the firm’s core operations to
generate profits but these ratios decreased for TPG in 2018 as compared to 2017 because
there was a decrease in the income from some of the activities and also the operating
costs related to network, carrier and hardware increased during this period. Also, there
was a negative movement in all the return ratios. Return on assets decreased from 11% to
7%, return on equity decreased from 17% to 14% and return on invested capital
decreased from 14% to 10%. The main reason for this fall can be the decrease in the
bottom line of the firm because of the changing business environment of the broadband
market. So, the company generated lower returns for its stakeholders in 2018 as
compared to the previous year.
2.2.2. Efficiency Ratios: These ratios tell how efficient the firm is in using its
resources via the business operations. According to Santosuosso (2014), these ratios
provide investors with rich insight regarding the business operations and financial
performance of the firm.
4
2.2. Analysis of financial ratios
2.2.1. Profitability Ratios: These ratios tell about the firm’s ability to generate profit
from its business operations. The profitability can be measured in relation to the net profit,
operating profit or cash flow from operations (Atrill and McLaney, 2019). The upward trend
in these ratios means a firm profitability is improving and vice-versa.
2018 2017
Cash return on sales = CFO / Revenue 27% 29%
Operating profit margin= Operating
Profit / Revenue
24% 26%
EBITDA margin = EBIDTA / Revenue 34% 36%
Net profitability = Net Profit / Revenue 16% 17%
Return on assets= Net Profit / Total
Assets
7% 11%
Return on equity= Net Profit / Total
Stockholder equity
14% 17%
Return on invested capital (ROIC)=
EBIT(1-tax)/ Invested capital
10% 14%
These ratios of TPG have deteriorated in 2018 as compared to 2017 as the overall
margins of the firm were affected by the NBN roll-out (Brocklehurst, 2018). Cash return on
sales tells that how much of the company’s sales are getting converted via its cash-flow
from operations. Cash return on sales has reduced from 29% in 2017 to 27% in 2018 as
the company’s margin took a hit as its broadband customers move onto nbn (Watt, 2018).
Similarly, net profitability reduced from 17% in 2018 to 16% in 2017 as TPG’s revenues
increased just by 0.18% year on year as the mark-up on its products might have reduced.
EBITDA margin and operating margin tells the ability of the firm’s core operations to
generate profits but these ratios decreased for TPG in 2018 as compared to 2017 because
there was a decrease in the income from some of the activities and also the operating
costs related to network, carrier and hardware increased during this period. Also, there
was a negative movement in all the return ratios. Return on assets decreased from 11% to
7%, return on equity decreased from 17% to 14% and return on invested capital
decreased from 14% to 10%. The main reason for this fall can be the decrease in the
bottom line of the firm because of the changing business environment of the broadband
market. So, the company generated lower returns for its stakeholders in 2018 as
compared to the previous year.
2.2.2. Efficiency Ratios: These ratios tell how efficient the firm is in using its
resources via the business operations. According to Santosuosso (2014), these ratios
provide investors with rich insight regarding the business operations and financial
performance of the firm.
4
Paraphrase This Document
Need a fresh take? Get an instant paraphrase of this document with our AI Paraphraser
Business Finance
2018 2017
Inventory Turnover Ratio = Cost of
Sales/Inventory
NA NA
Days Inventory in hand = Days in period
(365)/ Inventory turnover ratio
NA NA
Receivables Turnover = Net
Revenues/Trade receivables 19.33
times
18.93
times
Days receivables = Days in period (365)/
Receivables turnover ratio 18.88
days
19.29
days
Payable Turnover = Cost of Sales/Trades
payables 3.84
times
4.16
times
Days of payables = Days in period (365)/
Payables turnover ratio 95.09
days
87.75
days
Total Asset Turnover = Net Revenues/Total
assets 0.46
times
0.64
times
Fixed Asset Turnover = Net Revenues/Total
non-current assets 1.45
times
2.64
times
Cash-flow return on assets = Net cash from
op activities / Total assets 0.13
times
0.18
times
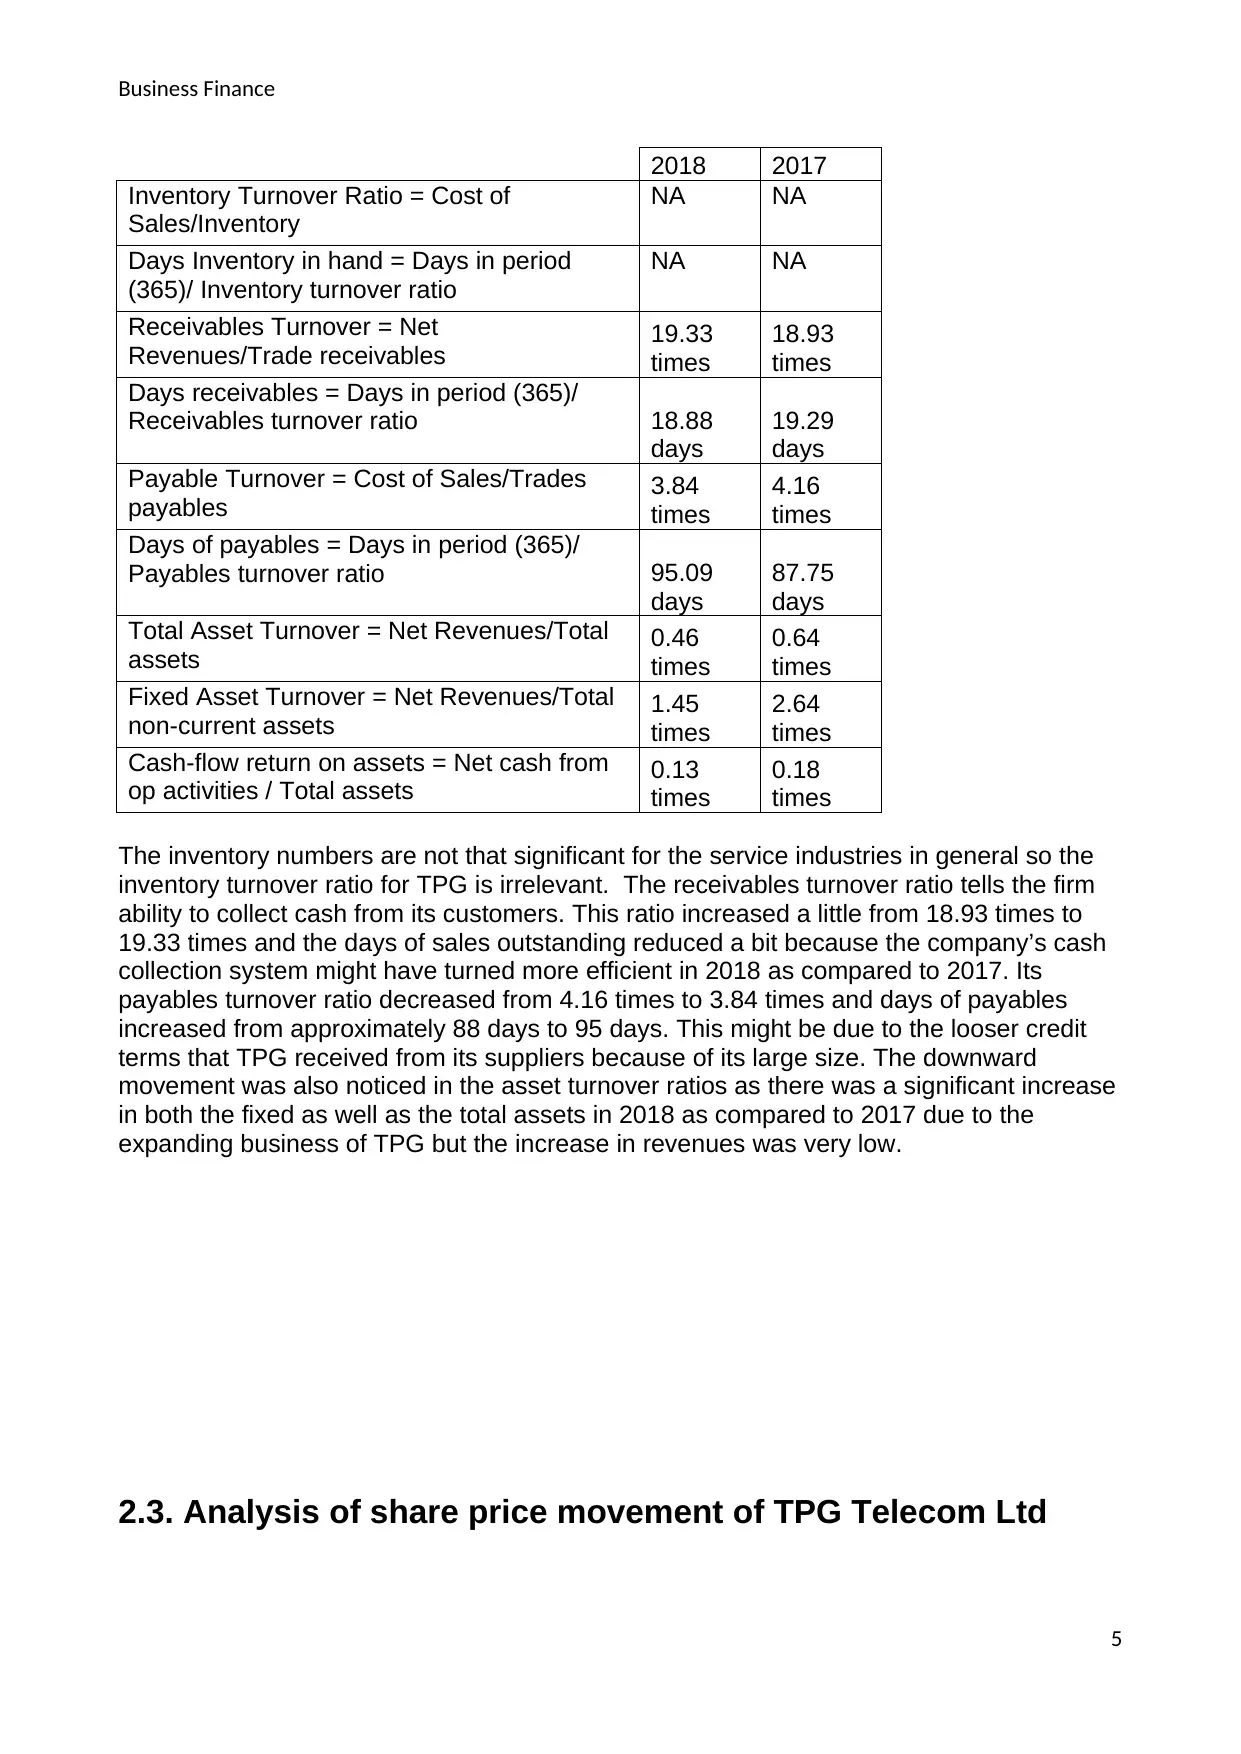
The inventory numbers are not that significant for the service industries in general so the
inventory turnover ratio for TPG is irrelevant. The receivables turnover ratio tells the firm
ability to collect cash from its customers. This ratio increased a little from 18.93 times to
19.33 times and the days of sales outstanding reduced a bit because the company’s cash
collection system might have turned more efficient in 2018 as compared to 2017. Its
payables turnover ratio decreased from 4.16 times to 3.84 times and days of payables
increased from approximately 88 days to 95 days. This might be due to the looser credit
terms that TPG received from its suppliers because of its large size. The downward
movement was also noticed in the asset turnover ratios as there was a significant increase
in both the fixed as well as the total assets in 2018 as compared to 2017 due to the
expanding business of TPG but the increase in revenues was very low.
2.3. Analysis of share price movement of TPG Telecom Ltd
5
2018 2017
Inventory Turnover Ratio = Cost of
Sales/Inventory
NA NA
Days Inventory in hand = Days in period
(365)/ Inventory turnover ratio
NA NA
Receivables Turnover = Net
Revenues/Trade receivables 19.33
times
18.93
times
Days receivables = Days in period (365)/
Receivables turnover ratio 18.88
days
19.29
days
Payable Turnover = Cost of Sales/Trades
payables 3.84
times
4.16
times
Days of payables = Days in period (365)/
Payables turnover ratio 95.09
days
87.75
days
Total Asset Turnover = Net Revenues/Total
assets 0.46
times
0.64
times
Fixed Asset Turnover = Net Revenues/Total
non-current assets 1.45
times
2.64
times
Cash-flow return on assets = Net cash from
op activities / Total assets 0.13
times
0.18
times
The inventory numbers are not that significant for the service industries in general so the
inventory turnover ratio for TPG is irrelevant. The receivables turnover ratio tells the firm
ability to collect cash from its customers. This ratio increased a little from 18.93 times to
19.33 times and the days of sales outstanding reduced a bit because the company’s cash
collection system might have turned more efficient in 2018 as compared to 2017. Its
payables turnover ratio decreased from 4.16 times to 3.84 times and days of payables
increased from approximately 88 days to 95 days. This might be due to the looser credit
terms that TPG received from its suppliers because of its large size. The downward
movement was also noticed in the asset turnover ratios as there was a significant increase
in both the fixed as well as the total assets in 2018 as compared to 2017 due to the
expanding business of TPG but the increase in revenues was very low.
2.3. Analysis of share price movement of TPG Telecom Ltd
5
Business Finance
April-2017
May-2017
June-2017
July-2017
August-2017
September-2017
October-2017
November-2017
December-2017
January-2018
February-2018
March-2018
April-2018
May-2018
June-2018
July-2018
August-2018
September-2018
October-2018
November-2018
December-2018
January-2019
February-2019
March-2019
April-2019
5,200.00
5,400.00
5,600.00
5,800.00
6,000.00
6,200.00
6,400.00
6,600.00
0
1
2
3
4
5
6
7
8
9
10
Historical Monthly TPM Prices vs Historical Monthly
XAO Prices
XAO
TPM
Axis Title
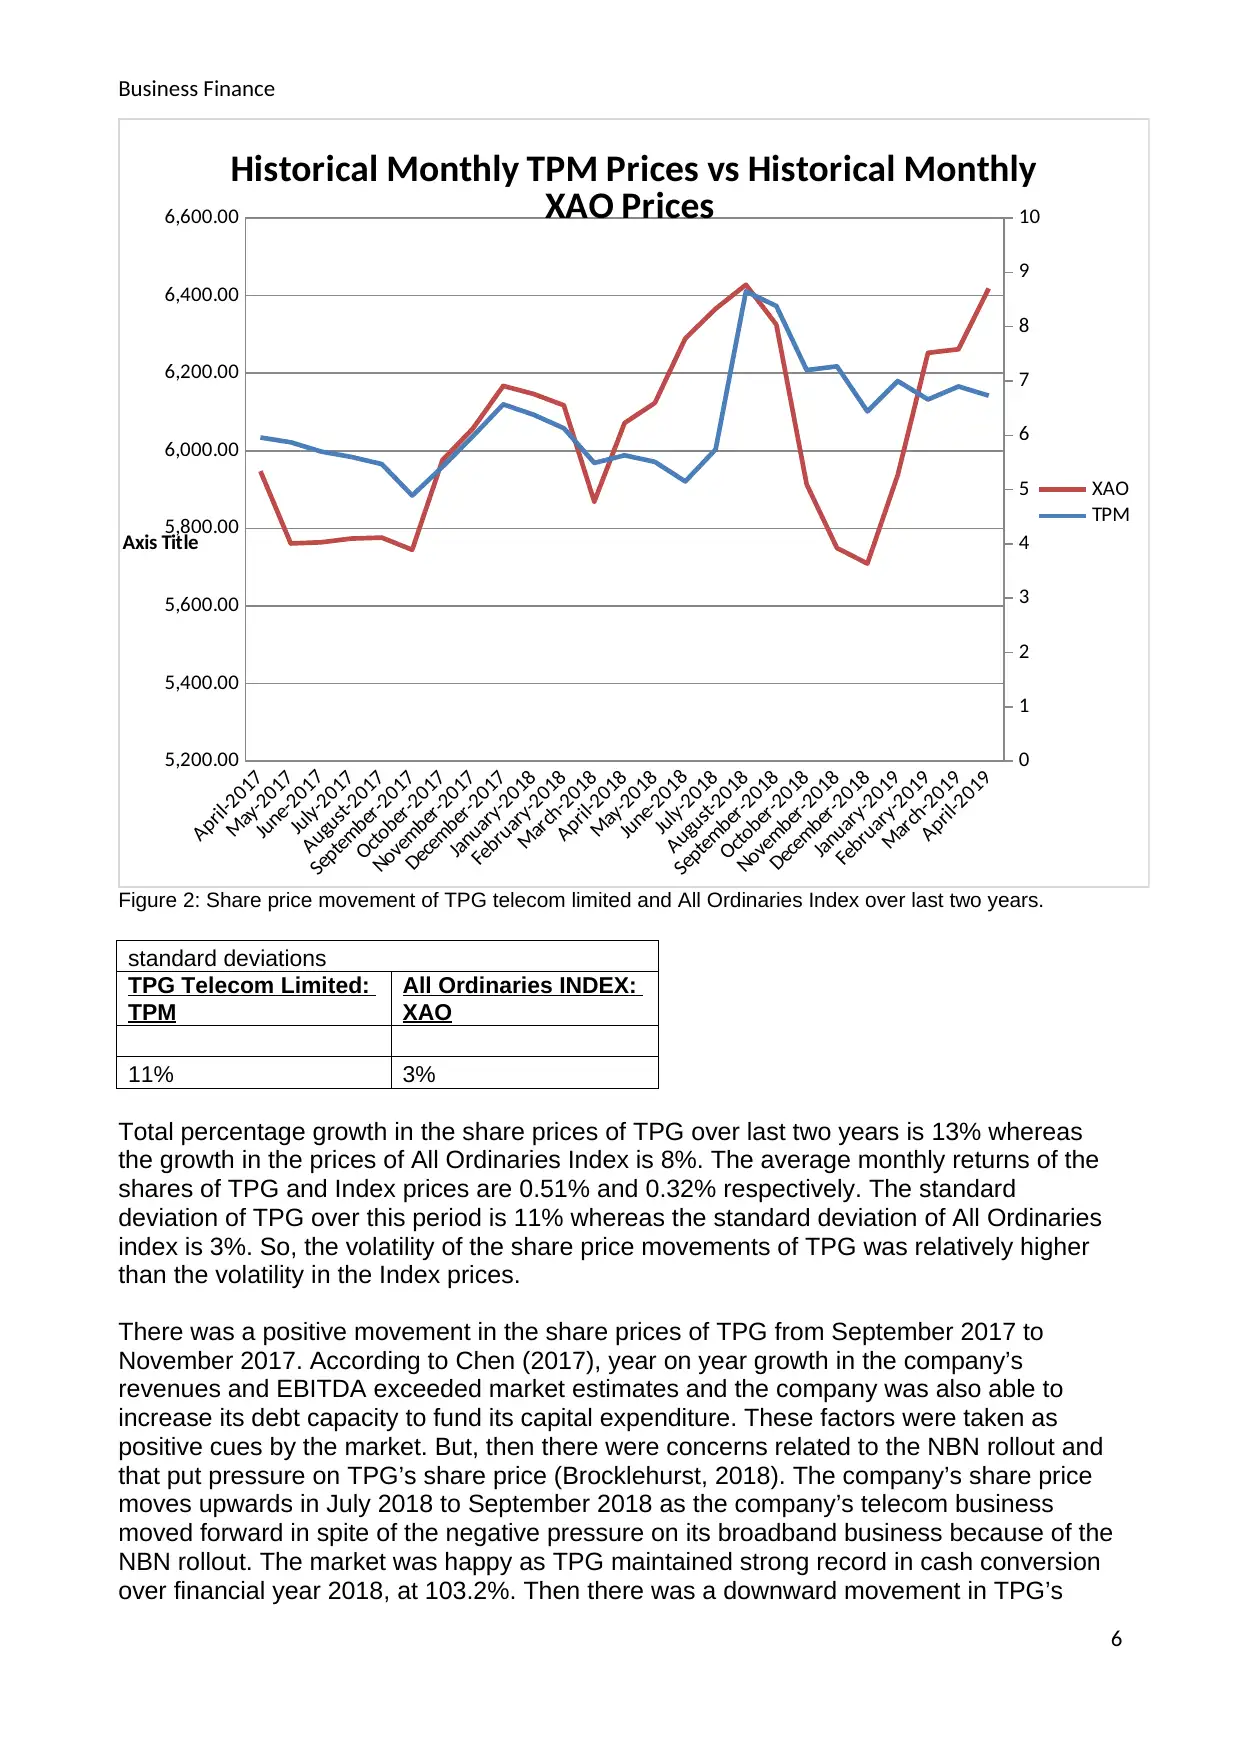
Figure 2: Share price movement of TPG telecom limited and All Ordinaries Index over last two years.
standard deviations
TPG Telecom Limited:
TPM
All Ordinaries INDEX:
XAO
11% 3%
Total percentage growth in the share prices of TPG over last two years is 13% whereas
the growth in the prices of All Ordinaries Index is 8%. The average monthly returns of the
shares of TPG and Index prices are 0.51% and 0.32% respectively. The standard
deviation of TPG over this period is 11% whereas the standard deviation of All Ordinaries
index is 3%. So, the volatility of the share price movements of TPG was relatively higher
than the volatility in the Index prices.
There was a positive movement in the share prices of TPG from September 2017 to
November 2017. According to Chen (2017), year on year growth in the company’s
revenues and EBITDA exceeded market estimates and the company was also able to
increase its debt capacity to fund its capital expenditure. These factors were taken as
positive cues by the market. But, then there were concerns related to the NBN rollout and
that put pressure on TPG’s share price (Brocklehurst, 2018). The company’s share price
moves upwards in July 2018 to September 2018 as the company’s telecom business
moved forward in spite of the negative pressure on its broadband business because of the
NBN rollout. The market was happy as TPG maintained strong record in cash conversion
over financial year 2018, at 103.2%. Then there was a downward movement in TPG’s
6
April-2017
May-2017
June-2017
July-2017
August-2017
September-2017
October-2017
November-2017
December-2017
January-2018
February-2018
March-2018
April-2018
May-2018
June-2018
July-2018
August-2018
September-2018
October-2018
November-2018
December-2018
January-2019
February-2019
March-2019
April-2019
5,200.00
5,400.00
5,600.00
5,800.00
6,000.00
6,200.00
6,400.00
6,600.00
0
1
2
3
4
5
6
7
8
9
10
Historical Monthly TPM Prices vs Historical Monthly
XAO Prices
XAO
TPM
Axis Title
Figure 2: Share price movement of TPG telecom limited and All Ordinaries Index over last two years.
standard deviations
TPG Telecom Limited:
TPM
All Ordinaries INDEX:
XAO
11% 3%
Total percentage growth in the share prices of TPG over last two years is 13% whereas
the growth in the prices of All Ordinaries Index is 8%. The average monthly returns of the
shares of TPG and Index prices are 0.51% and 0.32% respectively. The standard
deviation of TPG over this period is 11% whereas the standard deviation of All Ordinaries
index is 3%. So, the volatility of the share price movements of TPG was relatively higher
than the volatility in the Index prices.
There was a positive movement in the share prices of TPG from September 2017 to
November 2017. According to Chen (2017), year on year growth in the company’s
revenues and EBITDA exceeded market estimates and the company was also able to
increase its debt capacity to fund its capital expenditure. These factors were taken as
positive cues by the market. But, then there were concerns related to the NBN rollout and
that put pressure on TPG’s share price (Brocklehurst, 2018). The company’s share price
moves upwards in July 2018 to September 2018 as the company’s telecom business
moved forward in spite of the negative pressure on its broadband business because of the
NBN rollout. The market was happy as TPG maintained strong record in cash conversion
over financial year 2018, at 103.2%. Then there was a downward movement in TPG’s
6
Business Finance
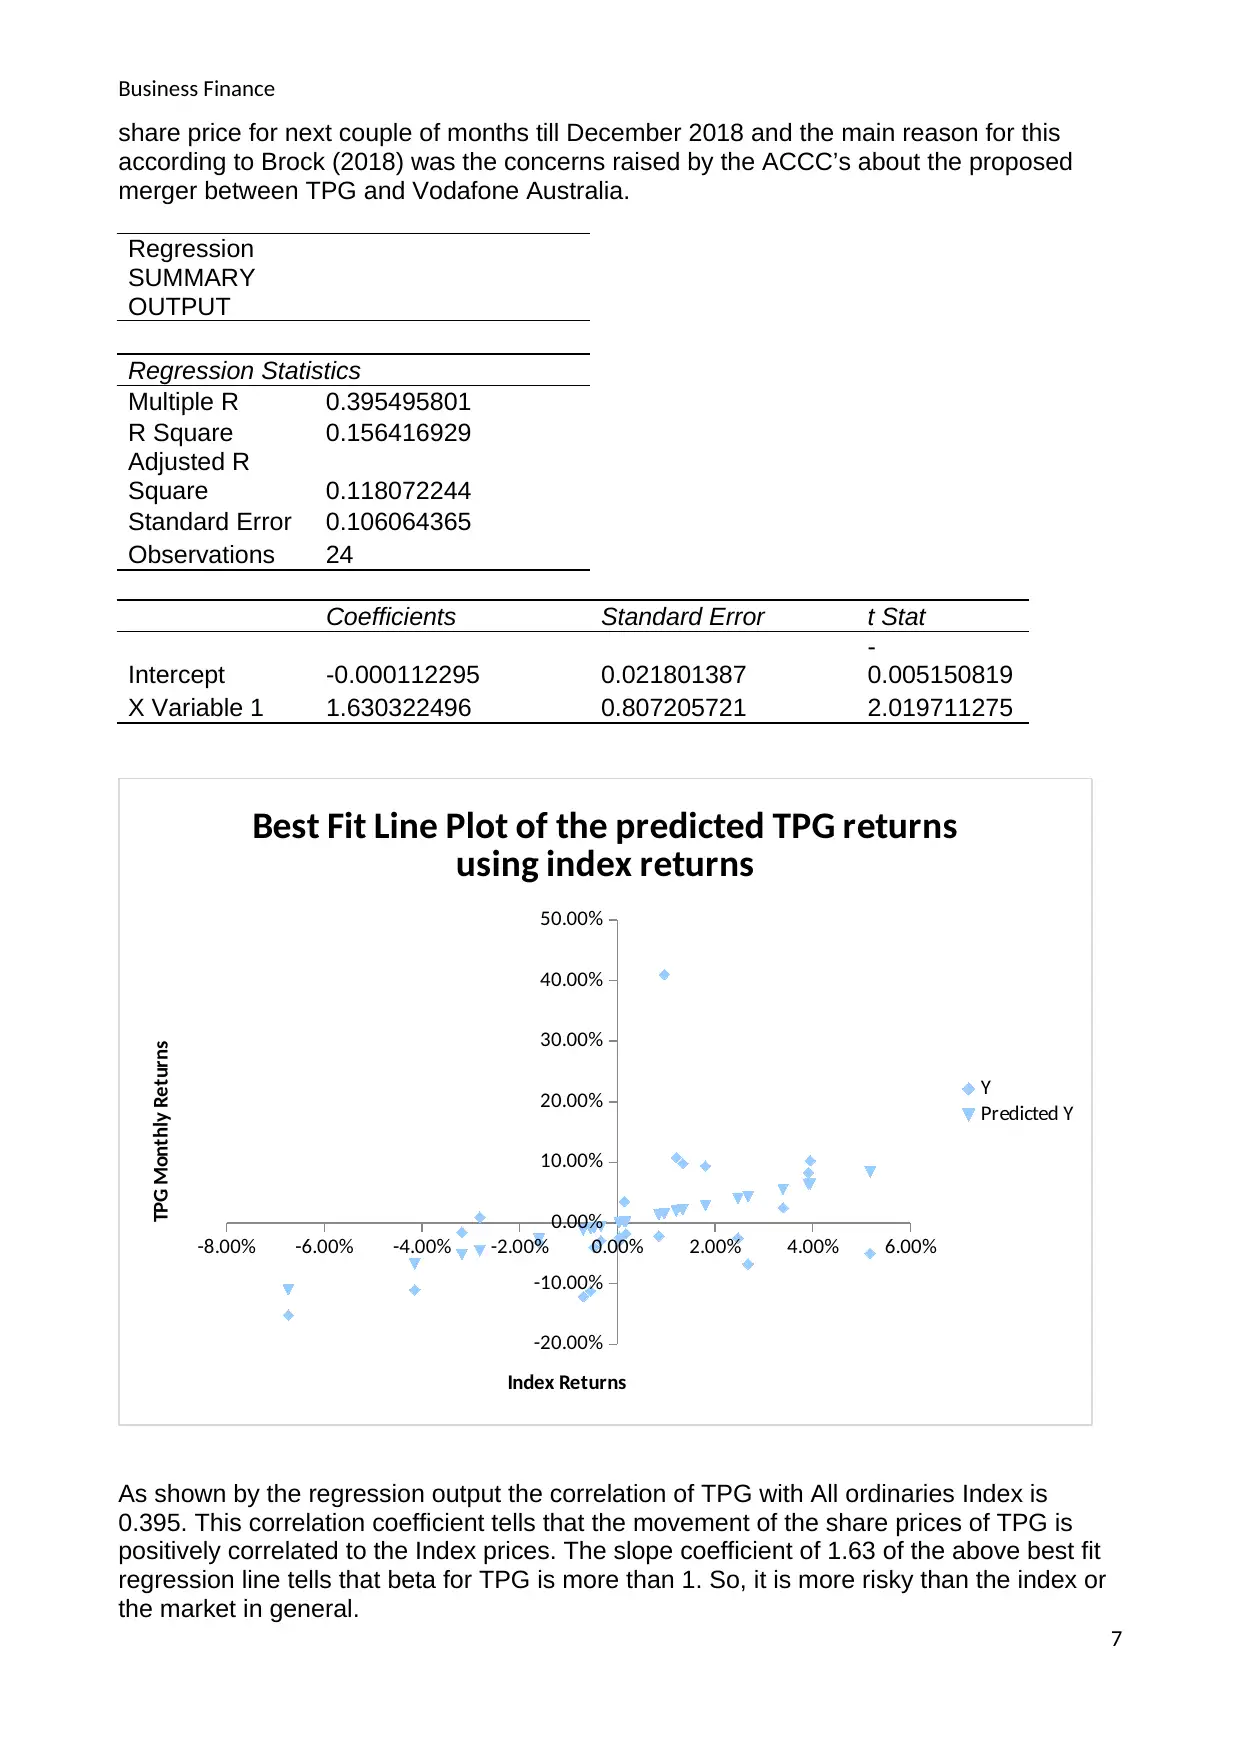
share price for next couple of months till December 2018 and the main reason for this
according to Brock (2018) was the concerns raised by the ACCC’s about the proposed
merger between TPG and Vodafone Australia.
Regression
SUMMARY
OUTPUT
Regression Statistics
Multiple R 0.395495801
R Square 0.156416929
Adjusted R
Square 0.118072244
Standard Error 0.106064365
Observations 24
Coefficients Standard Error t Stat
Intercept -0.000112295 0.021801387
-
0.005150819
X Variable 1 1.630322496 0.807205721 2.019711275
-8.00% -6.00% -4.00% -2.00% 0.00% 2.00% 4.00% 6.00%
-20.00%
-10.00%
0.00%
10.00%
20.00%
30.00%
40.00%
50.00%
Best Fit Line Plot of the predicted TPG returns
using index returns
Y
Predicted Y
Index Returns
TPG Monthly Returns
As shown by the regression output the correlation of TPG with All ordinaries Index is
0.395. This correlation coefficient tells that the movement of the share prices of TPG is
positively correlated to the Index prices. The slope coefficient of 1.63 of the above best fit
regression line tells that beta for TPG is more than 1. So, it is more risky than the index or
the market in general.
7
Secure Best Marks with AI Grader
Need help grading? Try our AI Grader for instant feedback on your assignments.
Business Finance
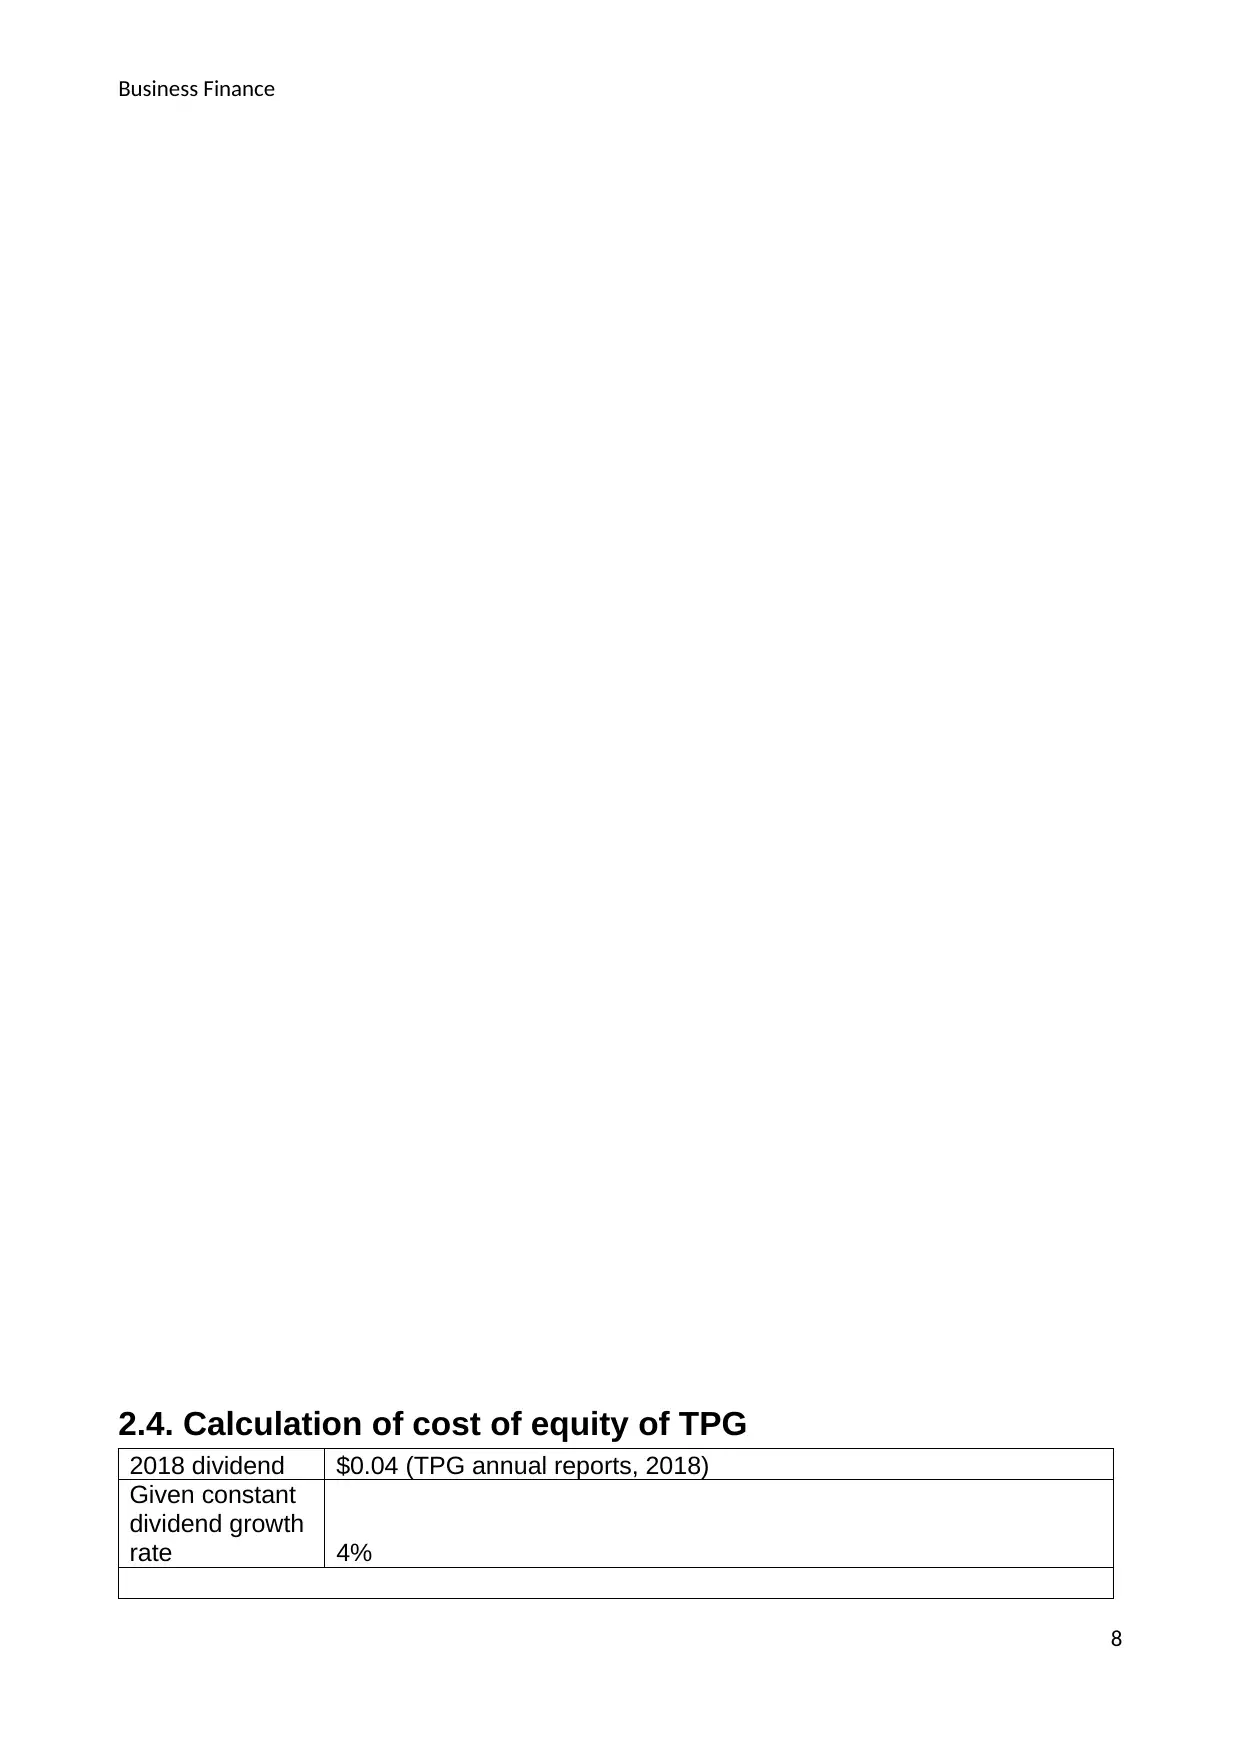
2.4. Calculation of cost of equity of TPG
2018 dividend $0.04 (TPG annual reports, 2018)
Given constant
dividend growth
rate 4%
8
2.4. Calculation of cost of equity of TPG
2018 dividend $0.04 (TPG annual reports, 2018)
Given constant
dividend growth
rate 4%
8
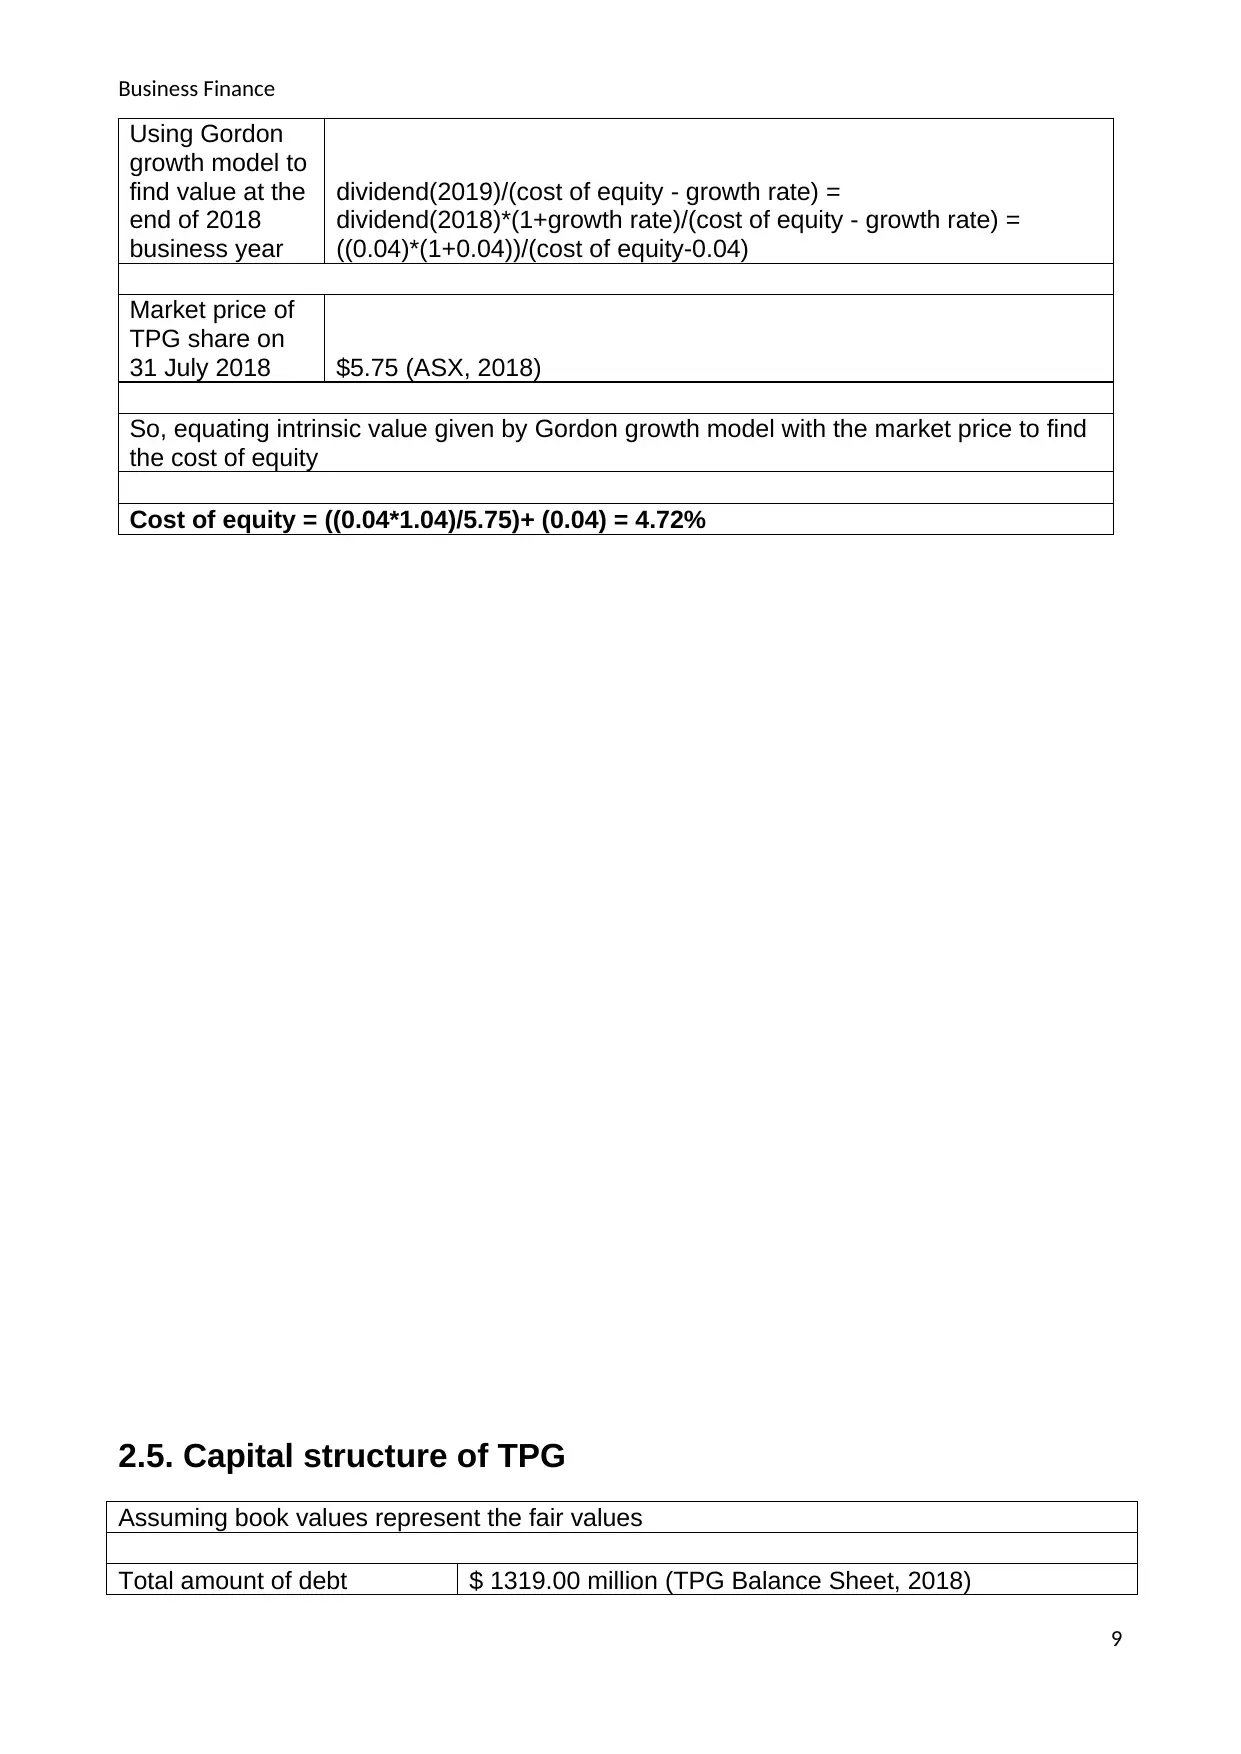
Business Finance
Using Gordon
growth model to
find value at the
end of 2018
business year
dividend(2019)/(cost of equity - growth rate) =
dividend(2018)*(1+growth rate)/(cost of equity - growth rate) =
((0.04)*(1+0.04))/(cost of equity-0.04)
Market price of
TPG share on
31 July 2018 $5.75 (ASX, 2018)
So, equating intrinsic value given by Gordon growth model with the market price to find
the cost of equity
Cost of equity = ((0.04*1.04)/5.75)+ (0.04) = 4.72%
2.5. Capital structure of TPG
Assuming book values represent the fair values
Total amount of debt $ 1319.00 million (TPG Balance Sheet, 2018)
9
Business Finance
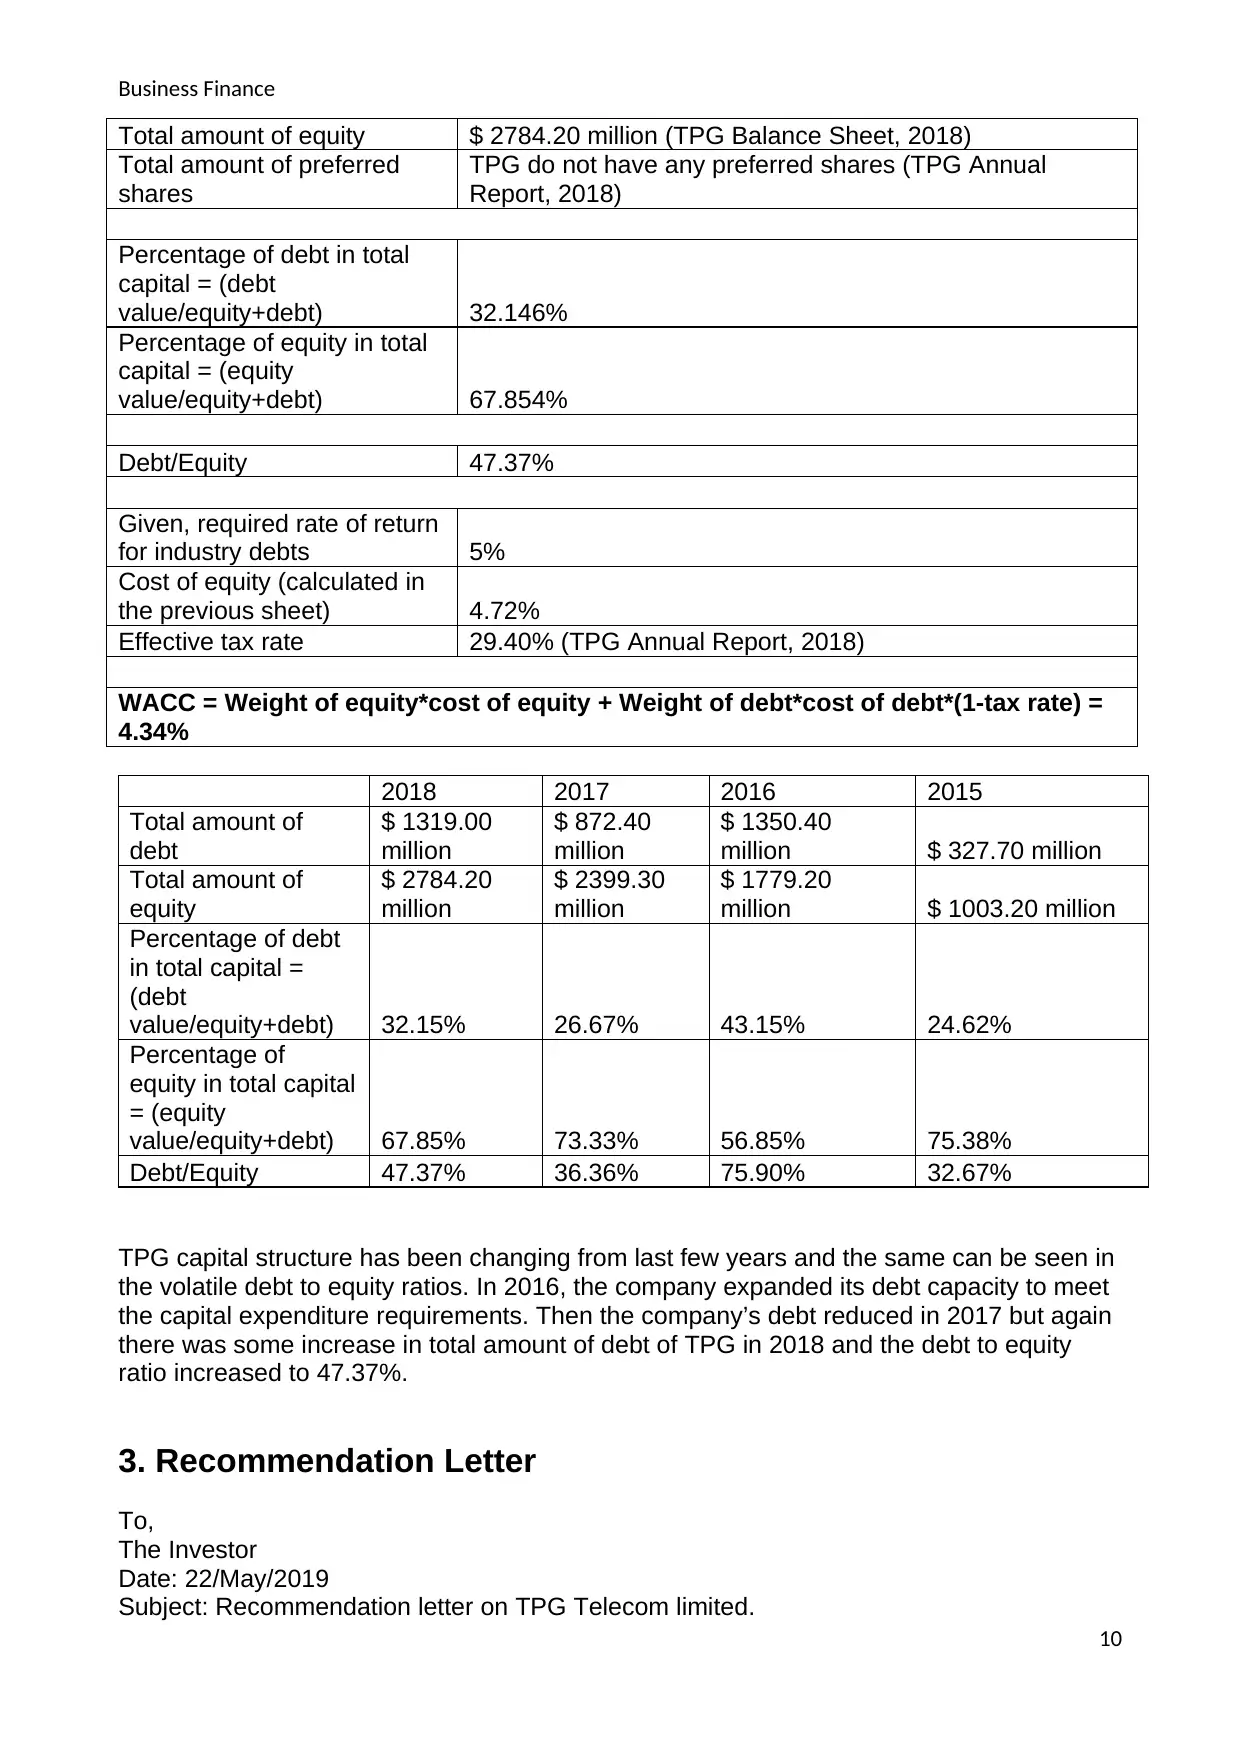
Total amount of equity $ 2784.20 million (TPG Balance Sheet, 2018)
Total amount of preferred
shares
TPG do not have any preferred shares (TPG Annual
Report, 2018)
Percentage of debt in total
capital = (debt
value/equity+debt) 32.146%
Percentage of equity in total
capital = (equity
value/equity+debt) 67.854%
Debt/Equity 47.37%
Given, required rate of return
for industry debts 5%
Cost of equity (calculated in
the previous sheet) 4.72%
Effective tax rate 29.40% (TPG Annual Report, 2018)
WACC = Weight of equity*cost of equity + Weight of debt*cost of debt*(1-tax rate) =
4.34%
2018 2017 2016 2015
Total amount of
debt
$ 1319.00
million
$ 872.40
million
$ 1350.40
million $ 327.70 million
Total amount of
equity
$ 2784.20
million
$ 2399.30
million
$ 1779.20
million $ 1003.20 million
Percentage of debt
in total capital =
(debt
value/equity+debt) 32.15% 26.67% 43.15% 24.62%
Percentage of
equity in total capital
= (equity
value/equity+debt) 67.85% 73.33% 56.85% 75.38%
Debt/Equity 47.37% 36.36% 75.90% 32.67%
TPG capital structure has been changing from last few years and the same can be seen in
the volatile debt to equity ratios. In 2016, the company expanded its debt capacity to meet
the capital expenditure requirements. Then the company’s debt reduced in 2017 but again
there was some increase in total amount of debt of TPG in 2018 and the debt to equity
ratio increased to 47.37%.
3. Recommendation Letter
To,
The Investor
Date: 22/May/2019
Subject: Recommendation letter on TPG Telecom limited.
10
Paraphrase This Document
Need a fresh take? Get an instant paraphrase of this document with our AI Paraphraser
Business Finance
Our firm recommends not investing in TPG as the company’s business has not grown
much in last two years. There has been a negative effect on the TPG’s fixed line
broadband segment due to the NBN roll out and it is expected to hurt the company in
coming times also. So, the company needs to generate more profits from its telecom
business to stay competent.
In last two years TPG’s revenues have grown just by 0.18% per cent from $2490m to
$2495m (TPG annual report, 2018). This tells that the company was not able to expand its
business. The EBITDA margin and operating margin decreased by 2% each during this
time as company’s margins suffered as its broadband customers move onto NBN scheme.
All the other profitability and return ratios like net profit margin, return on assets and return
on equity also decreased in these two years. This downward movement shows that the
firm has not generated higher returns using its business so it does not provide any
confidence in investing in TPG.
The company’s efficiency ratios like asset turnover ratios and cash-flow return on assets
decreased in 2018 as compared to 2017 because the company’s overall business and its
bottom line was affected by the adverse market conditions. So, it can be expected that the
financial performance of BHP will deteriorate further if the firm is unable to use its assets in
an efficient manner in future.
The average monthly returns in the shares of TPG and Index prices are 0.51% and 0.32%
respectively in last two years. The standard deviation of TPG over this period is 11%
whereas the standard deviation of All Ordinaries index is 3%. The volatility of the share
price movements of TPG was relatively higher than the volatility in the Index prices but
TPG’s average monthly returns are not that high. So, this additional risk in TPG has not
been rewarded by the market. There can also be huge negative impacts on the company’s
share performance if the potential merger between TPG and Vodafone Australia does not
happen because of the concerns raised by the ACCC.
Due to the dull financial performance over the last two years and rising uncertainties
regarding firm’s future, our firm does not recommend investing in TPG Telecom Limited.
From,
Financial Advisory Services Firm.
4. Conclusion
11
Business Finance
Based on the financial analysis performed in this report, it is recommended that the
investor should not invest in TPG Telecom Ltd as the company’s financial performance
has been dull for the last two years. The major reason for this is the adverse impact of the
NBN roll on the company’s broadband business. This is represented by the downward
trend in the performance/return ratios and operating efficiency ratios in the last two years.
The analysis of the share price movement of TPG in the last two years has shown that the
volatility of 13% in its share price was higher than the volatility in the index price. But this
increased risk is not appropriately rewarded by the market. TPG’s cost of equity is
calculated at 4.72%, using the Gordon growth model and assuming a constant dividend
growth rate of 4%. The company’s debt to equity ratio was 47.37%. This ratio is used to
calculate the weights of debt and equity in the company’s capital structure. TPG did not
have any preferred shares in its capital structure. So, the firm’s WACC using the cost of
equity of 4.72% and cost of debt of 5%, is calculated at 4.34%. Further evaluation of the
firm’s capital structure gave information about the volatile debt to equity ratio of TPG in last
few years as the company has been adjusting its debt levels according to the required
capital investments.
So, this report does not recommend investing in TPG Telecom Limited as the company’s
weak financial performance does not ignite any confidence in the investors. Also, there is
lot of uncertainty about the company’s future depending upon the fate of potential merger
with Vodafone.
5. References
Atrill, P. & McLaney, E. (2019). Accounting and Finance for Non-Specialists. 11th ed.
Harlow: Pearson.
12
Business Finance
Brock, R. (2018). Is the TPG Telecom share price a buy?. The Motley Fool. Available from:
https://www.fool.com.au/2018/12/18/is-the-tpg-telecom-share-price-a-buy/ [Accessed 22
May 2019].
Brocklehurst, E. (2018). TPG Telecom Relying Heavily On Mobile. FNArena. Available
from: https://www.fnarena.com/index.php/2018/09/19/tpg-telecom-relying-heavily-on-
mobile/ [Accessed 22 May 2019].
Chen, A. (2017). Should you buy TPG Telecom Ltd at this share price?. The Motley Fool.
Available from: https://www.fool.com.au/2017/09/25/should-you-buy-tpg-telecom-ltd-at-
this-share-price/ [Accessed 22 May 2019].
Morningstar. (n.d.). TPG Telecom Ltd. Available from:
https://www.morningstar.com/stocks/xasx/tpm/quote.html [Accessed 22 May 2019].
Raszkiewicz, O. (2017). 4 ways to evaluate TPG Telecom Ltd shares. The Motley Fool.
Available from: https://www.fool.com.au/2017/07/07/4-ways-to-evaluate-tpg-telecom-ltd-
shares/ [Accessed 22 May 2019].
Santosuosso, P. (2014). Do Efficiency Ratios Help Investors to Explore Firm
Performances?. International Business Research. 7(12). pp. 111-119. Available from:
http://www.ccsenet.org/journal/index.php/ibr/article/download/41333/23290 [Accessed 22
May 2019].
TPG. (2018). TPG Annual Report 2018. Available from:
https://www.tpg.com.au/about/pdfs/TPM%20Group%20-%20Statutory%20Accounts%20-
%20FY18v16%20-%20Secure.pdf [Accessed 22 May 2019].
TPG. (n.d.). About TPG. Available from: https://www.tpg.com.au/about/profile.php
[Accessed 22 May 2019].
TPG. (2018). Media Releases. Available from: https://www.tpg.com.au/about/media.php
[Accessed 22 May 2019].
6. Appendices
13
Secure Best Marks with AI Grader
Need help grading? Try our AI Grader for instant feedback on your assignments.

Business Finance
14
14
1 out of 17
Related Documents


Your All-in-One AI-Powered Toolkit for Academic Success.
+13062052269
info@desklib.com
Available 24*7 on WhatsApp / Email
![[object Object]](/_next/static/media/star-bottom.7253800d.svg)
Unlock your academic potential
© 2024 | Zucol Services PVT LTD | All rights reserved.