Business Finance Report: Risk Analysis, Return, and CAPM Modeling
VerifiedAdded on 2023/06/06
|10
|2485
|80
Report
AI Summary
This report provides a comprehensive analysis of business finance principles, focusing on risk and return assessment and capital budgeting techniques. Part A delves into risk and return calculations, including continuously compounded monthly returns for stocks and market indices, correlation coeffici...

Running head: BUSINESS FINANCE
Business Finance
Name of the Student:
Name of the University:
Authors Note:
Business Finance
Name of the Student:
Name of the University:
Authors Note:
Paraphrase This Document
Need a fresh take? Get an instant paraphrase of this document with our AI Paraphraser
BUSINESS FINANCE
Table of Contents
Part A: RISK AND RETURN....................................................................................................2
a) Calculating the continuously compounded monthly return of the stock and index:..............2
b) Computing the monthly and yearly returns of the stock and index:......................................3
c) Computing the correlation coefficient between eh stocks and market index:.......................3
d) Suggesting the economic reason behind the correlation, while creating a portfolio which
increases the benefit of diversification:......................................................................................4
e) Calculating return of each stock using CAPM, explaining why the expected return is
different, while detecting whether the stock is undervalued or overvalued:..............................4
Part B: CAPITAL BUDGETING..............................................................................................5
1) Depicting the net initial investment of the project:................................................................5
2.a) Identifying the total cost of the production per year:..........................................................5
2.b) Detecting the annual increment of EBIT:...........................................................................5
2.c) Detecting the annual incremental operating cash flows after tax:......................................5
3.a) Detecting the sale of new building and equipment at the end of year 4:............................6
3.b) Detecting the tax shield received after selling the building at the end of year 4:...............6
3.c) Indicating the capital gain tax if the equipment is sold at the end of year 4:......................6
3.d) Calculating the after tax non-operating cash flows in the terminal year:...........................6
4) Determining whether the project should be accepted using the NPV analysis:....................6
5.a) Performing sensitivity analysis on NPV of the project with sale increase/decrease by
10%:...........................................................................................................................................7
5.b) Performing sensitivity analysis on NPV of the project with cost of capital
increase/decrease by 10%:.........................................................................................................7
Reference and Bibliography:......................................................................................................8
1 | P a g e
BUSINESS FINANCE
Part A: RISK AND RETURN
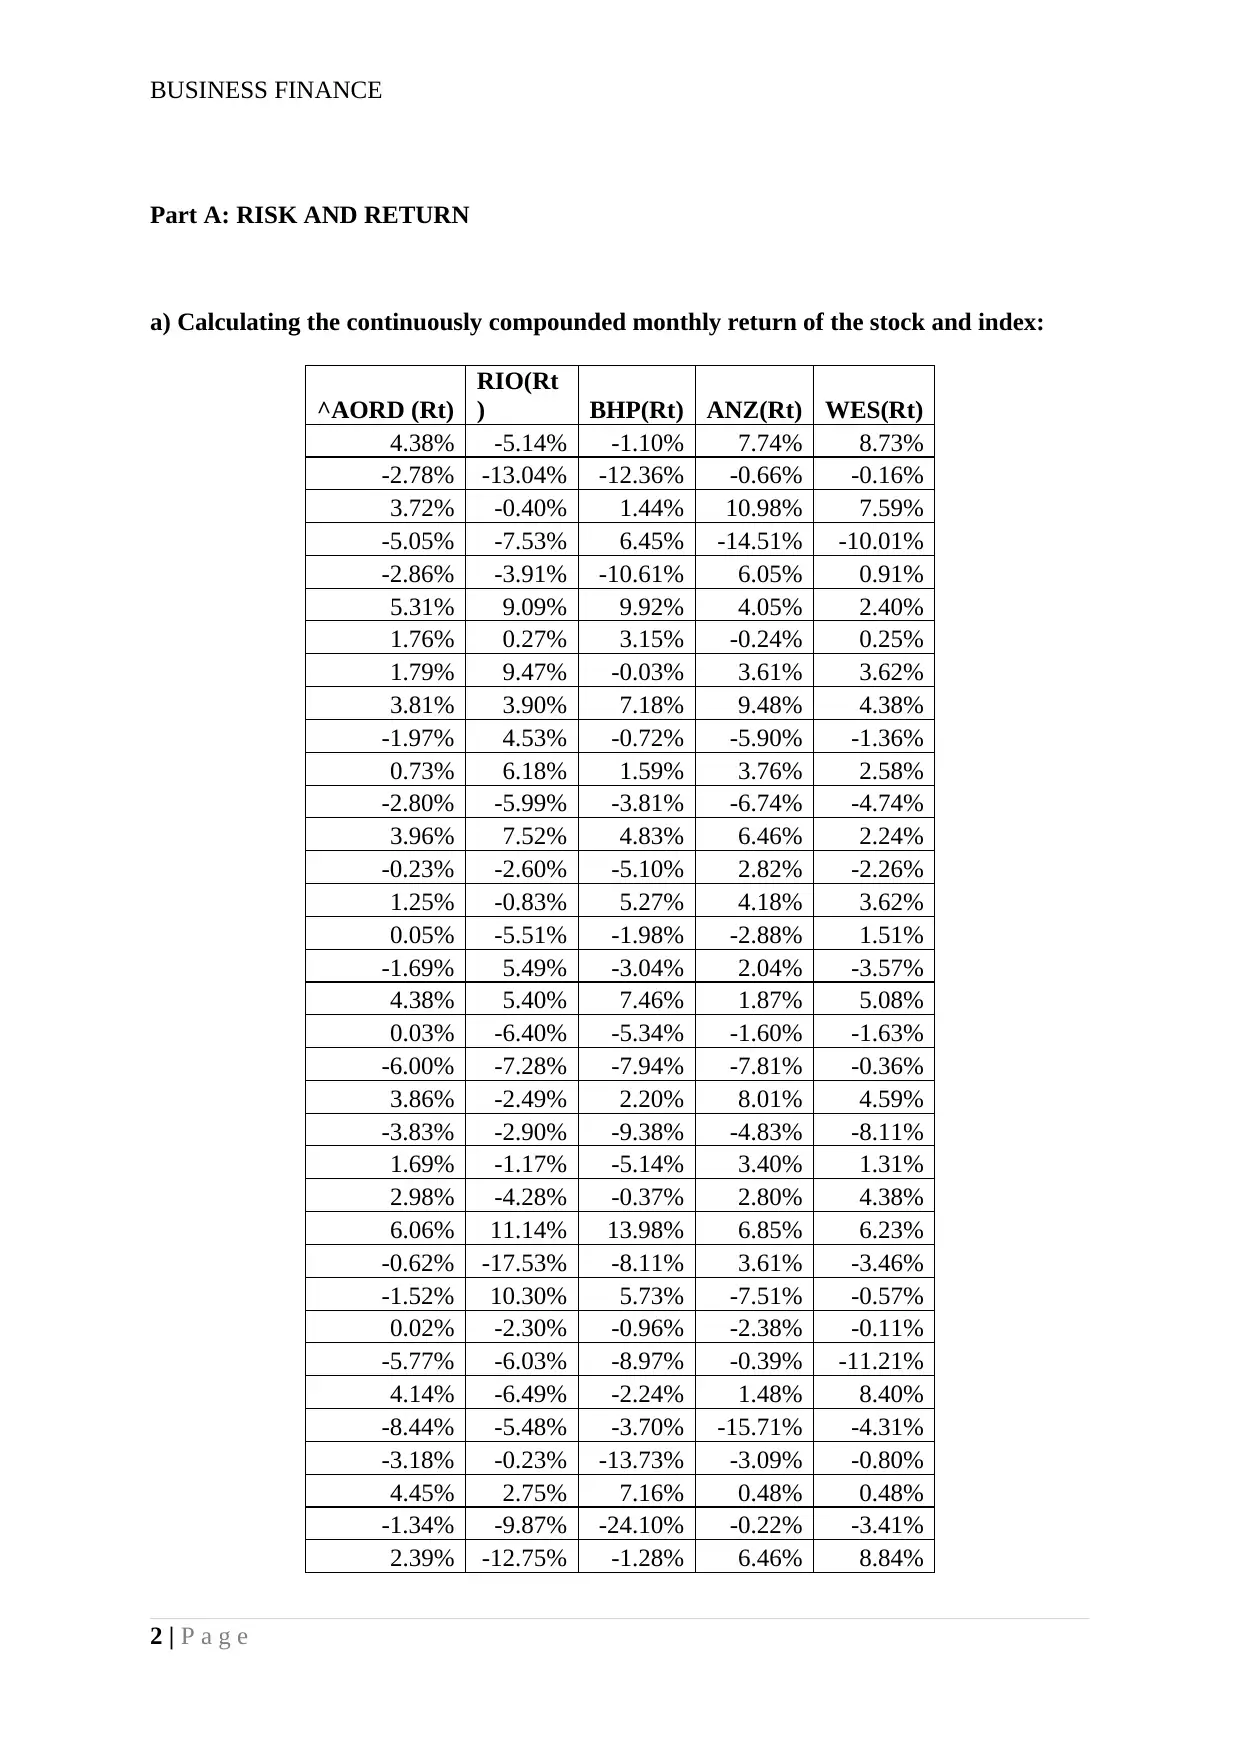
a) Calculating the continuously compounded monthly return of the stock and index:
^AORD (Rt)
RIO(Rt
) BHP(Rt) ANZ(Rt) WES(Rt)
4.38% -5.14% -1.10% 7.74% 8.73%
-2.78% -13.04% -12.36% -0.66% -0.16%
3.72% -0.40% 1.44% 10.98% 7.59%
-5.05% -7.53% 6.45% -14.51% -10.01%
-2.86% -3.91% -10.61% 6.05% 0.91%
5.31% 9.09% 9.92% 4.05% 2.40%
1.76% 0.27% 3.15% -0.24% 0.25%
1.79% 9.47% -0.03% 3.61% 3.62%
3.81% 3.90% 7.18% 9.48% 4.38%
-1.97% 4.53% -0.72% -5.90% -1.36%
0.73% 6.18% 1.59% 3.76% 2.58%
-2.80% -5.99% -3.81% -6.74% -4.74%
3.96% 7.52% 4.83% 6.46% 2.24%
-0.23% -2.60% -5.10% 2.82% -2.26%
1.25% -0.83% 5.27% 4.18% 3.62%
0.05% -5.51% -1.98% -2.88% 1.51%
-1.69% 5.49% -3.04% 2.04% -3.57%
4.38% 5.40% 7.46% 1.87% 5.08%
0.03% -6.40% -5.34% -1.60% -1.63%
-6.00% -7.28% -7.94% -7.81% -0.36%
3.86% -2.49% 2.20% 8.01% 4.59%
-3.83% -2.90% -9.38% -4.83% -8.11%
1.69% -1.17% -5.14% 3.40% 1.31%
2.98% -4.28% -0.37% 2.80% 4.38%
6.06% 11.14% 13.98% 6.85% 6.23%
-0.62% -17.53% -8.11% 3.61% -3.46%
-1.52% 10.30% 5.73% -7.51% -0.57%
0.02% -2.30% -0.96% -2.38% -0.11%
-5.77% -6.03% -8.97% -0.39% -11.21%
4.14% -6.49% -2.24% 1.48% 8.40%
-8.44% -5.48% -3.70% -15.71% -4.31%
-3.18% -0.23% -13.73% -3.09% -0.80%
4.45% 2.75% 7.16% 0.48% 0.48%
-1.34% -9.87% -24.10% -0.22% -3.41%
2.39% -12.75% -1.28% 6.46% 8.84%
2 | P a g e
Part A: RISK AND RETURN
a) Calculating the continuously compounded monthly return of the stock and index:
^AORD (Rt)
RIO(Rt
) BHP(Rt) ANZ(Rt) WES(Rt)
4.38% -5.14% -1.10% 7.74% 8.73%
-2.78% -13.04% -12.36% -0.66% -0.16%
3.72% -0.40% 1.44% 10.98% 7.59%
-5.05% -7.53% 6.45% -14.51% -10.01%
-2.86% -3.91% -10.61% 6.05% 0.91%
5.31% 9.09% 9.92% 4.05% 2.40%
1.76% 0.27% 3.15% -0.24% 0.25%
1.79% 9.47% -0.03% 3.61% 3.62%
3.81% 3.90% 7.18% 9.48% 4.38%
-1.97% 4.53% -0.72% -5.90% -1.36%
0.73% 6.18% 1.59% 3.76% 2.58%
-2.80% -5.99% -3.81% -6.74% -4.74%
3.96% 7.52% 4.83% 6.46% 2.24%
-0.23% -2.60% -5.10% 2.82% -2.26%
1.25% -0.83% 5.27% 4.18% 3.62%
0.05% -5.51% -1.98% -2.88% 1.51%
-1.69% 5.49% -3.04% 2.04% -3.57%
4.38% 5.40% 7.46% 1.87% 5.08%
0.03% -6.40% -5.34% -1.60% -1.63%
-6.00% -7.28% -7.94% -7.81% -0.36%
3.86% -2.49% 2.20% 8.01% 4.59%
-3.83% -2.90% -9.38% -4.83% -8.11%
1.69% -1.17% -5.14% 3.40% 1.31%
2.98% -4.28% -0.37% 2.80% 4.38%
6.06% 11.14% 13.98% 6.85% 6.23%
-0.62% -17.53% -8.11% 3.61% -3.46%
-1.52% 10.30% 5.73% -7.51% -0.57%
0.02% -2.30% -0.96% -2.38% -0.11%
-5.77% -6.03% -8.97% -0.39% -11.21%
4.14% -6.49% -2.24% 1.48% 8.40%
-8.44% -5.48% -3.70% -15.71% -4.31%
-3.18% -0.23% -13.73% -3.09% -0.80%
4.45% 2.75% 7.16% 0.48% 0.48%
-1.34% -9.87% -24.10% -0.22% -3.41%
2.39% -12.75% -1.28% 6.46% 8.84%
2 | P a g e
⊘ This is a preview!⊘
Do you want full access?
Subscribe today to unlock all pages.
Trusted by 1+ million students worldwide
BUSINESS FINANCE
-5.54% -16.66% -15.14% -14.42% 1.34%
-2.17% 5.72% 1.42% -7.65% -7.58%
4.04% 11.87% 7.96% 4.62% 8.14%
3.14% 17.45% 21.63% 3.39% 3.13%
2.45% -18.27% -8.05% 4.87% -5.13%
-2.55% 11.00% -2.28% -2.25% -1.31%
6.09% 4.74% 4.56% 6.89% 6.82%
-2.05% -8.42% 4.56% 4.02% -1.15%
-0.08% 11.54% 9.12% 2.68% 6.00%
-2.25% 4.25% 3.95% 0.79% -7.26%
1.83% 8.42% 5.65% 1.99% 1.86%
3.86% 1.44% 2.63% 9.70% 0.86%
-0.77% 15.24% 6.11% -3.79% -4.56%
1.50% -7.58% -6.35% 5.35% 5.93%
2.45% 0.72% -3.92% 2.93% 7.77%
0.74% -2.14% 0.79% 2.91% -4.70%
-3.18% 1.22% 0.76% -15.66% -0.70%
0.05% 4.84% -2.63% 5.15% -6.23%
0.17% 11.32% 10.47% 3.12% 1.51%
0.04% 3.53% 5.75% -0.78% 4.54%
-0.55% -1.57% -6.02% 0.68% -0.22%
3.95% 1.56% 4.83% 1.08% 1.13%
1.34% -0.06% 2.82% -5.00% 4.95%
1.80% 9.99% 7.99% 3.65% 1.13%
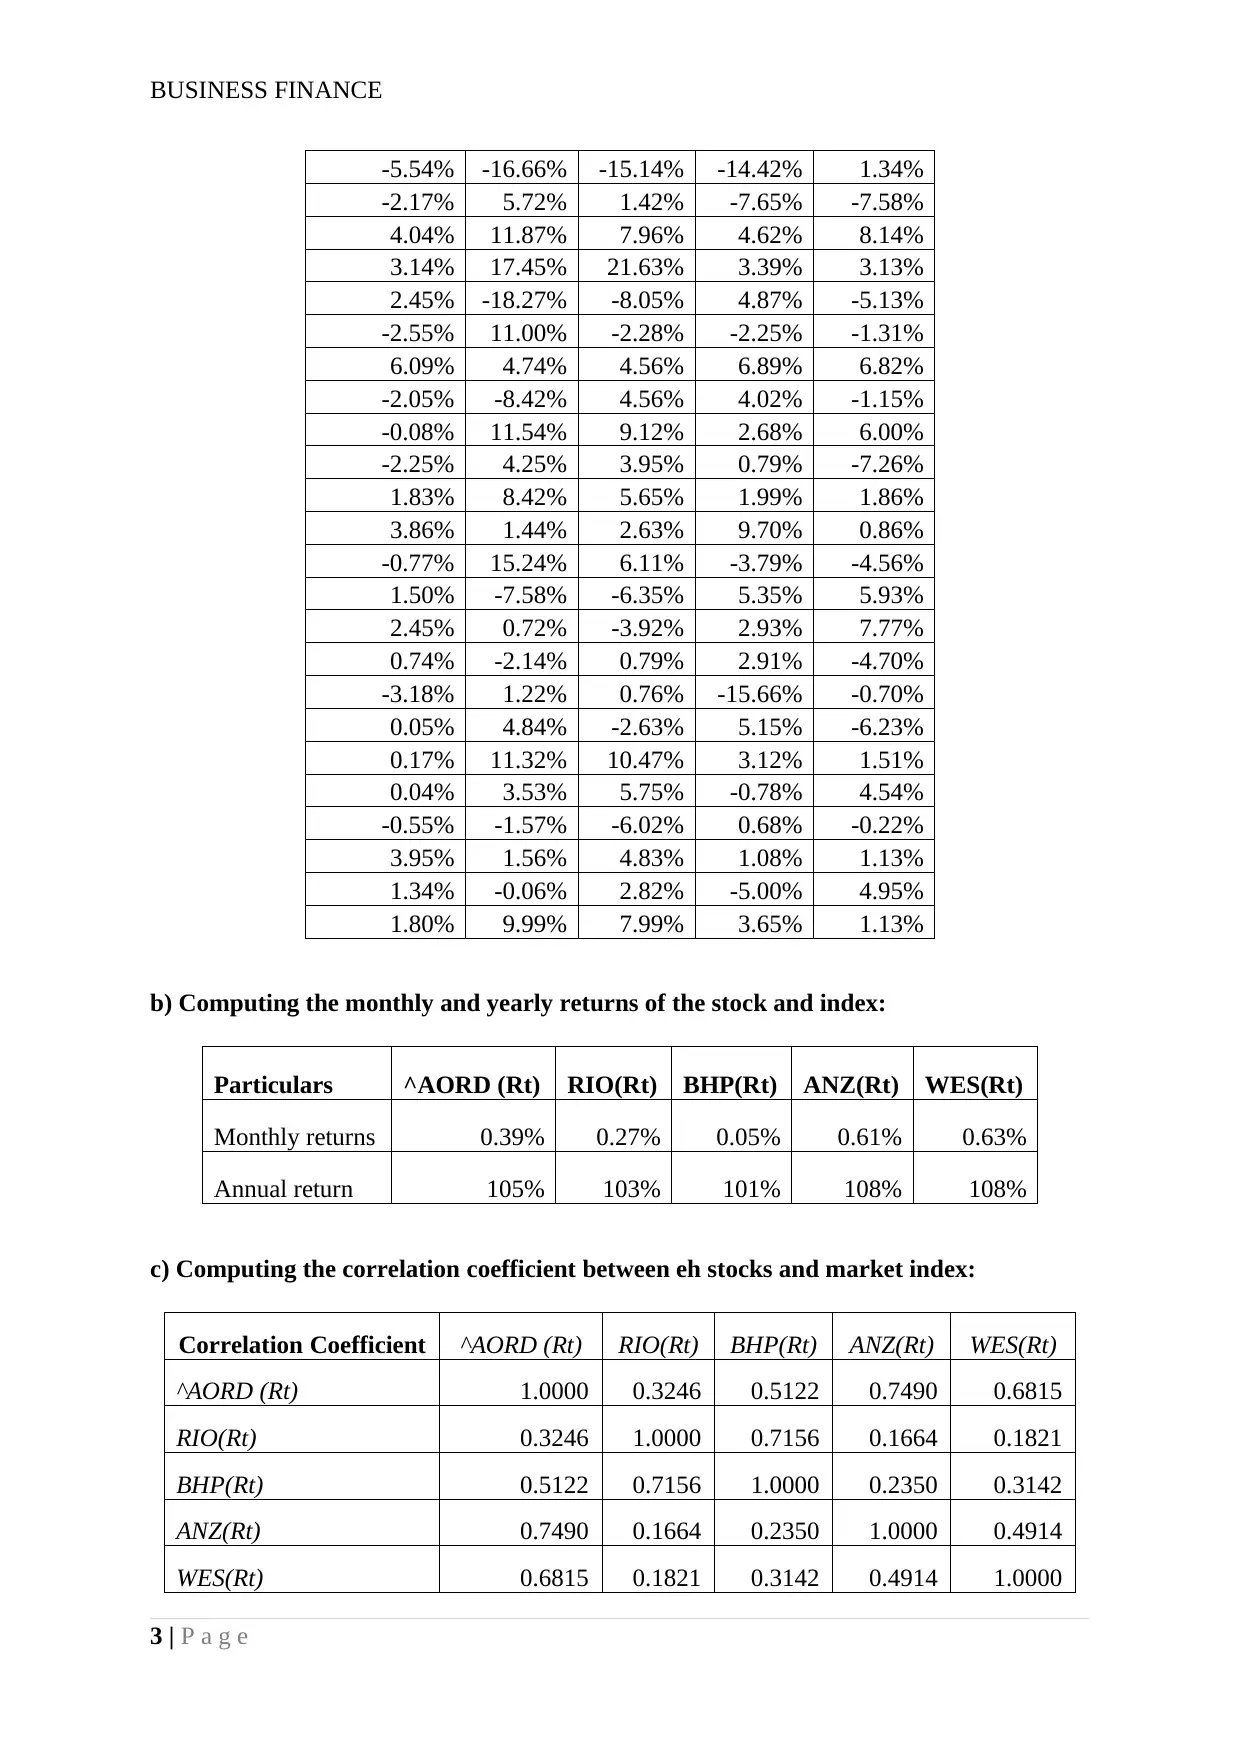
b) Computing the monthly and yearly returns of the stock and index:
Particulars ^AORD (Rt) RIO(Rt) BHP(Rt) ANZ(Rt) WES(Rt)
Monthly returns 0.39% 0.27% 0.05% 0.61% 0.63%
Annual return 105% 103% 101% 108% 108%
c) Computing the correlation coefficient between eh stocks and market index:
Correlation Coefficient ^AORD (Rt) RIO(Rt) BHP(Rt) ANZ(Rt) WES(Rt)
^AORD (Rt) 1.0000 0.3246 0.5122 0.7490 0.6815
RIO(Rt) 0.3246 1.0000 0.7156 0.1664 0.1821
BHP(Rt) 0.5122 0.7156 1.0000 0.2350 0.3142
ANZ(Rt) 0.7490 0.1664 0.2350 1.0000 0.4914
WES(Rt) 0.6815 0.1821 0.3142 0.4914 1.0000
3 | P a g e
-5.54% -16.66% -15.14% -14.42% 1.34%
-2.17% 5.72% 1.42% -7.65% -7.58%
4.04% 11.87% 7.96% 4.62% 8.14%
3.14% 17.45% 21.63% 3.39% 3.13%
2.45% -18.27% -8.05% 4.87% -5.13%
-2.55% 11.00% -2.28% -2.25% -1.31%
6.09% 4.74% 4.56% 6.89% 6.82%
-2.05% -8.42% 4.56% 4.02% -1.15%
-0.08% 11.54% 9.12% 2.68% 6.00%
-2.25% 4.25% 3.95% 0.79% -7.26%
1.83% 8.42% 5.65% 1.99% 1.86%
3.86% 1.44% 2.63% 9.70% 0.86%
-0.77% 15.24% 6.11% -3.79% -4.56%
1.50% -7.58% -6.35% 5.35% 5.93%
2.45% 0.72% -3.92% 2.93% 7.77%
0.74% -2.14% 0.79% 2.91% -4.70%
-3.18% 1.22% 0.76% -15.66% -0.70%
0.05% 4.84% -2.63% 5.15% -6.23%
0.17% 11.32% 10.47% 3.12% 1.51%
0.04% 3.53% 5.75% -0.78% 4.54%
-0.55% -1.57% -6.02% 0.68% -0.22%
3.95% 1.56% 4.83% 1.08% 1.13%
1.34% -0.06% 2.82% -5.00% 4.95%
1.80% 9.99% 7.99% 3.65% 1.13%
b) Computing the monthly and yearly returns of the stock and index:
Particulars ^AORD (Rt) RIO(Rt) BHP(Rt) ANZ(Rt) WES(Rt)
Monthly returns 0.39% 0.27% 0.05% 0.61% 0.63%
Annual return 105% 103% 101% 108% 108%
c) Computing the correlation coefficient between eh stocks and market index:
Correlation Coefficient ^AORD (Rt) RIO(Rt) BHP(Rt) ANZ(Rt) WES(Rt)
^AORD (Rt) 1.0000 0.3246 0.5122 0.7490 0.6815
RIO(Rt) 0.3246 1.0000 0.7156 0.1664 0.1821
BHP(Rt) 0.5122 0.7156 1.0000 0.2350 0.3142
ANZ(Rt) 0.7490 0.1664 0.2350 1.0000 0.4914
WES(Rt) 0.6815 0.1821 0.3142 0.4914 1.0000
3 | P a g e
Paraphrase This Document
Need a fresh take? Get an instant paraphrase of this document with our AI Paraphraser
BUSINESS FINANCE
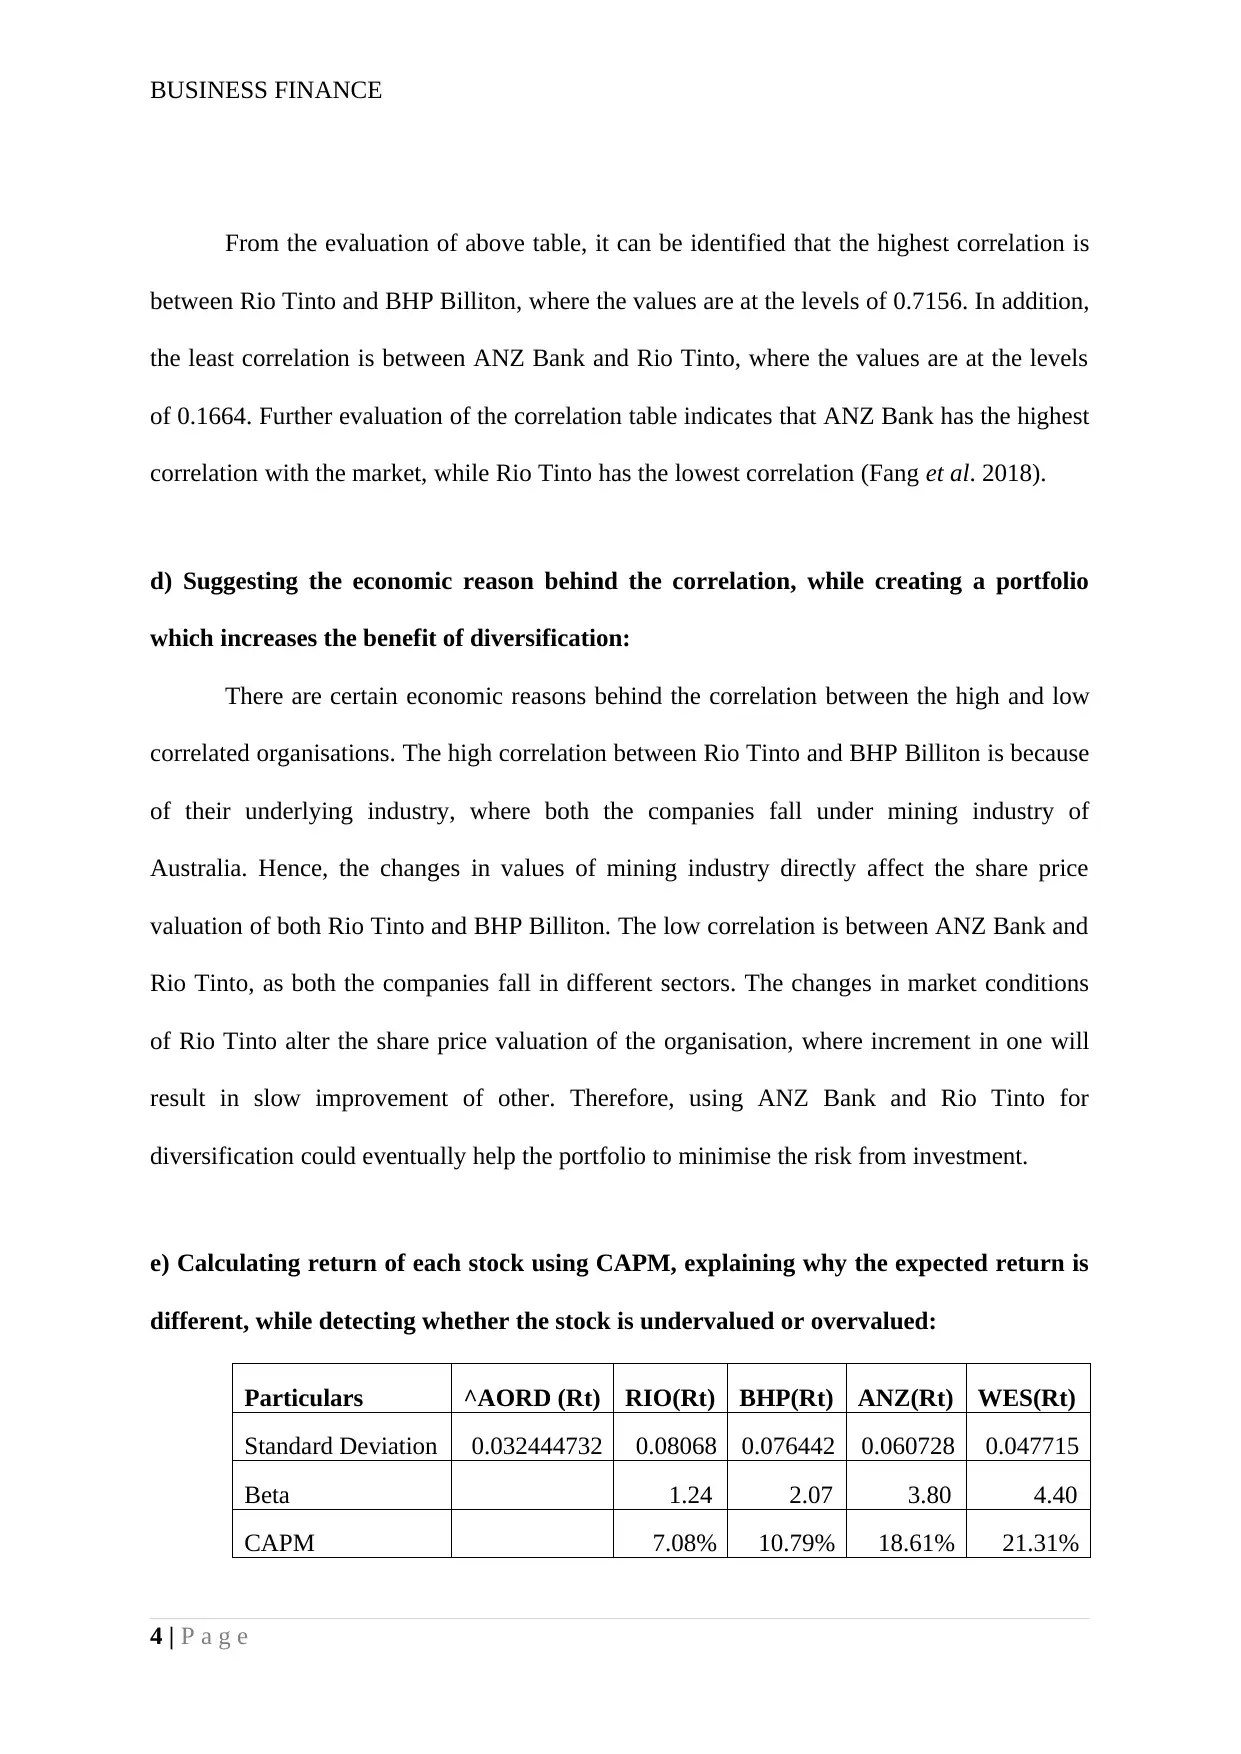
From the evaluation of above table, it can be identified that the highest correlation is
between Rio Tinto and BHP Billiton, where the values are at the levels of 0.7156. In addition,
the least correlation is between ANZ Bank and Rio Tinto, where the values are at the levels
of 0.1664. Further evaluation of the correlation table indicates that ANZ Bank has the highest
correlation with the market, while Rio Tinto has the lowest correlation (Fang et al. 2018).
d) Suggesting the economic reason behind the correlation, while creating a portfolio
which increases the benefit of diversification:
There are certain economic reasons behind the correlation between the high and low
correlated organisations. The high correlation between Rio Tinto and BHP Billiton is because
of their underlying industry, where both the companies fall under mining industry of
Australia. Hence, the changes in values of mining industry directly affect the share price
valuation of both Rio Tinto and BHP Billiton. The low correlation is between ANZ Bank and
Rio Tinto, as both the companies fall in different sectors. The changes in market conditions
of Rio Tinto alter the share price valuation of the organisation, where increment in one will
result in slow improvement of other. Therefore, using ANZ Bank and Rio Tinto for
diversification could eventually help the portfolio to minimise the risk from investment.
e) Calculating return of each stock using CAPM, explaining why the expected return is
different, while detecting whether the stock is undervalued or overvalued:
Particulars ^AORD (Rt) RIO(Rt) BHP(Rt) ANZ(Rt) WES(Rt)
Standard Deviation 0.032444732 0.08068 0.076442 0.060728 0.047715
Beta 1.24 2.07 3.80 4.40
CAPM 7.08% 10.79% 18.61% 21.31%
4 | P a g e
BUSINESS FINANCE
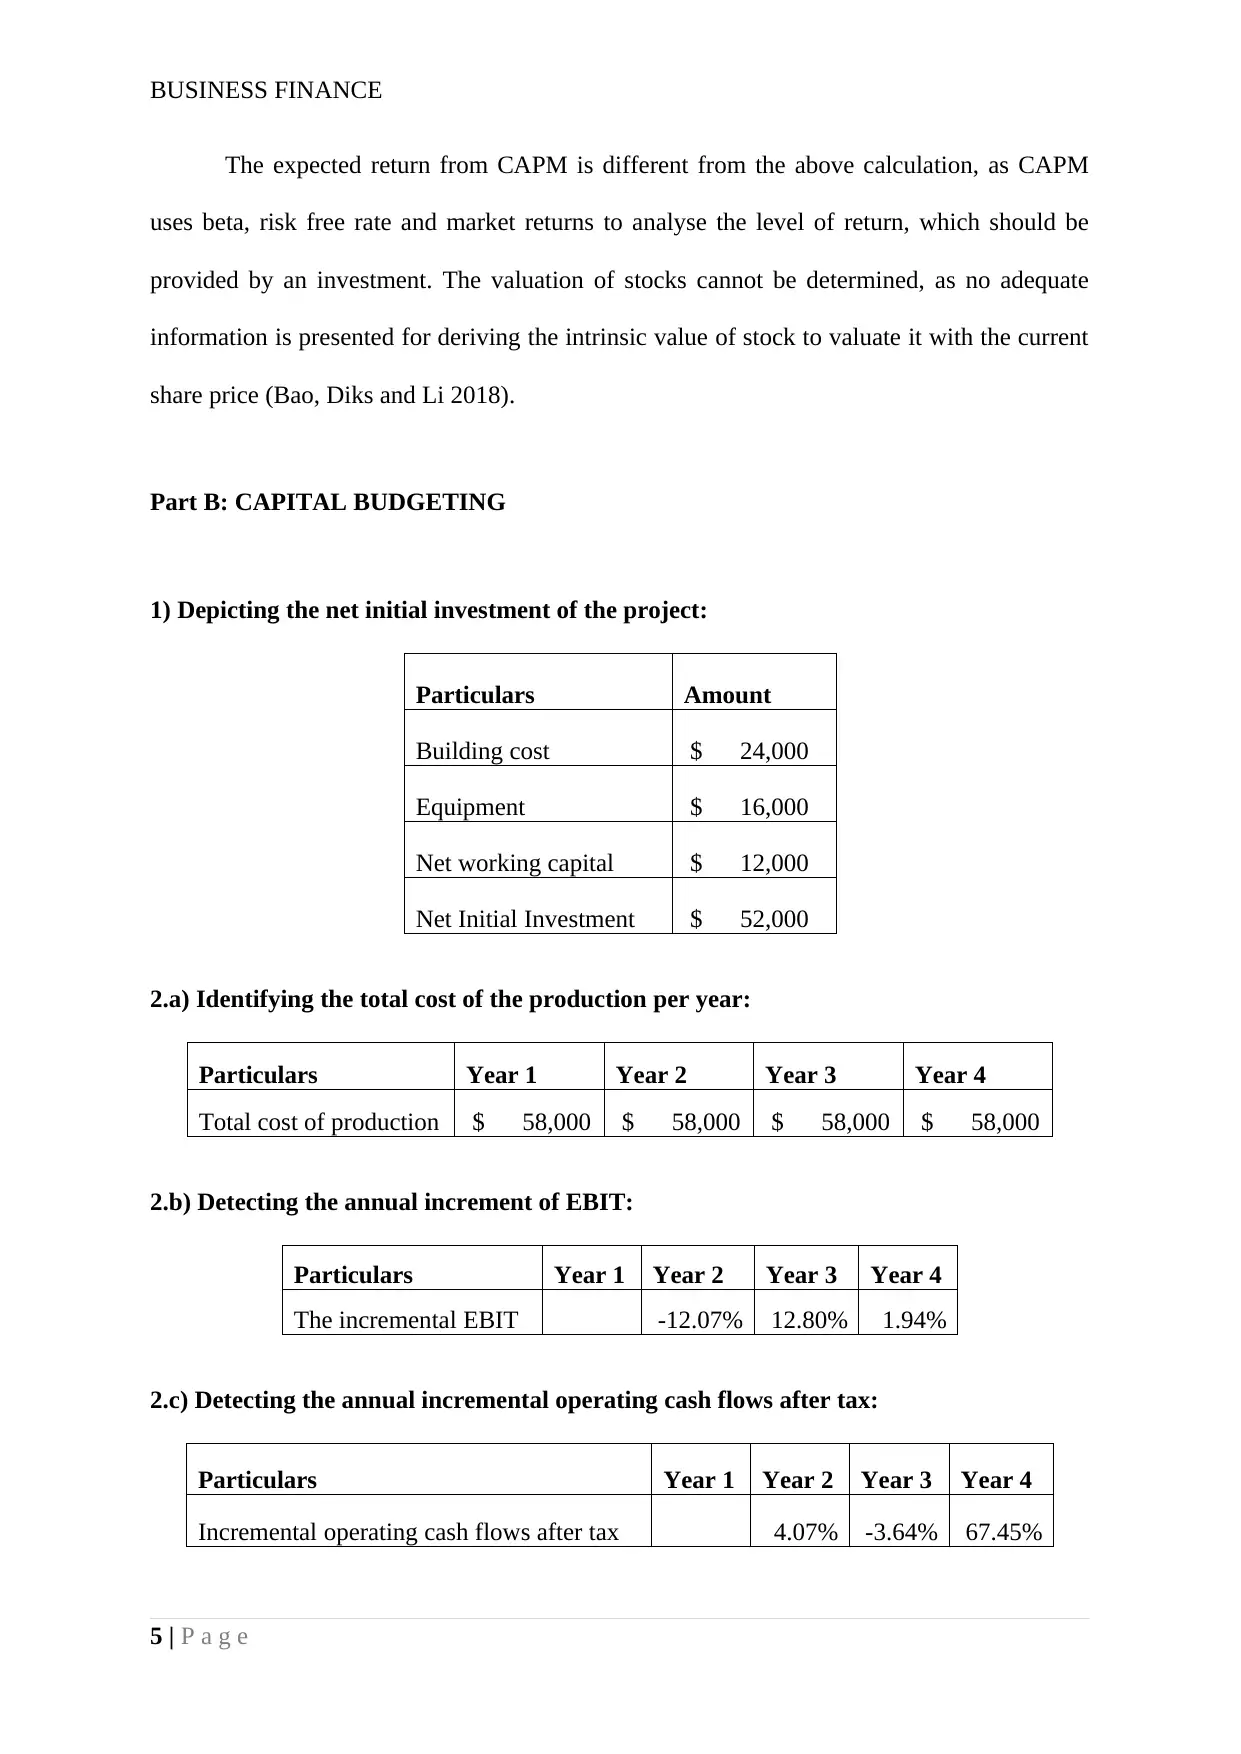
The expected return from CAPM is different from the above calculation, as CAPM
uses beta, risk free rate and market returns to analyse the level of return, which should be
provided by an investment. The valuation of stocks cannot be determined, as no adequate
information is presented for deriving the intrinsic value of stock to valuate it with the current
share price (Bao, Diks and Li 2018).
Part B: CAPITAL BUDGETING
1) Depicting the net initial investment of the project:
Particulars Amount
Building cost $ 24,000
Equipment $ 16,000
Net working capital $ 12,000
Net Initial Investment $ 52,000
2.a) Identifying the total cost of the production per year:
Particulars Year 1 Year 2 Year 3 Year 4
Total cost of production $ 58,000 $ 58,000 $ 58,000 $ 58,000
2.b) Detecting the annual increment of EBIT:
Particulars Year 1 Year 2 Year 3 Year 4
The incremental EBIT -12.07% 12.80% 1.94%
2.c) Detecting the annual incremental operating cash flows after tax:
Particulars Year 1 Year 2 Year 3 Year 4
Incremental operating cash flows after tax 4.07% -3.64% 67.45%
5 | P a g e
⊘ This is a preview!⊘
Do you want full access?
Subscribe today to unlock all pages.
Trusted by 1+ million students worldwide
BUSINESS FINANCE
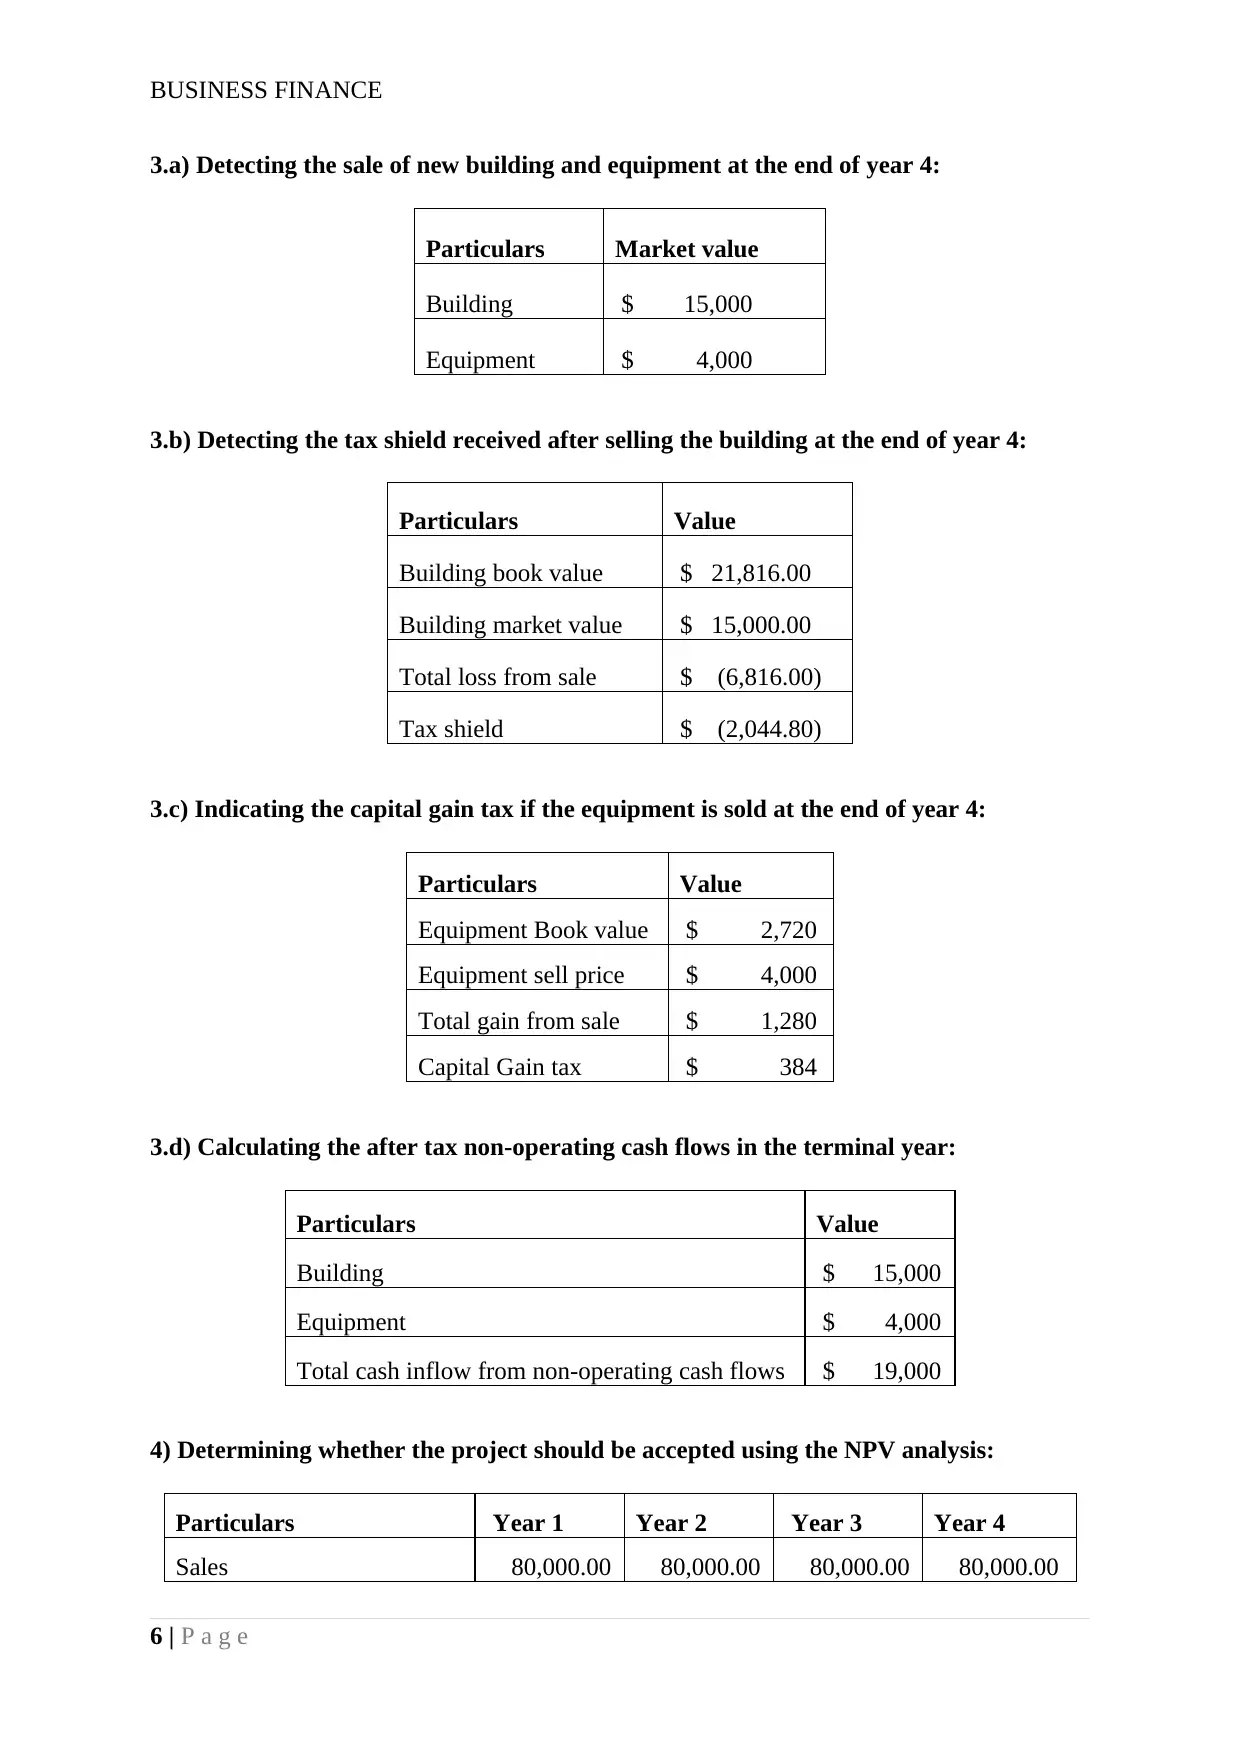
3.a) Detecting the sale of new building and equipment at the end of year 4:
Particulars Market value
Building $ 15,000
Equipment $ 4,000
3.b) Detecting the tax shield received after selling the building at the end of year 4:
Particulars Value
Building book value $ 21,816.00
Building market value $ 15,000.00
Total loss from sale $ (6,816.00)
Tax shield $ (2,044.80)
3.c) Indicating the capital gain tax if the equipment is sold at the end of year 4:
Particulars Value
Equipment Book value $ 2,720
Equipment sell price $ 4,000
Total gain from sale $ 1,280
Capital Gain tax $ 384
3.d) Calculating the after tax non-operating cash flows in the terminal year:
Particulars Value
Building $ 15,000
Equipment $ 4,000
Total cash inflow from non-operating cash flows $ 19,000
4) Determining whether the project should be accepted using the NPV analysis:
Particulars Year 1 Year 2 Year 3 Year 4
Sales 80,000.00 80,000.00 80,000.00 80,000.00
6 | P a g e
Paraphrase This Document
Need a fresh take? Get an instant paraphrase of this document with our AI Paraphraser
BUSINESS FINANCE
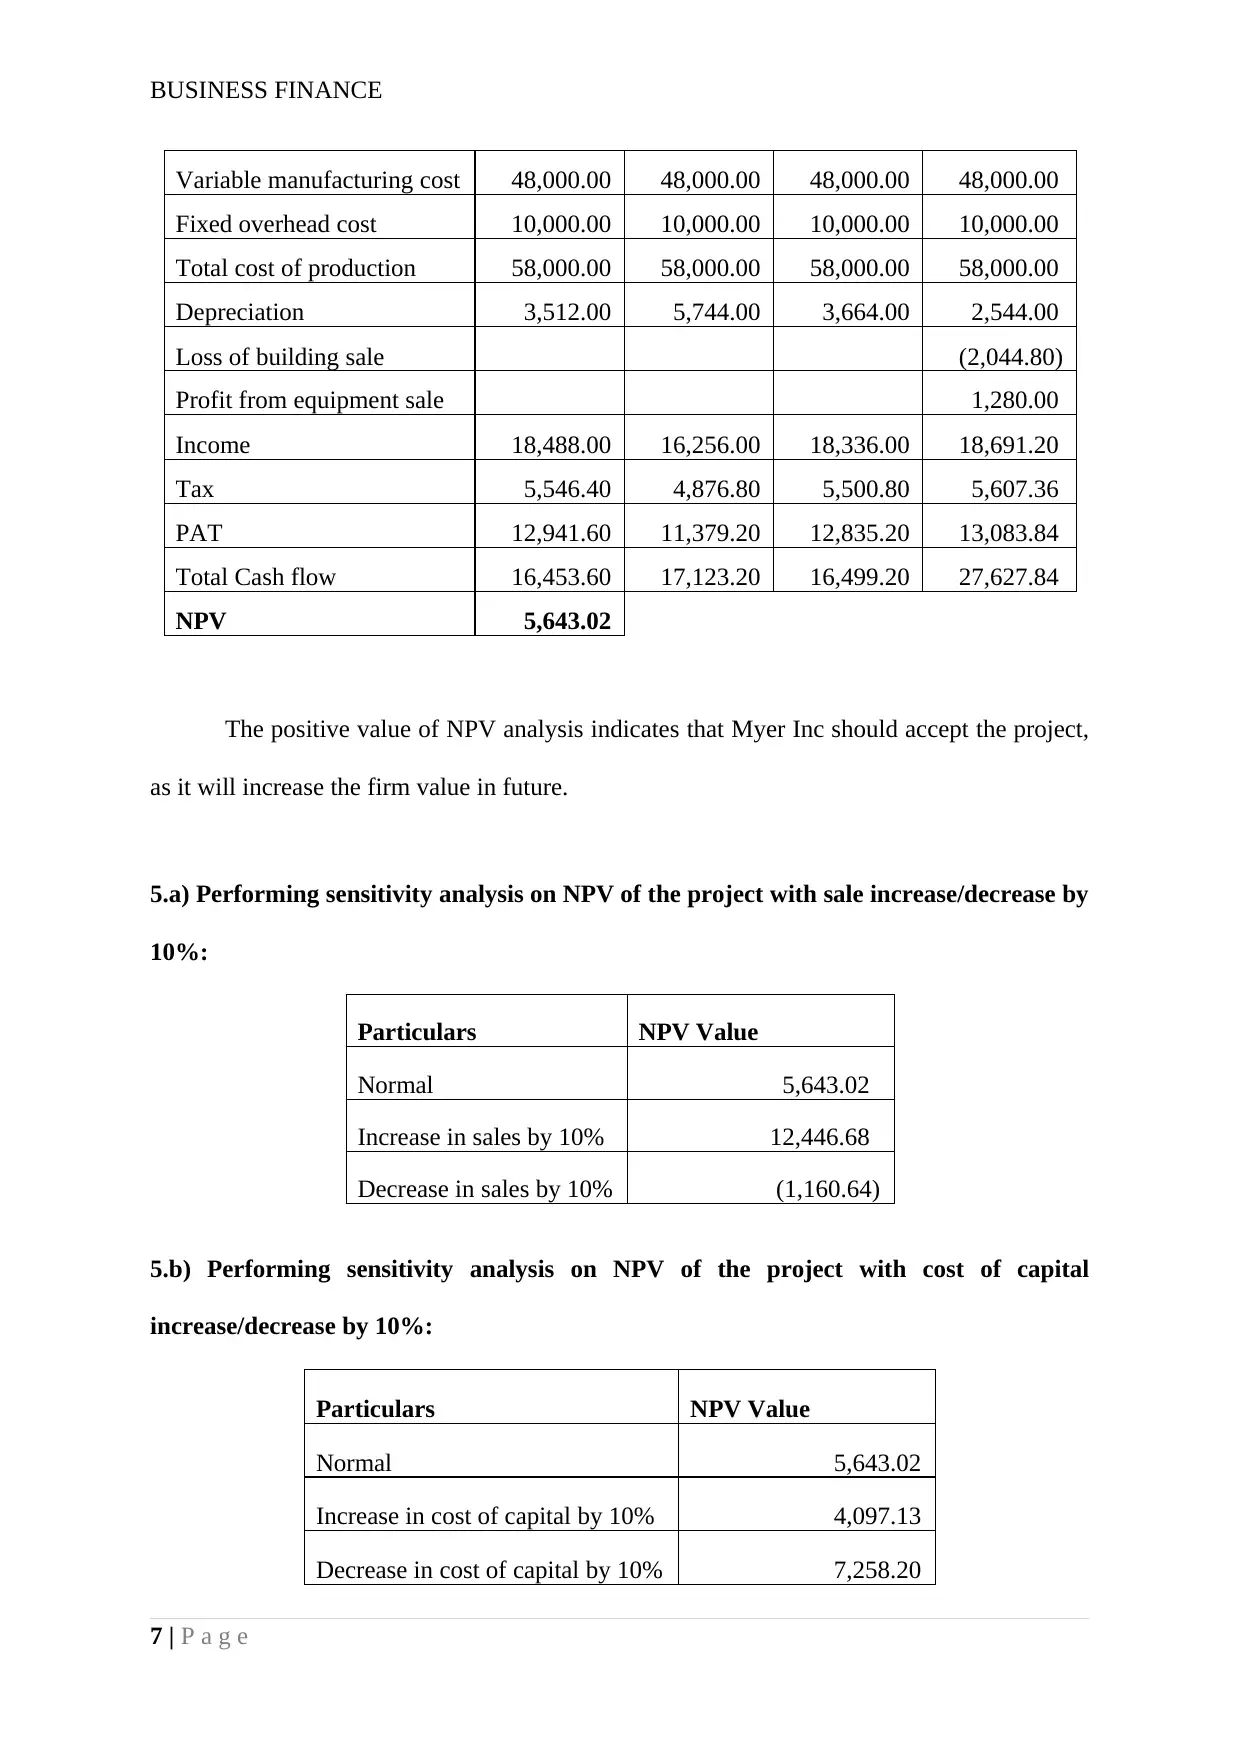
Variable manufacturing cost 48,000.00 48,000.00 48,000.00 48,000.00
Fixed overhead cost 10,000.00 10,000.00 10,000.00 10,000.00
Total cost of production 58,000.00 58,000.00 58,000.00 58,000.00
Depreciation 3,512.00 5,744.00 3,664.00 2,544.00
Loss of building sale (2,044.80)
Profit from equipment sale 1,280.00
Income 18,488.00 16,256.00 18,336.00 18,691.20
Tax 5,546.40 4,876.80 5,500.80 5,607.36
PAT 12,941.60 11,379.20 12,835.20 13,083.84
Total Cash flow 16,453.60 17,123.20 16,499.20 27,627.84
NPV 5,643.02
The positive value of NPV analysis indicates that Myer Inc should accept the project,
as it will increase the firm value in future.
5.a) Performing sensitivity analysis on NPV of the project with sale increase/decrease by
10%:
Particulars NPV Value
Normal 5,643.02
Increase in sales by 10% 12,446.68
Decrease in sales by 10% (1,160.64)
5.b) Performing sensitivity analysis on NPV of the project with cost of capital
increase/decrease by 10%:
Particulars NPV Value
Normal 5,643.02
Increase in cost of capital by 10% 4,097.13
Decrease in cost of capital by 10% 7,258.20
7 | P a g e
BUSINESS FINANCE
Reference and Bibliography:
Bao, T., Diks, C. and Li, H., 2018. A generalized CAPM model with asymmetric power
distributed errors with an application to portfolio construction. Economic Modelling, 68,
pp.611-621.
Baum, A.E. and Crosby, N., 2014. Property investment appraisal. John Wiley & Sons.
Fang, L., Chen, B., Yu, H. and Xiong, C., 2018. The effect of economic policy uncertainty on
the long-run correlation between crude oil and the US stock markets. Finance Research
Letters, 24, pp.56-63.
Fard, H.V. and Falah, A.B., 2015. A New Modified CAPM Model: The Two Beta
CAPM. Jurnal UMP Social Sciences and Technology Management Vol, 3(1).
Li, F.G. and Trutnevyte, E., 2017. Investment appraisal of cost-optimal and near-optimal
pathways for the UK electricity sector transition to 2050. Applied energy, 189, pp.89-109.
Lokman, S., Volker, D., Zijlstra-Vlasveld, M.C., Brouwers, E.P., Boon, B., Beekman, A.T.,
Smit, F. and Van der Feltz-Cornelis, C.M., 2017. Return-to-work intervention versus usual
care for sick-listed employees: health-economic investment appraisal alongside a cluster
randomised trial. BMJ open, 7(10), p.e016348.
Nasiri, M., Alishah, A.Y., Sayyahmelli, S.A.S. and Karimi, A., 2017. Estimating Expected
Return based on Capital Asset Pricing Model compared with Stock Interest Rate at Tehran
Stock Exchange. HELIX, 7(2), pp.1406-1415.
Nghiem, L., 2015. Risk-return relationship: An empirical study of different statistical
methods for estimating the Capital Asset Pricing Models (CAPM) and the Fama-French
model for large cap stocks. arXiv preprint arXiv:1511.07101.
8 | P a g e
⊘ This is a preview!⊘
Do you want full access?
Subscribe today to unlock all pages.
Trusted by 1+ million students worldwide
BUSINESS FINANCE
Sattar, M., 2017. CAPM Vs Fama-French three-factor model: an evaluation of effectiveness
in explaining excess return in Dhaka stock exchange. International Journal of Business and
Management, 12(5), p.119.
Shortall, J., Shalloo, L., Foley, C., Sleator, R.D. and O’Brien, B., 2016. Investment appraisal
of automatic milking and conventional milking technologies in a pasture-based dairy
system. Journal of dairy science, 99(9), pp.7700-7713.
Upton, J., Murphy, M., De Boer, I.J.M., Koerkamp, P.G., Berentsen, P.B.M. and Shalloo, L.,
2015. Investment appraisal of technology innovations on dairy farm electricity
consumption. Journal of dairy science, 98(2), pp.898-909.
Warren, L. and Seal, W., 2018. Using investment appraisal models in strategic negotiation:
the cultural political economy of electricity generation. Accounting, Organizations and
Society.
9 | P a g e
1 out of 10
Your All-in-One AI-Powered Toolkit for Academic Success.
+13062052269
info@desklib.com
Available 24*7 on WhatsApp / Email
![[object Object]](/_next/static/media/star-bottom.7253800d.svg)
Unlock your academic potential
© 2024 | Zucol Services PVT LTD | All rights reserved.