LCBB5000 - Business Intelligence Report: Sales Trends & Customer Data
VerifiedAdded on 2023/06/16
|18
|3517
|190
Report
AI Summary
This business intelligence report analyzes sales data from 2009 to 2012 using Microsoft Excel to identify a decline in sales and potential influencing factors. It also explores customer data from a smile clinic using SPSS to determine the number of customers who consume rice daily, the gender distribution of customers, and the mean and median age of the customer base. The report further discusses data pre-processing and visualization techniques in Excel, advantages and disadvantages of using Excel and SPSS and data mining methods used by real-world businesses. The findings aim to provide insights for better decision-making and improved business strategies. Desklib offers similar solved assignments and past papers for students.

Business Intelligence
Paraphrase This Document
Need a fresh take? Get an instant paraphrase of this document with our AI Paraphraser
Contents
INTRODUCTION...........................................................................................................................3
Part 1................................................................................................................................................3
Decline in sales over the years with data analysis.......................................................................3
Pre-processing analysis and data visualising with excel.............................................................5
PART 2............................................................................................................................................7
Number of customers of smile clinic who eat rice in their daily meal for healthy diet...............7
Number of male and female customers of Smile clinic.............................................................10
Mean and median value of age of Smile clinic customers........................................................12
K mean clustering......................................................................................................................14
Different data mining methods, used by real world businesses.................................................15
Advantages and disadvantages of using excel and SPSS..........................................................16
CONCLUSION..............................................................................................................................16
REFERENCES..............................................................................................................................18
INTRODUCTION
Business intelligence can be known as technical infrastructure that helps companies in
collecting, analyzing and storing big data an improving decision-making process (Marian and
et.al., 2018). This study is going to discuss effectiveness of Microsoft excel tool and ways in
which it can help employees in analyzing and visualizing data. It will identify declining in sales
of superstore with the help of excel. Further, it will discuss effectiveness of SPSS software and
ways in which it can help employees in knowing relation between two factors and knowing the
number of females and males that have visited smile clinic for dental treatment. On the basis of
data analysis and making use of SPSS as well as excel, it becomes easier in taking decision and
providing better suggestions to customers.
Part 1
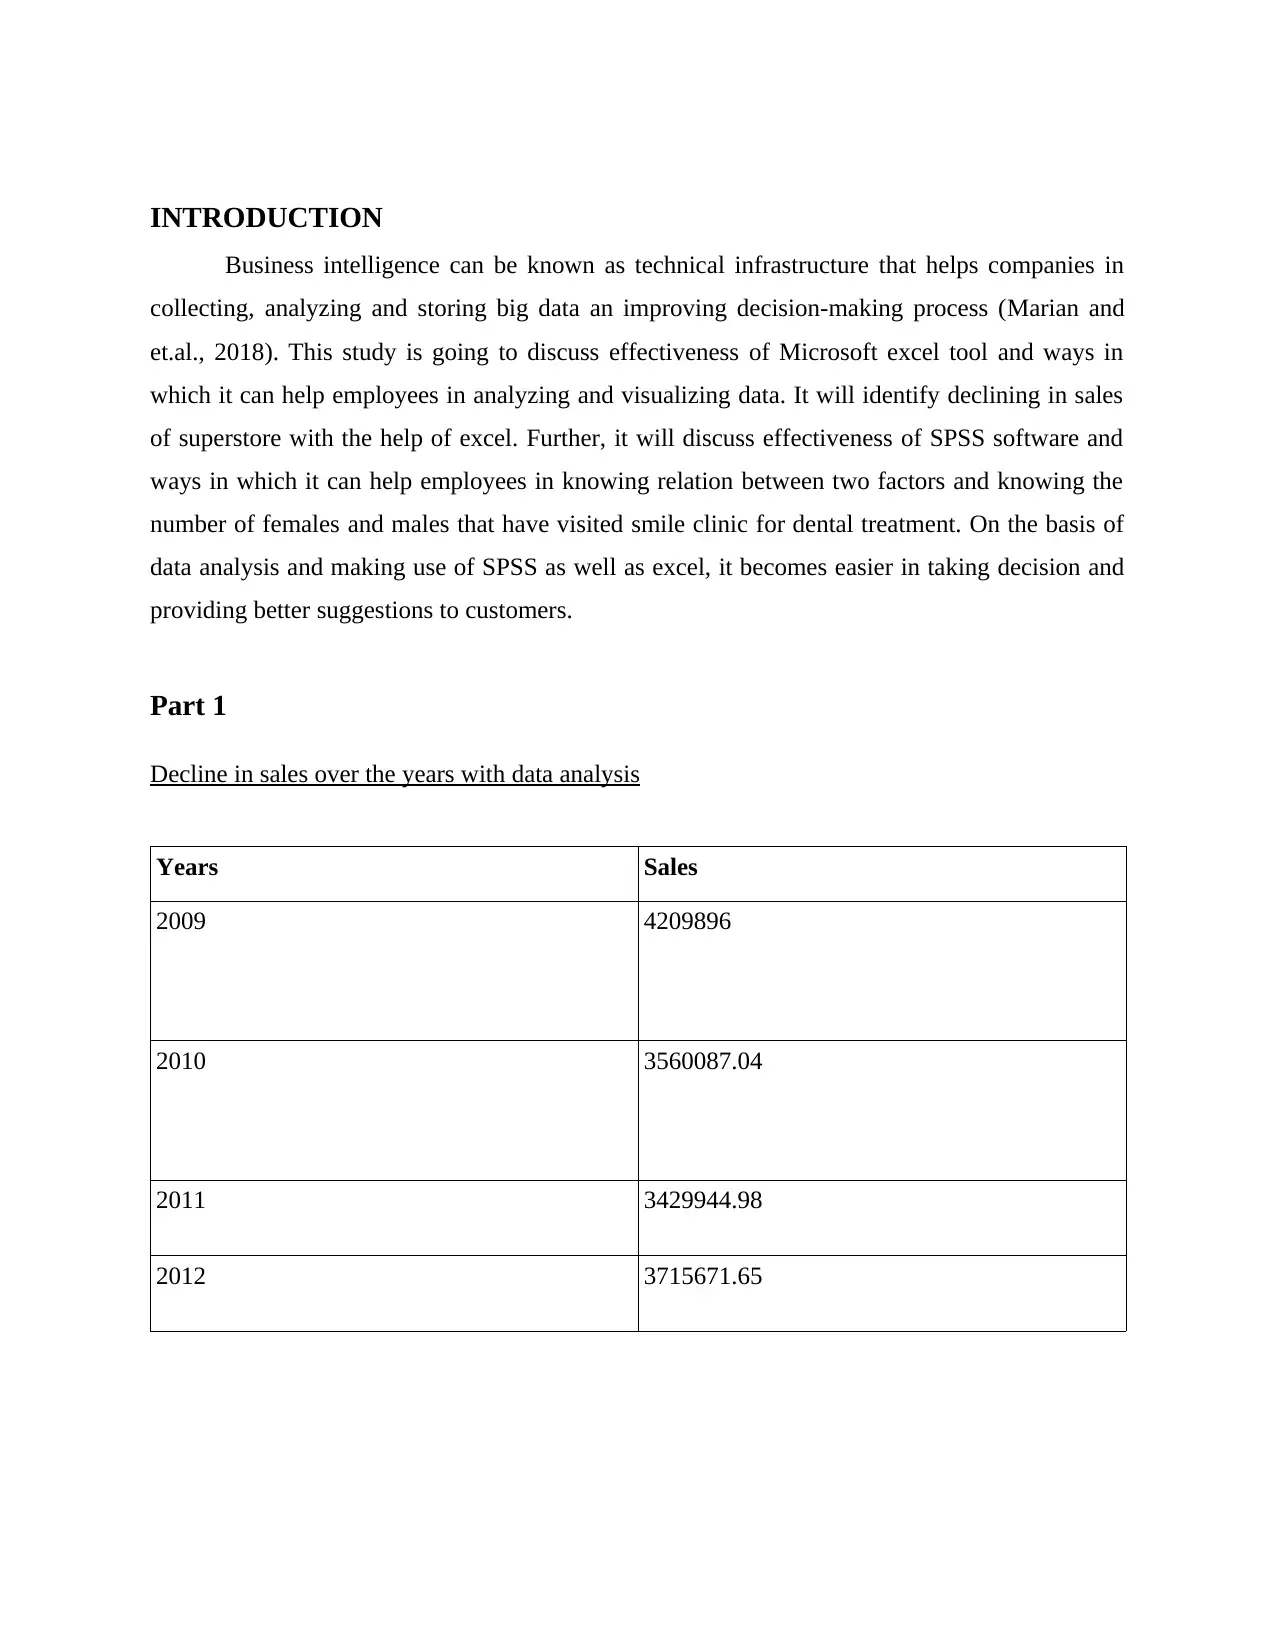
Decline in sales over the years with data analysis
Years Sales
2009 4209896
2010 3560087.04
2011 3429944.98
2012 3715671.65
Business intelligence can be known as technical infrastructure that helps companies in
collecting, analyzing and storing big data an improving decision-making process (Marian and
et.al., 2018). This study is going to discuss effectiveness of Microsoft excel tool and ways in
which it can help employees in analyzing and visualizing data. It will identify declining in sales
of superstore with the help of excel. Further, it will discuss effectiveness of SPSS software and
ways in which it can help employees in knowing relation between two factors and knowing the
number of females and males that have visited smile clinic for dental treatment. On the basis of
data analysis and making use of SPSS as well as excel, it becomes easier in taking decision and
providing better suggestions to customers.
Part 1
Decline in sales over the years with data analysis
Years Sales
2009 4209896
2010 3560087.04
2011 3429944.98
2012 3715671.65
⊘ This is a preview!⊘
Do you want full access?
Subscribe today to unlock all pages.
Trusted by 1+ million students worldwide

Interpretation: Superstore wanted to know its sales of 2009-2012. The main reasons of knowing
sales is to take actions for improving sales as it can help it out in knowing decreasing in sales and
increasing in sales. Accordingly, it can know some reasons of decline as well as increasing in
sales. On the basis of reasons, it can take better decisions of taking actions for improving sales.
As this superstore operates to the great extent and have big data. It becomes difficult to analyse
big data but excel has number of great features and this feature has been used for analysing its
big data and knowing sales of this superstore of 2009-2012. On the basis of above graph, it can
clearly be said that sales in the year of 2010 declined. As compared to 2009, sales of superstore
decreased to 649809. It is the huge decline in sales. It is important for this superstore to identify
all those factors that has declined its sales (Pingping, 2017). There are number of internal and
external factors that may affect sales and performance of company. Internal factors can be
identified with number of ways. Feedback from customers and employees can be known as one
of the best ways. By doing so, superstore can know all those areas where it needs to make
improvements. It can help this superstore in increasing sales by improving all those areas in
which it is lacking behind. Along with this, it can make use of SWOT analysis. It can help this
superstore out in identifying internal factors that may create barriers in accomplishing goals.
With SWOT analysis, it can identify its own strengths, weaknesses, opportunities and threats as
well. Overall, it can be said that data analysis can help this supermarket out in increasing sales by
identifying reasons of decline in sales.
As compared to 2010, sales in 2011 again declined to the great extent. In 2010, sales of
this supermarket were: 3560087 and in 2011, it declined and sales were: 3429944. Sales declined
Paraphrase This Document
Need a fresh take? Get an instant paraphrase of this document with our AI Paraphraser
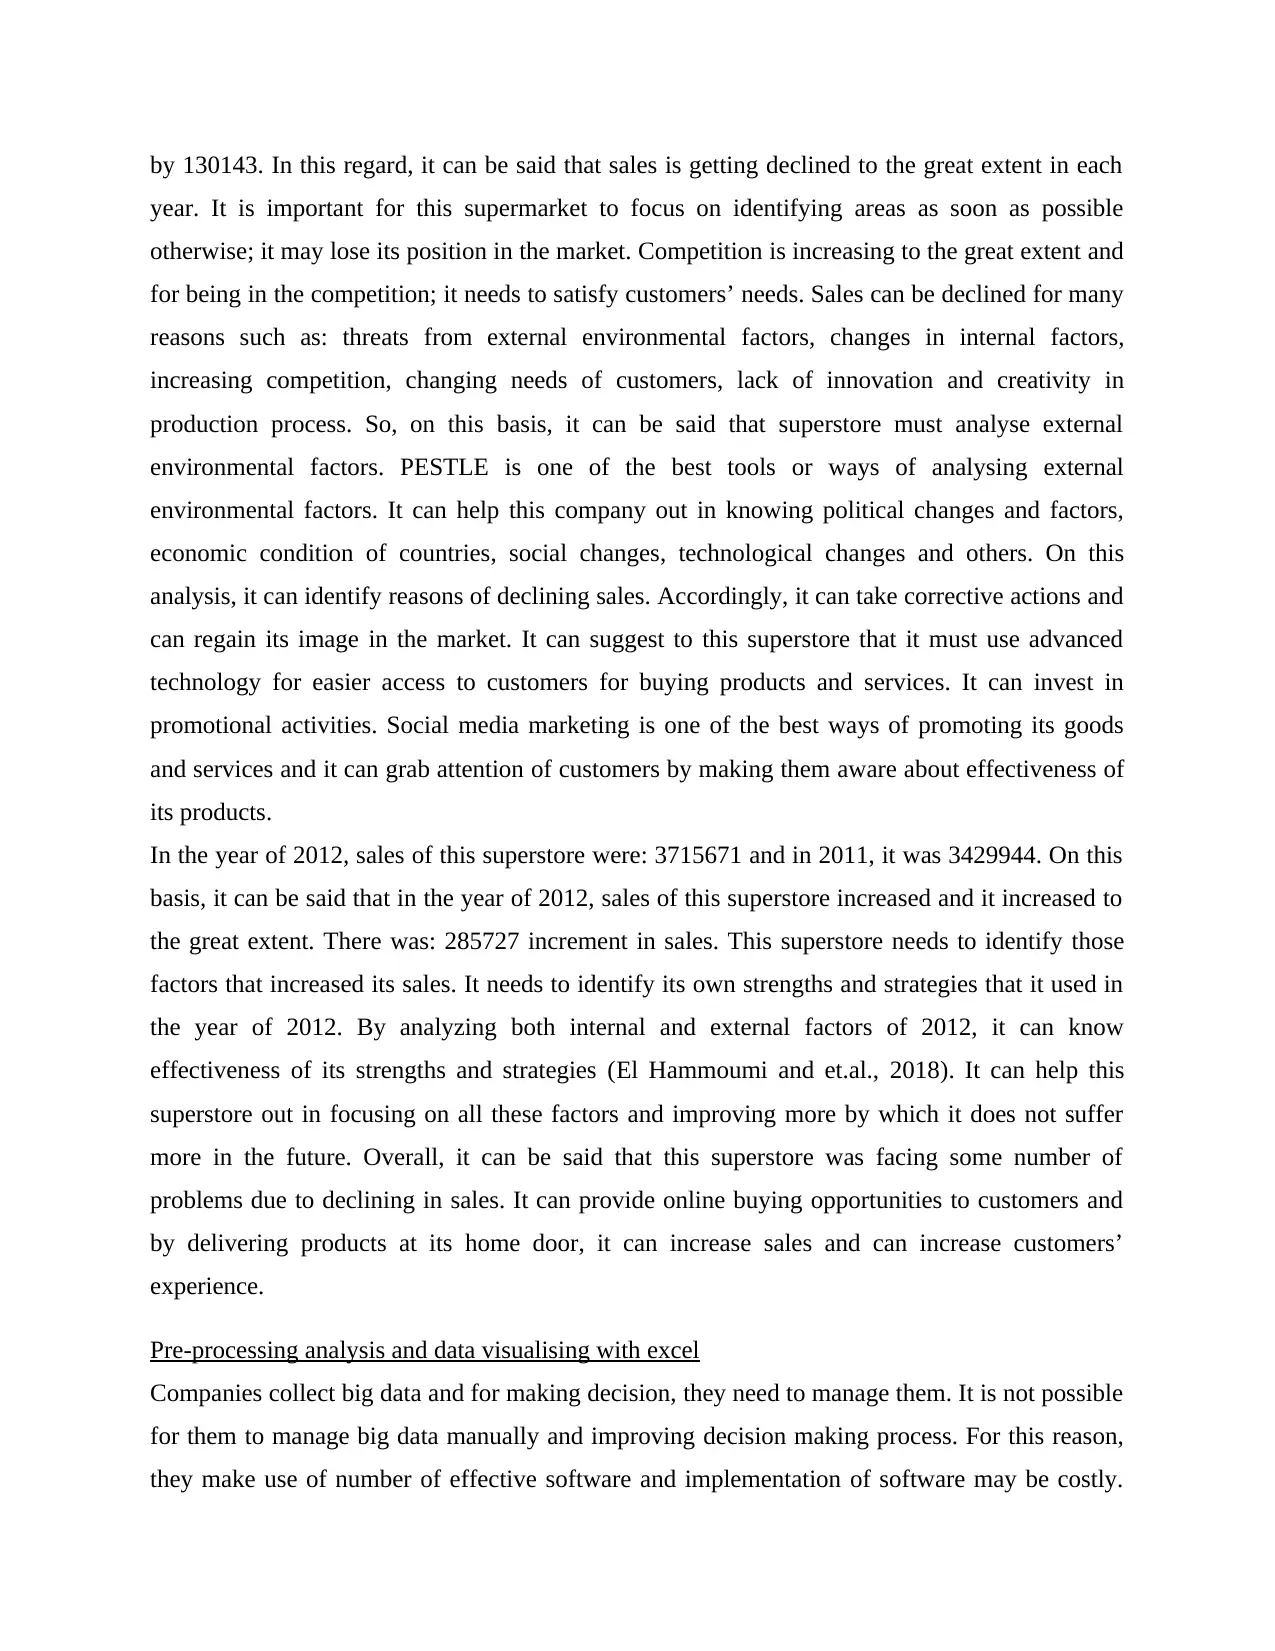
by 130143. In this regard, it can be said that sales is getting declined to the great extent in each
year. It is important for this supermarket to focus on identifying areas as soon as possible
otherwise; it may lose its position in the market. Competition is increasing to the great extent and
for being in the competition; it needs to satisfy customers’ needs. Sales can be declined for many
reasons such as: threats from external environmental factors, changes in internal factors,
increasing competition, changing needs of customers, lack of innovation and creativity in
production process. So, on this basis, it can be said that superstore must analyse external
environmental factors. PESTLE is one of the best tools or ways of analysing external
environmental factors. It can help this company out in knowing political changes and factors,
economic condition of countries, social changes, technological changes and others. On this
analysis, it can identify reasons of declining sales. Accordingly, it can take corrective actions and
can regain its image in the market. It can suggest to this superstore that it must use advanced
technology for easier access to customers for buying products and services. It can invest in
promotional activities. Social media marketing is one of the best ways of promoting its goods
and services and it can grab attention of customers by making them aware about effectiveness of
its products.
In the year of 2012, sales of this superstore were: 3715671 and in 2011, it was 3429944. On this
basis, it can be said that in the year of 2012, sales of this superstore increased and it increased to
the great extent. There was: 285727 increment in sales. This superstore needs to identify those
factors that increased its sales. It needs to identify its own strengths and strategies that it used in
the year of 2012. By analyzing both internal and external factors of 2012, it can know
effectiveness of its strengths and strategies (El Hammoumi and et.al., 2018). It can help this
superstore out in focusing on all these factors and improving more by which it does not suffer
more in the future. Overall, it can be said that this superstore was facing some number of
problems due to declining in sales. It can provide online buying opportunities to customers and
by delivering products at its home door, it can increase sales and can increase customers’
experience.
Pre-processing analysis and data visualising with excel
Companies collect big data and for making decision, they need to manage them. It is not possible
for them to manage big data manually and improving decision making process. For this reason,
they make use of number of effective software and implementation of software may be costly.
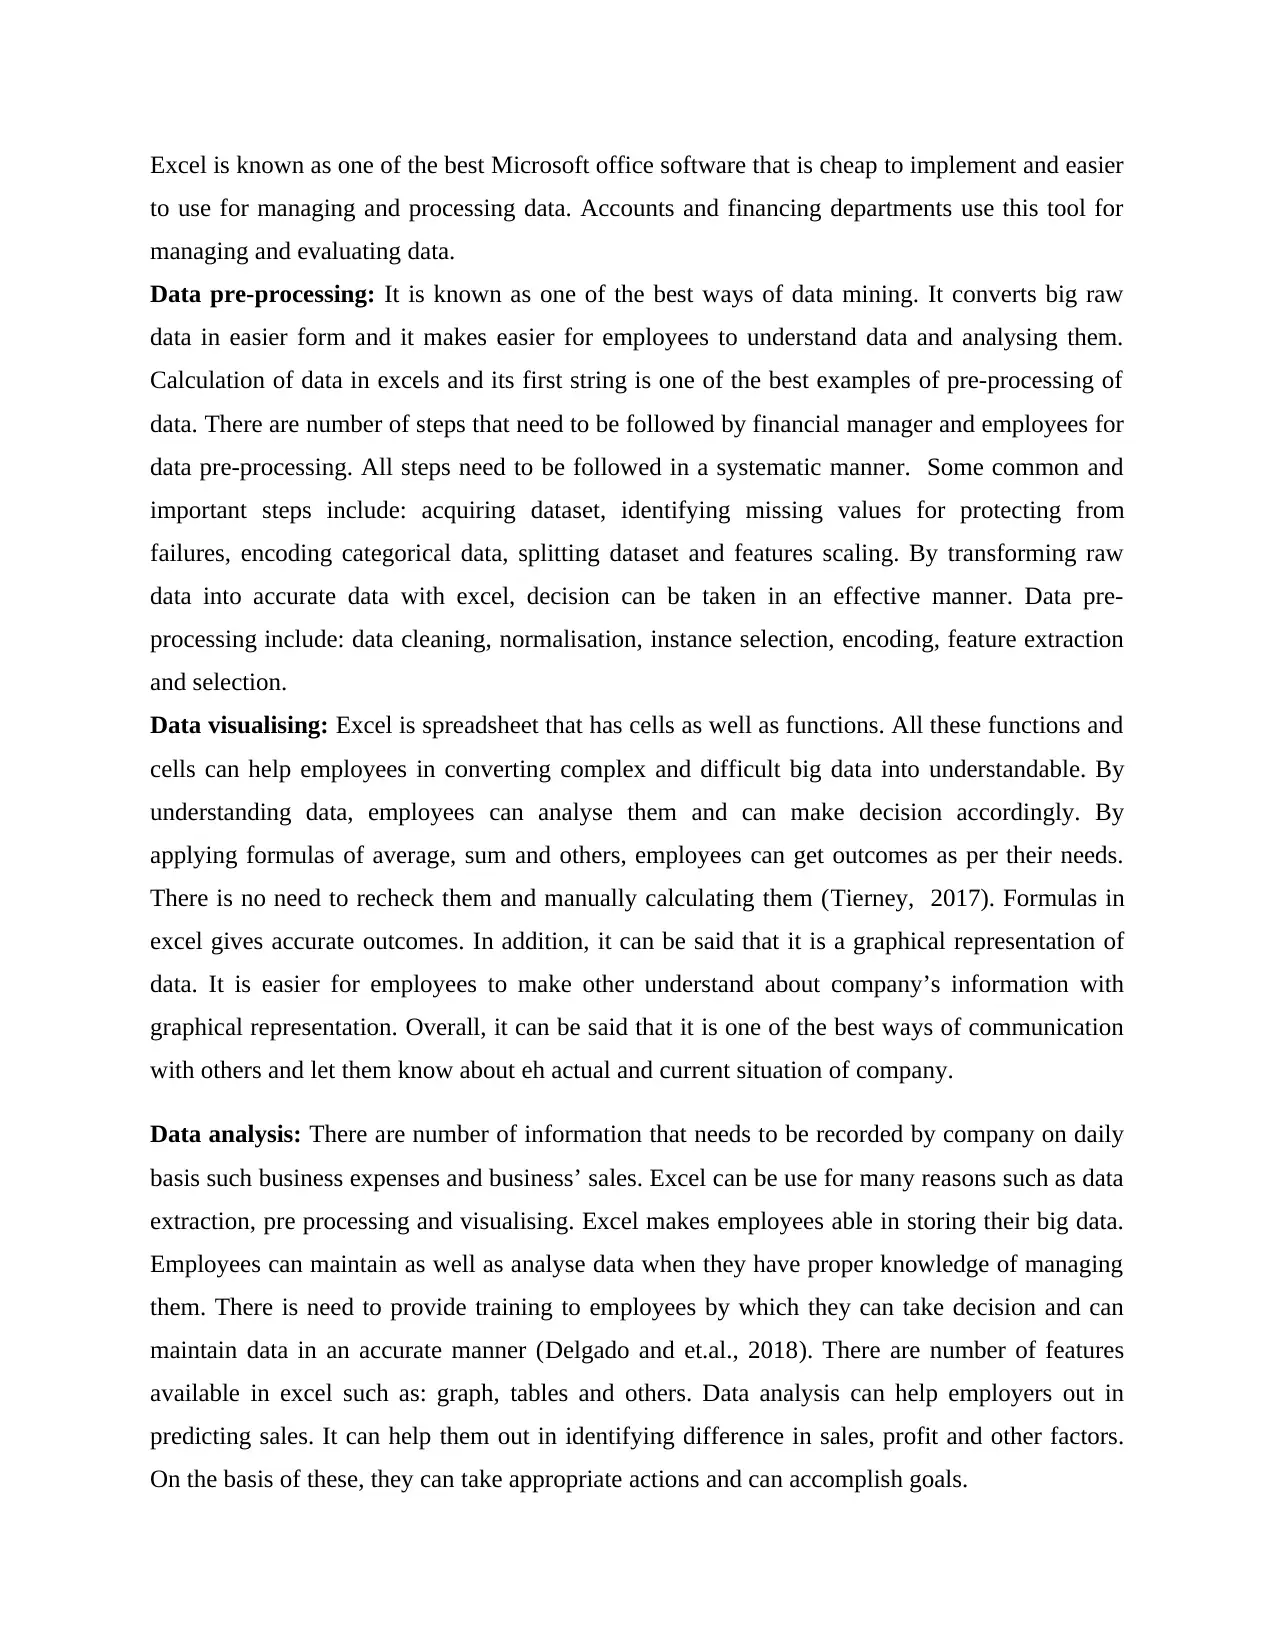
Excel is known as one of the best Microsoft office software that is cheap to implement and easier
to use for managing and processing data. Accounts and financing departments use this tool for
managing and evaluating data.
Data pre-processing: It is known as one of the best ways of data mining. It converts big raw
data in easier form and it makes easier for employees to understand data and analysing them.
Calculation of data in excels and its first string is one of the best examples of pre-processing of
data. There are number of steps that need to be followed by financial manager and employees for
data pre-processing. All steps need to be followed in a systematic manner. Some common and
important steps include: acquiring dataset, identifying missing values for protecting from
failures, encoding categorical data, splitting dataset and features scaling. By transforming raw
data into accurate data with excel, decision can be taken in an effective manner. Data pre-
processing include: data cleaning, normalisation, instance selection, encoding, feature extraction
and selection.
Data visualising: Excel is spreadsheet that has cells as well as functions. All these functions and
cells can help employees in converting complex and difficult big data into understandable. By
understanding data, employees can analyse them and can make decision accordingly. By
applying formulas of average, sum and others, employees can get outcomes as per their needs.
There is no need to recheck them and manually calculating them (Tierney, 2017). Formulas in
excel gives accurate outcomes. In addition, it can be said that it is a graphical representation of
data. It is easier for employees to make other understand about company’s information with
graphical representation. Overall, it can be said that it is one of the best ways of communication
with others and let them know about eh actual and current situation of company.
Data analysis: There are number of information that needs to be recorded by company on daily
basis such business expenses and business’ sales. Excel can be use for many reasons such as data
extraction, pre processing and visualising. Excel makes employees able in storing their big data.
Employees can maintain as well as analyse data when they have proper knowledge of managing
them. There is need to provide training to employees by which they can take decision and can
maintain data in an accurate manner (Delgado and et.al., 2018). There are number of features
available in excel such as: graph, tables and others. Data analysis can help employers out in
predicting sales. It can help them out in identifying difference in sales, profit and other factors.
On the basis of these, they can take appropriate actions and can accomplish goals.
⊘ This is a preview!⊘
Do you want full access?
Subscribe today to unlock all pages.
Trusted by 1+ million students worldwide
PART 2
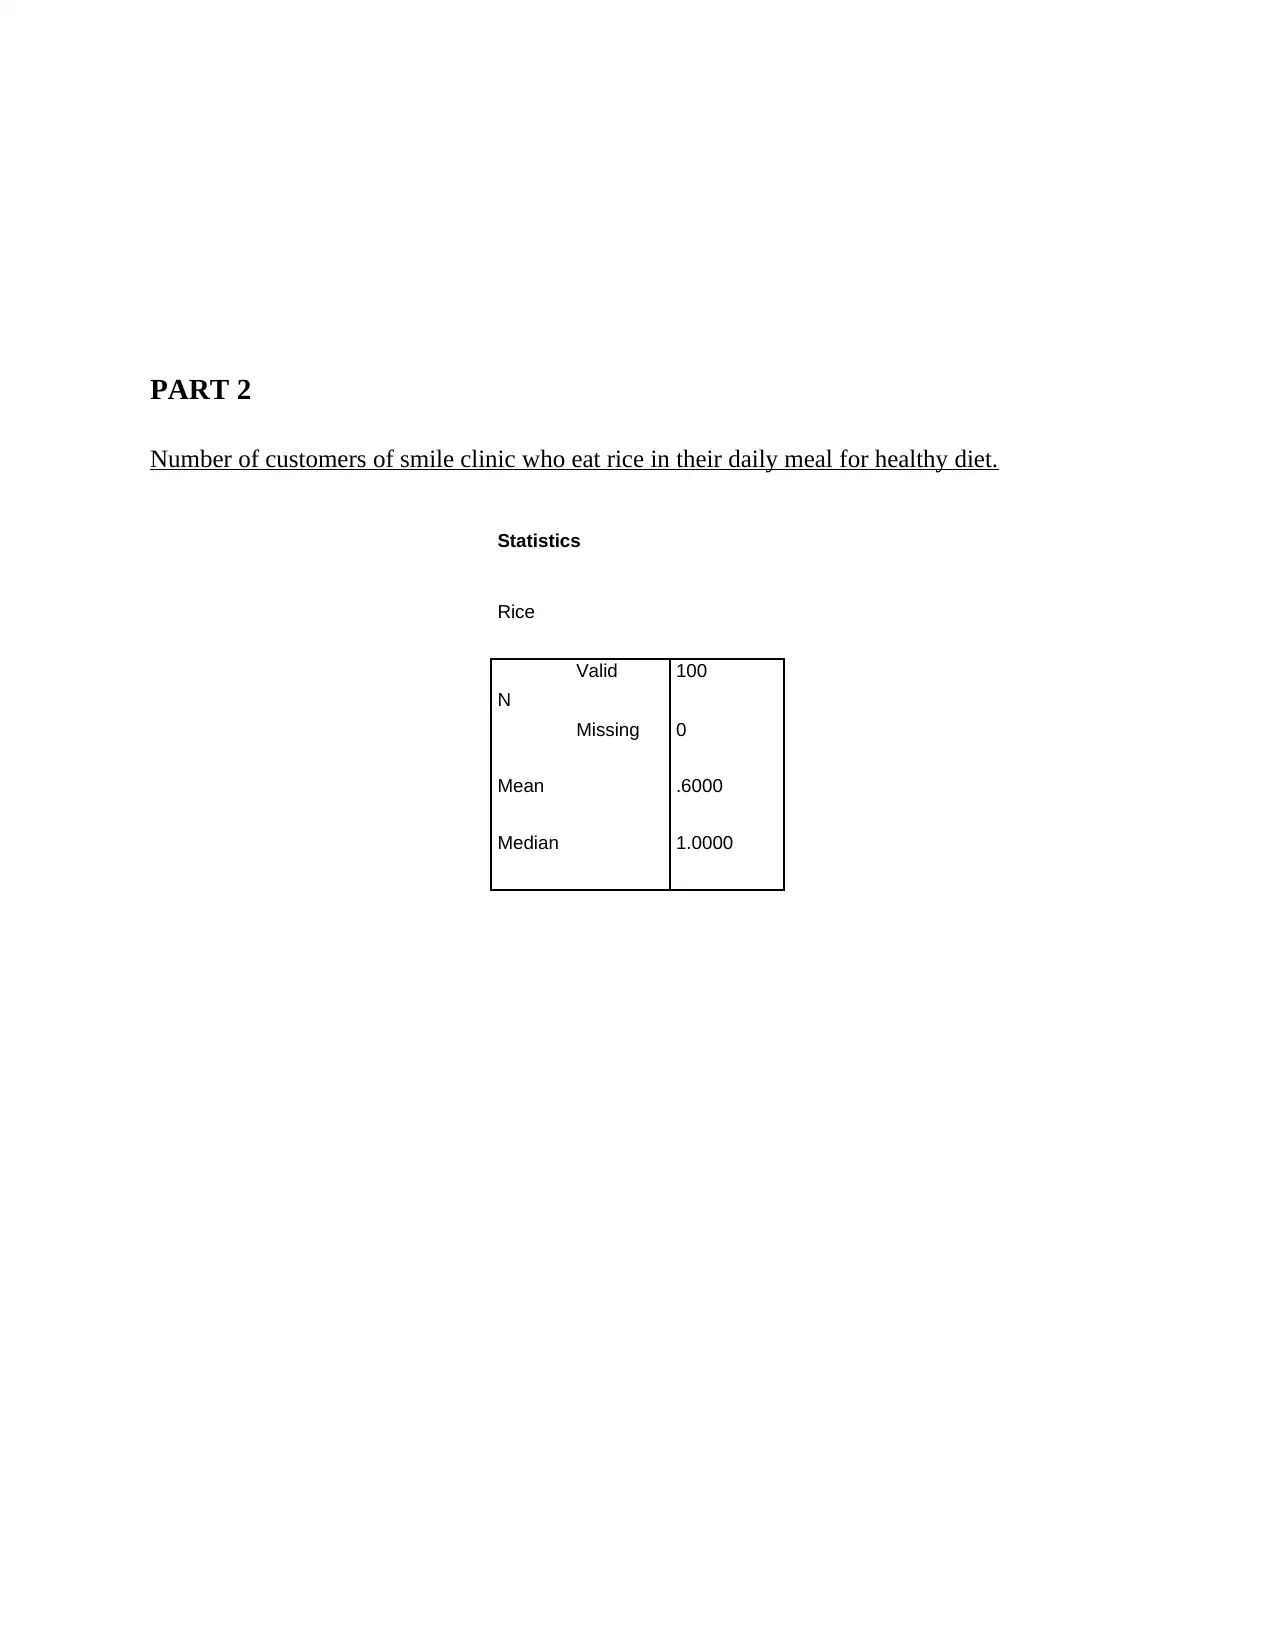
Number of customers of smile clinic who eat rice in their daily meal for healthy diet.
Statistics
Rice
N
Valid 100
Missing 0
Mean .6000
Median 1.0000
Number of customers of smile clinic who eat rice in their daily meal for healthy diet.
Statistics
Rice
N
Valid 100
Missing 0
Mean .6000
Median 1.0000
Paraphrase This Document
Need a fresh take? Get an instant paraphrase of this document with our AI Paraphraser
Rice
Frequency Percent Valid Percent Cumulative
Percent
Valid
N
o40 40.0 40.0 40.0
Y
e
s
60 60.0 60.0 100.0
T
o
t
a
l
100 100.0 100.0
Frequency Percent Valid Percent Cumulative
Percent
Valid
N
o40 40.0 40.0 40.0
Y
e
s
60 60.0 60.0 100.0
T
o
t
a
l
100 100.0 100.0
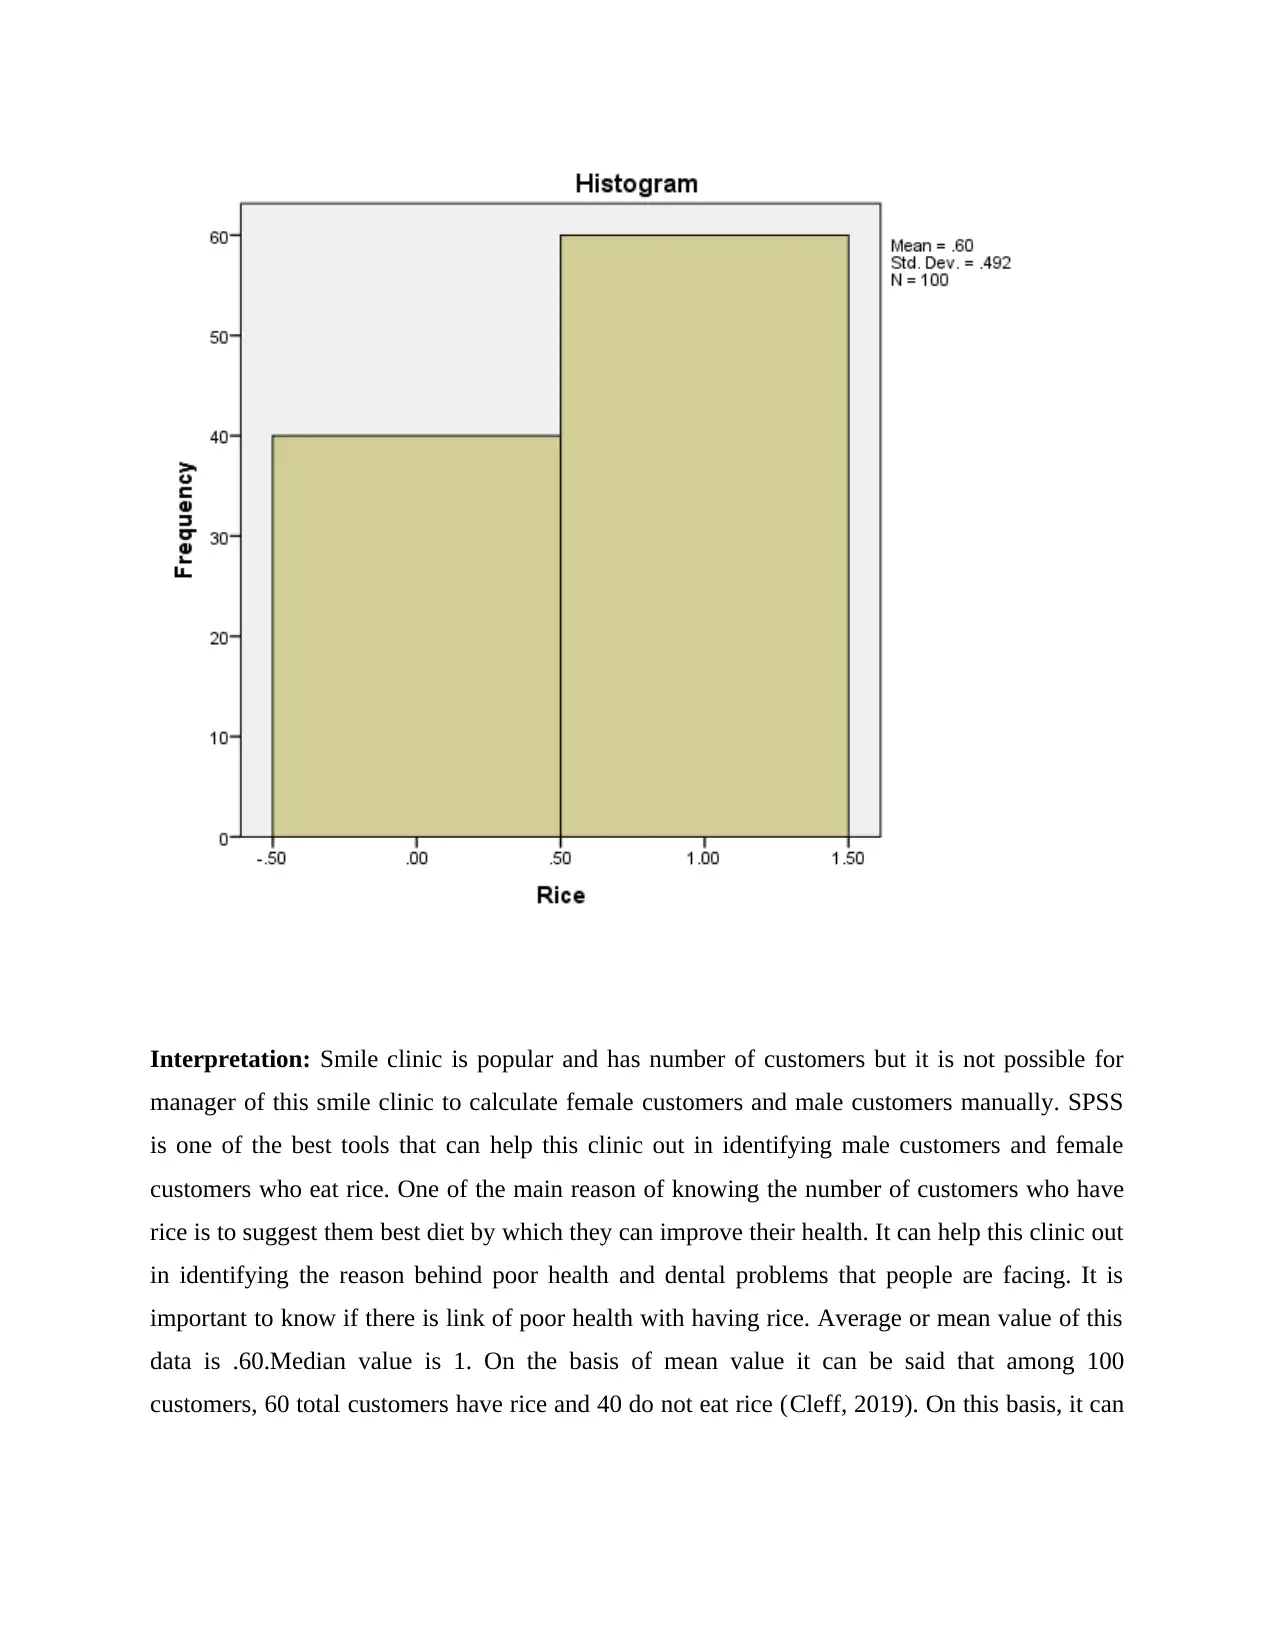
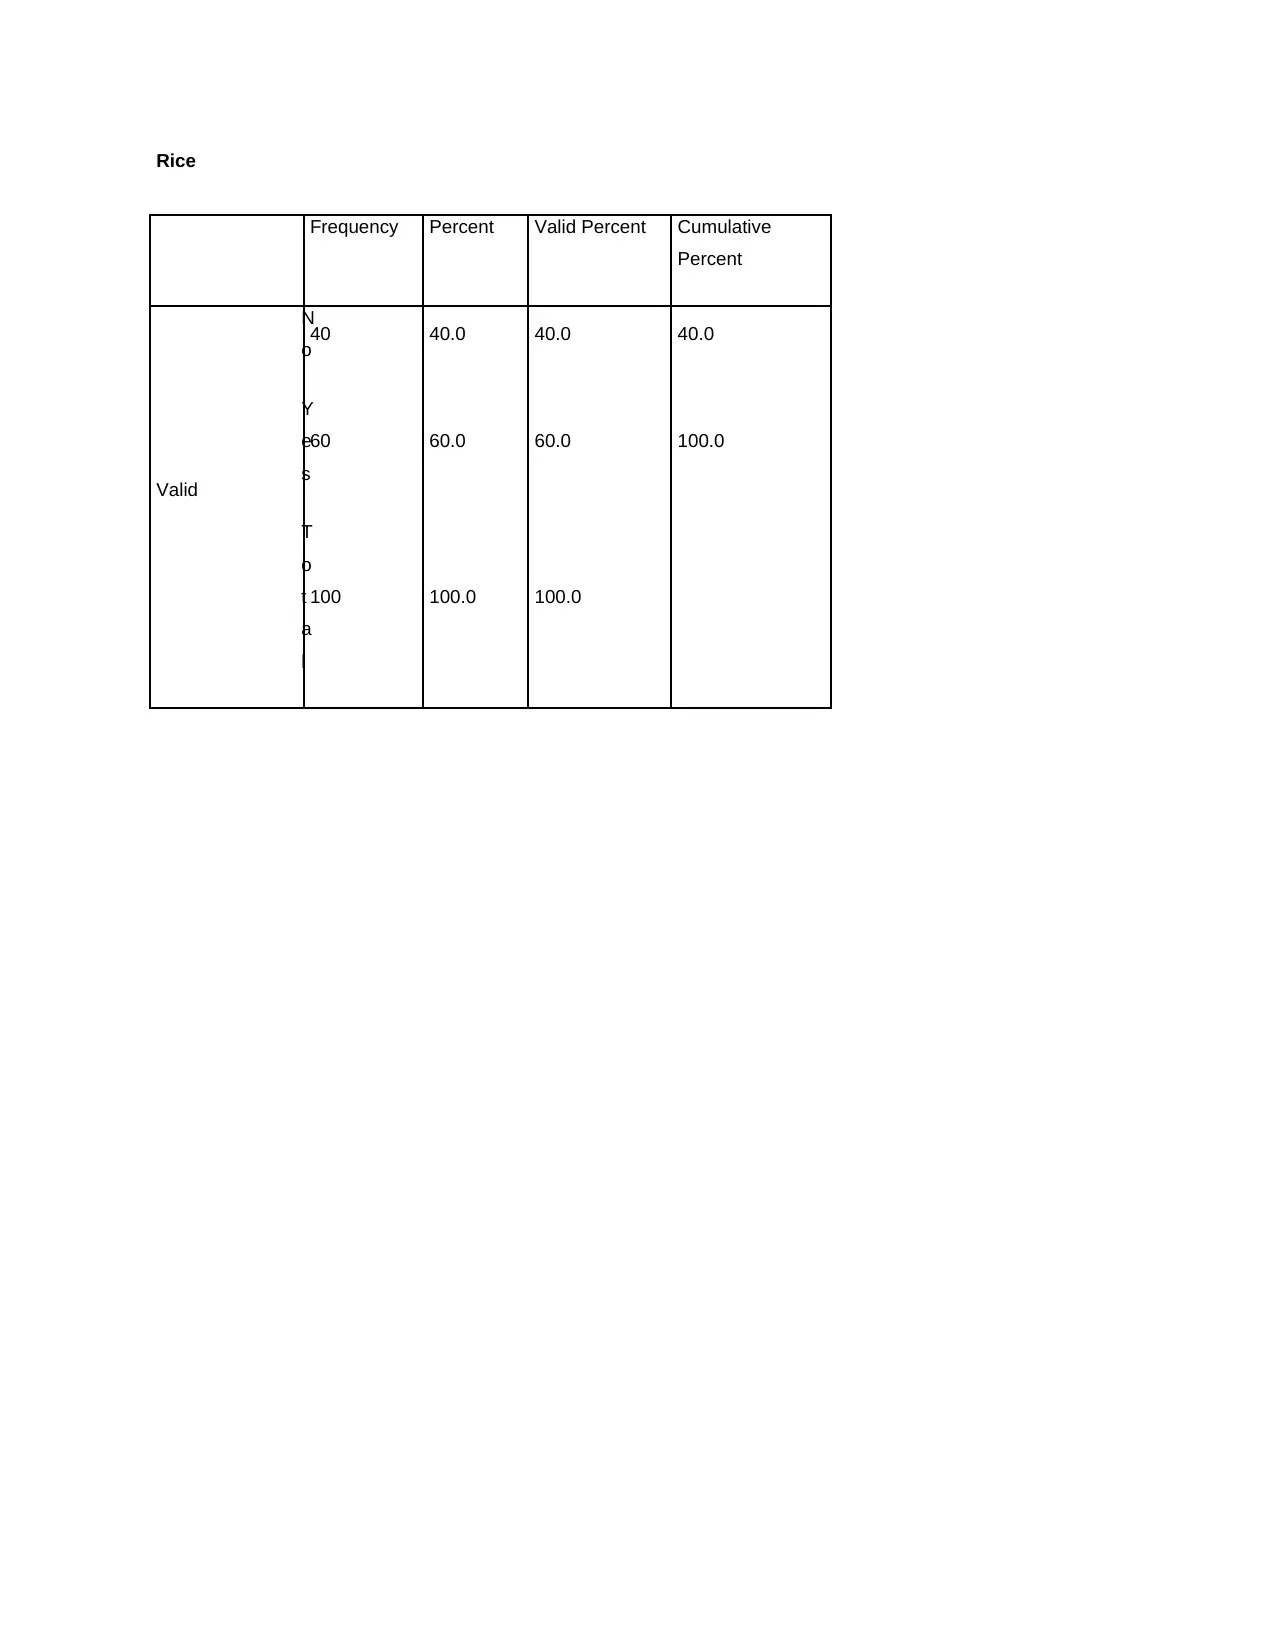
Interpretation: Smile clinic is popular and has number of customers but it is not possible for
manager of this smile clinic to calculate female customers and male customers manually. SPSS
is one of the best tools that can help this clinic out in identifying male customers and female
customers who eat rice. One of the main reason of knowing the number of customers who have
rice is to suggest them best diet by which they can improve their health. It can help this clinic out
in identifying the reason behind poor health and dental problems that people are facing. It is
important to know if there is link of poor health with having rice. Average or mean value of this
data is .60.Median value is 1. On the basis of mean value it can be said that among 100
customers, 60 total customers have rice and 40 do not eat rice (Cleff, 2019). On this basis, it can
⊘ This is a preview!⊘
Do you want full access?
Subscribe today to unlock all pages.
Trusted by 1+ million students worldwide
be said that there may be link between poor health and rice because more than 50% of customers
have rice.
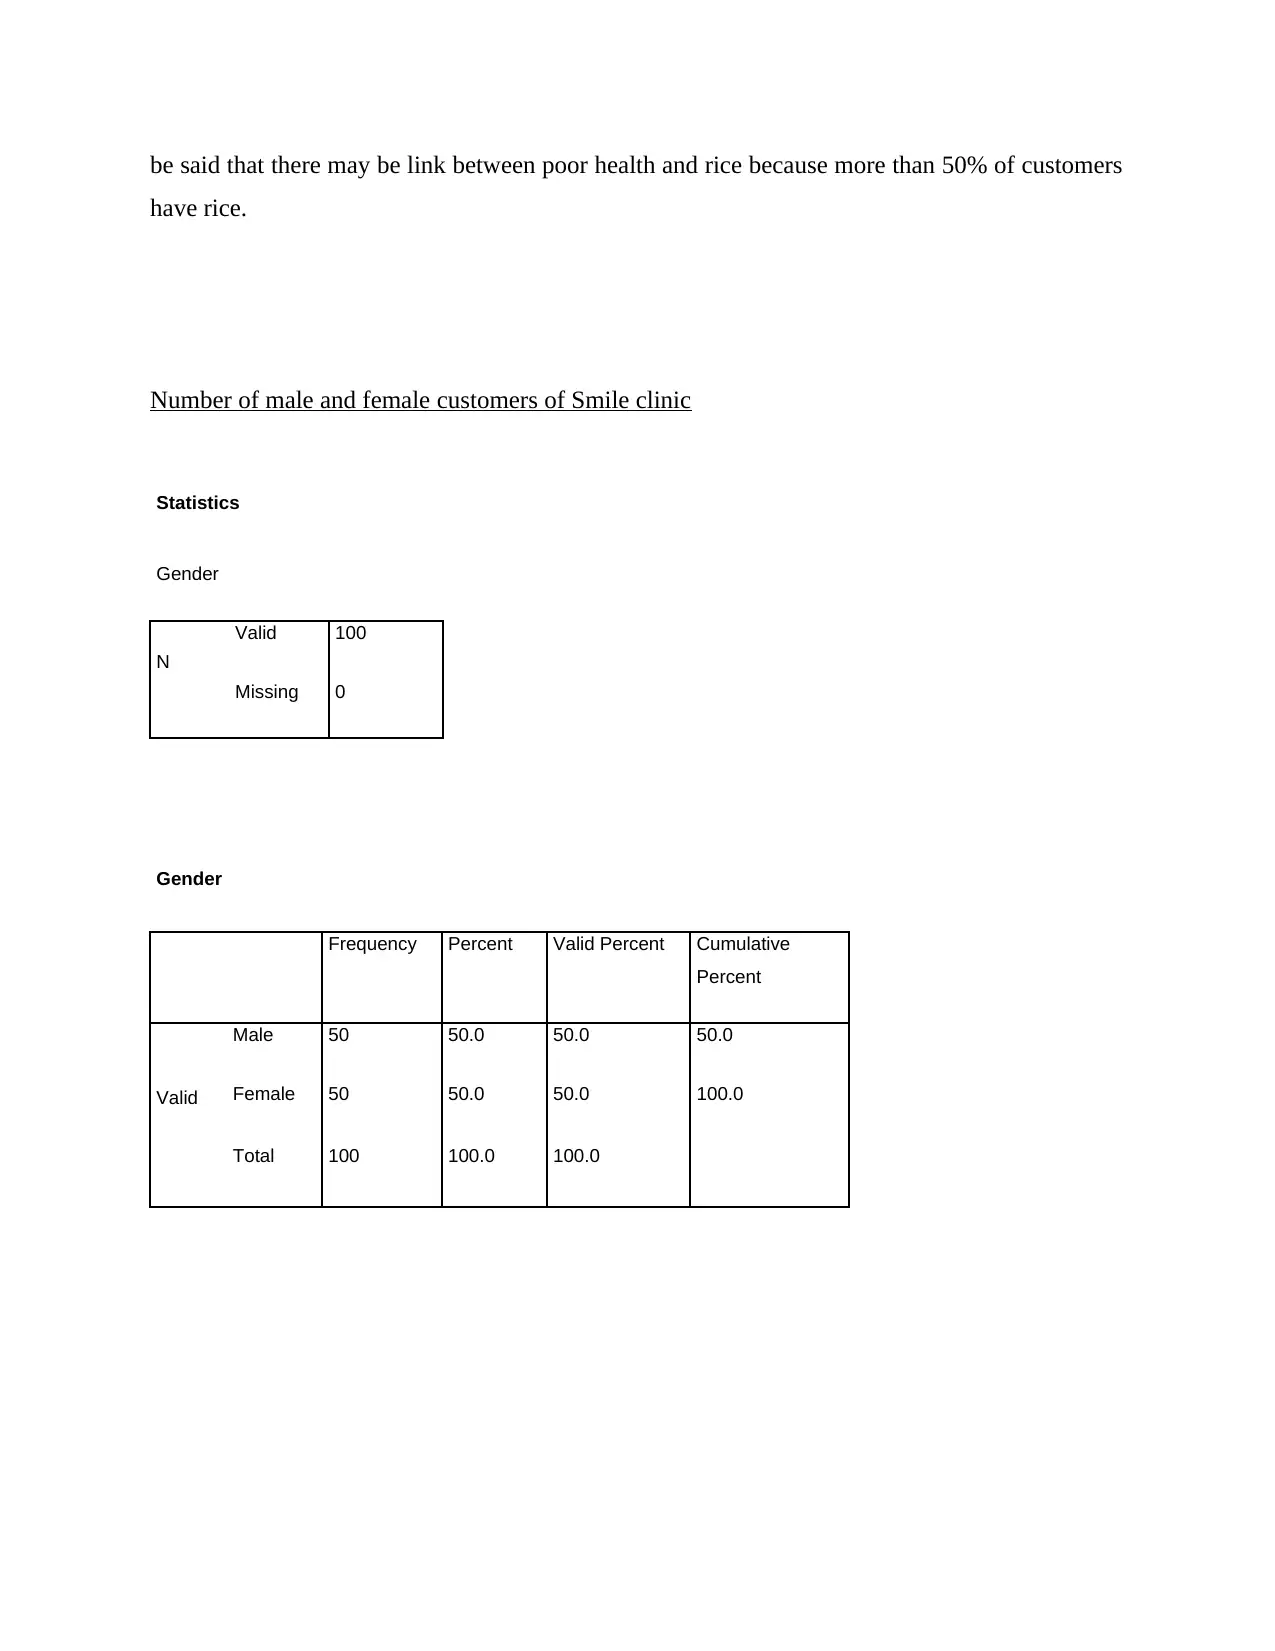
Number of male and female customers of Smile clinic
Statistics
Gender
N
Valid 100
Missing 0
Gender
Frequency Percent Valid Percent Cumulative
Percent
Valid
Male 50 50.0 50.0 50.0
Female 50 50.0 50.0 100.0
Total 100 100.0 100.0
have rice.
Number of male and female customers of Smile clinic
Statistics
Gender
N
Valid 100
Missing 0
Gender
Frequency Percent Valid Percent Cumulative
Percent
Valid
Male 50 50.0 50.0 50.0
Female 50 50.0 50.0 100.0
Total 100 100.0 100.0
Paraphrase This Document
Need a fresh take? Get an instant paraphrase of this document with our AI Paraphraser
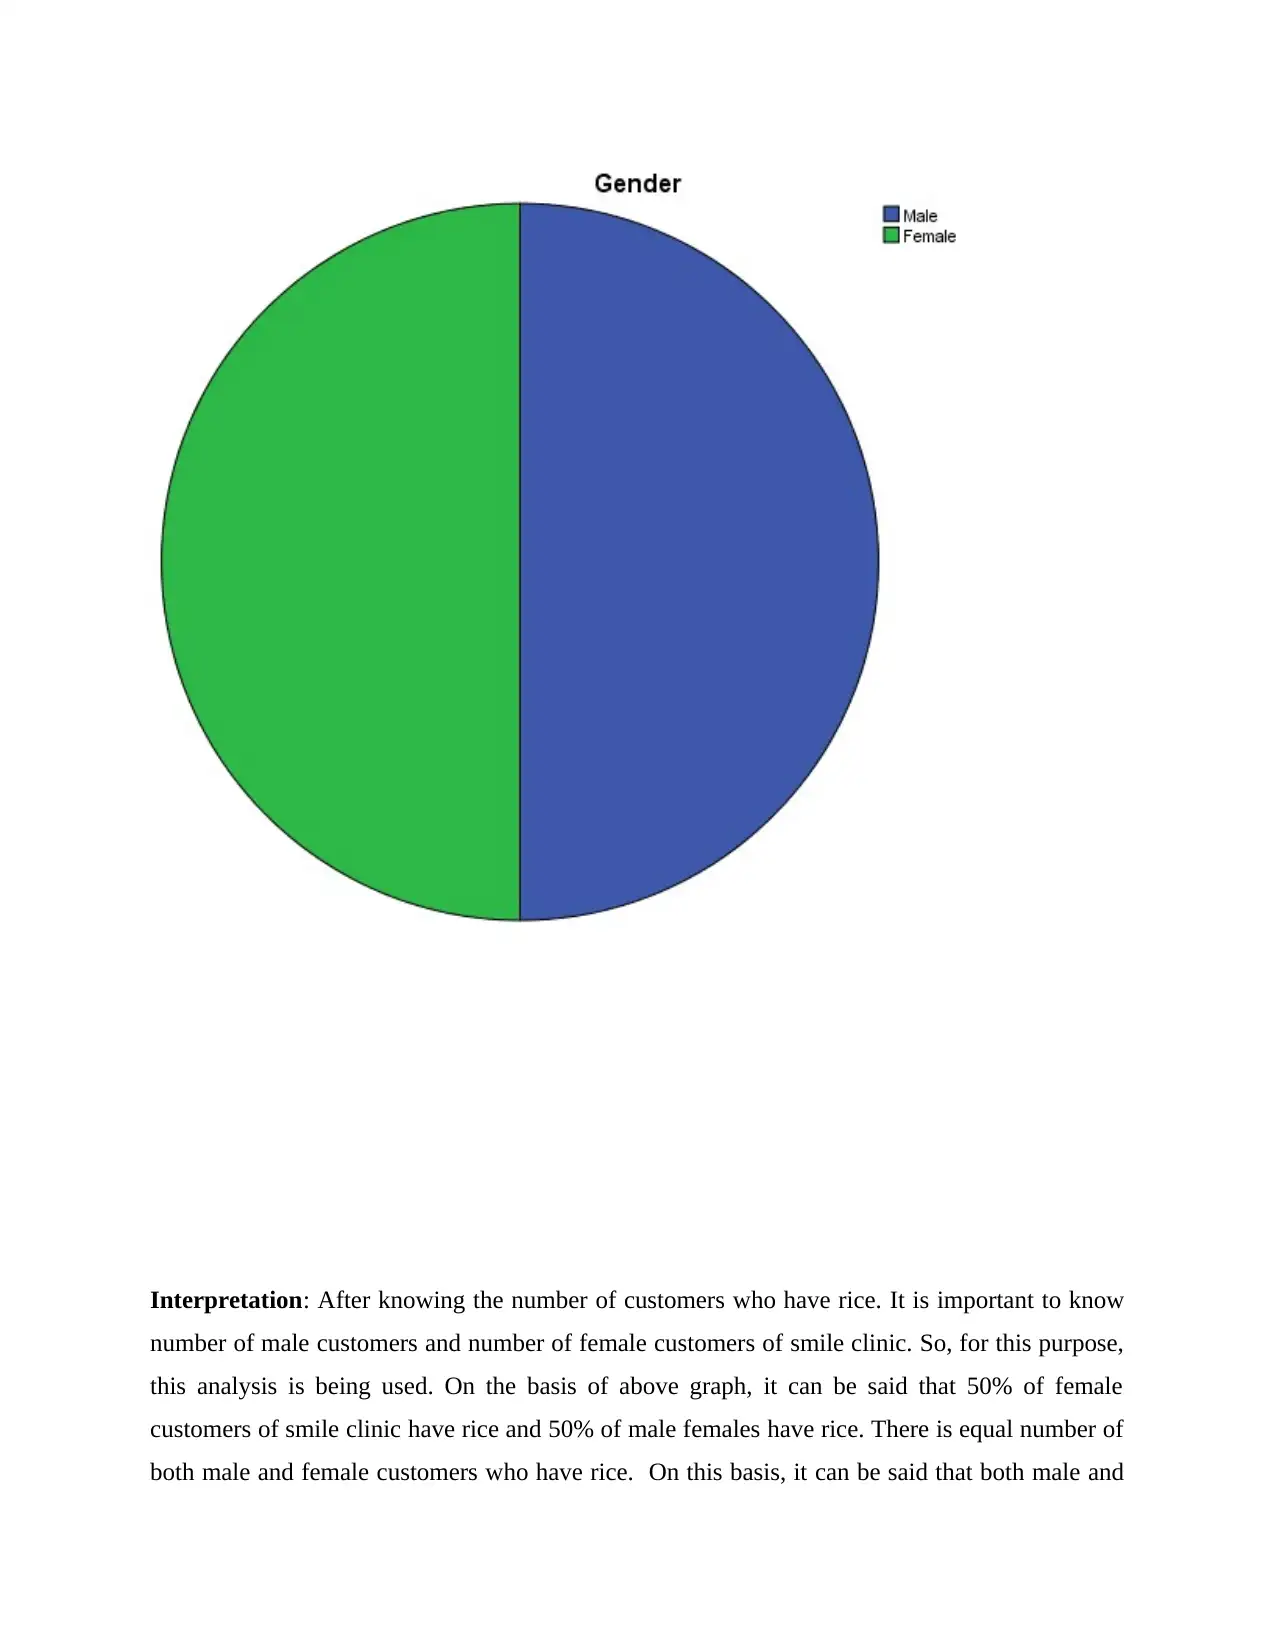
Interpretation: After knowing the number of customers who have rice. It is important to know
number of male customers and number of female customers of smile clinic. So, for this purpose,
this analysis is being used. On the basis of above graph, it can be said that 50% of female
customers of smile clinic have rice and 50% of male females have rice. There is equal number of
both male and female customers who have rice. On this basis, it can be said that both male and
female are suffering from poor health due to not having nutritional values of food. So, in this
context, it can be said that both male and females need to have nutritional values of food in order
to improve their overall health. One of the best things that healthcare professional of smile clinic
can suggest to its customers is not to eat rice to the great extent.
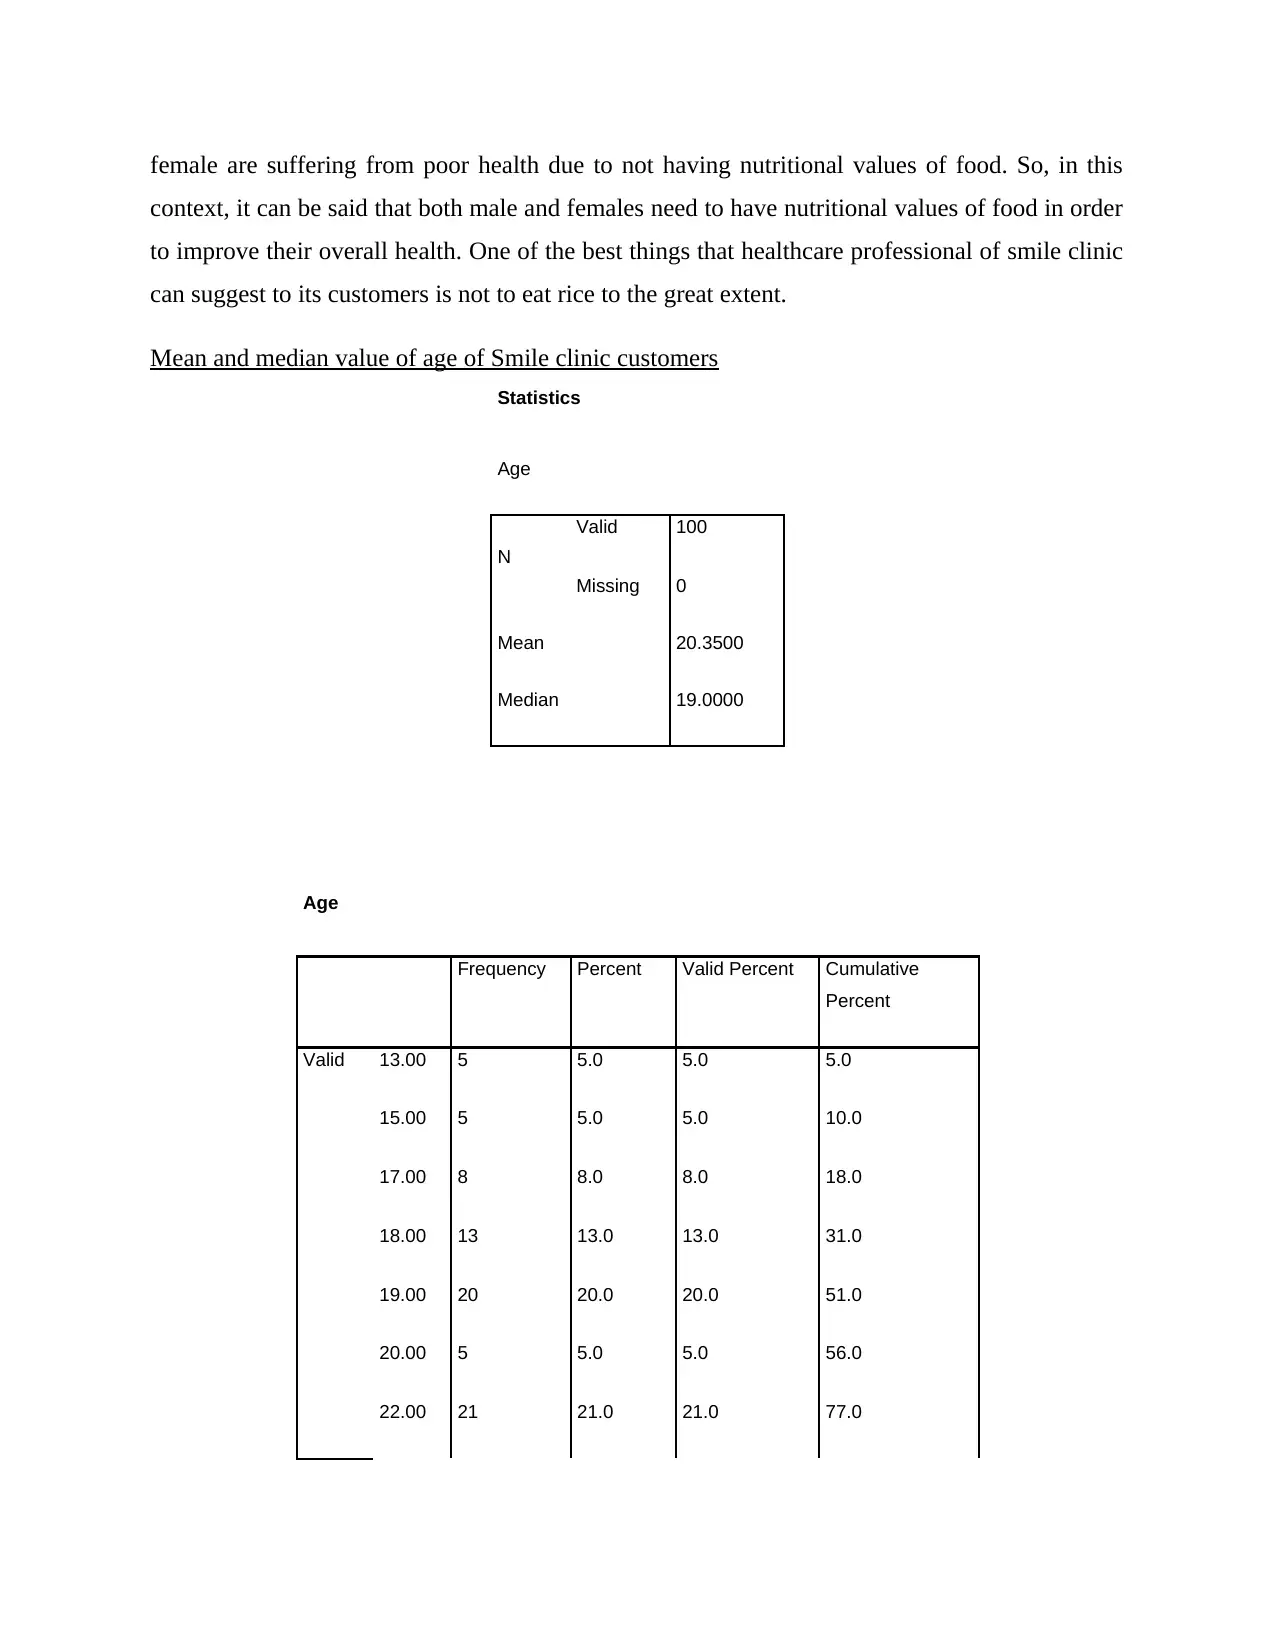
Mean and median value of age of Smile clinic customers
Statistics
Age
N
Valid 100
Missing 0
Mean 20.3500
Median 19.0000
Age
Frequency Percent Valid Percent Cumulative
Percent
Valid 13.00 5 5.0 5.0 5.0
15.00 5 5.0 5.0 10.0
17.00 8 8.0 8.0 18.0
18.00 13 13.0 13.0 31.0
19.00 20 20.0 20.0 51.0
20.00 5 5.0 5.0 56.0
22.00 21 21.0 21.0 77.0
context, it can be said that both male and females need to have nutritional values of food in order
to improve their overall health. One of the best things that healthcare professional of smile clinic
can suggest to its customers is not to eat rice to the great extent.
Mean and median value of age of Smile clinic customers
Statistics
Age
N
Valid 100
Missing 0
Mean 20.3500
Median 19.0000
Age
Frequency Percent Valid Percent Cumulative
Percent
Valid 13.00 5 5.0 5.0 5.0
15.00 5 5.0 5.0 10.0
17.00 8 8.0 8.0 18.0
18.00 13 13.0 13.0 31.0
19.00 20 20.0 20.0 51.0
20.00 5 5.0 5.0 56.0
22.00 21 21.0 21.0 77.0
⊘ This is a preview!⊘
Do you want full access?
Subscribe today to unlock all pages.
Trusted by 1+ million students worldwide
1 out of 18
Related Documents


Your All-in-One AI-Powered Toolkit for Academic Success.
+13062052269
info@desklib.com
Available 24*7 on WhatsApp / Email
![[object Object]](/_next/static/media/star-bottom.7253800d.svg)
Unlock your academic potential
Copyright © 2020–2026 A2Z Services. All Rights Reserved. Developed and managed by ZUCOL.