Business Intelligence: Visual DSS, Power BI and Case Study Analysis
Added on 2023-06-13
17 Pages2688 Words248 Views
Running head: BUSINESS INTELLIGENCE
Assessment item 1 – Assignment 1
Student Name:
University Name:
Assessment item 1 – Assignment 1
Student Name:
University Name:

1BUSINESS INTELLIGENCE
Table of Contents
Part A – Visual DSS........................................................................................................................2
Question 1 Solution.....................................................................................................................2
Results analysis........................................................................................................................3
Question 2 Solution.....................................................................................................................3
Results analysis........................................................................................................................5
Question 3 Solution.....................................................................................................................6
Results analysis........................................................................................................................7
Part B – Power BI............................................................................................................................8
Solution for Demonstration 1......................................................................................................8
First dashboard.........................................................................................................................8
Second dashboard....................................................................................................................8
Answer to questions.................................................................................................................9
Solution for Demonstration 2......................................................................................................9
First dashboard.........................................................................................................................9
Second dashboard..................................................................................................................10
Answer to questions...............................................................................................................10
Part C – Case Study Analysis........................................................................................................11
Introduction................................................................................................................................11
Smart, connected products contribute to business analytics......................................................11
Smart, connected products help to transform companies by using business intelligence.........13
Conclusion.................................................................................................................................14
Bibliography..................................................................................................................................15
2BUSINESS INTELLIGENCE
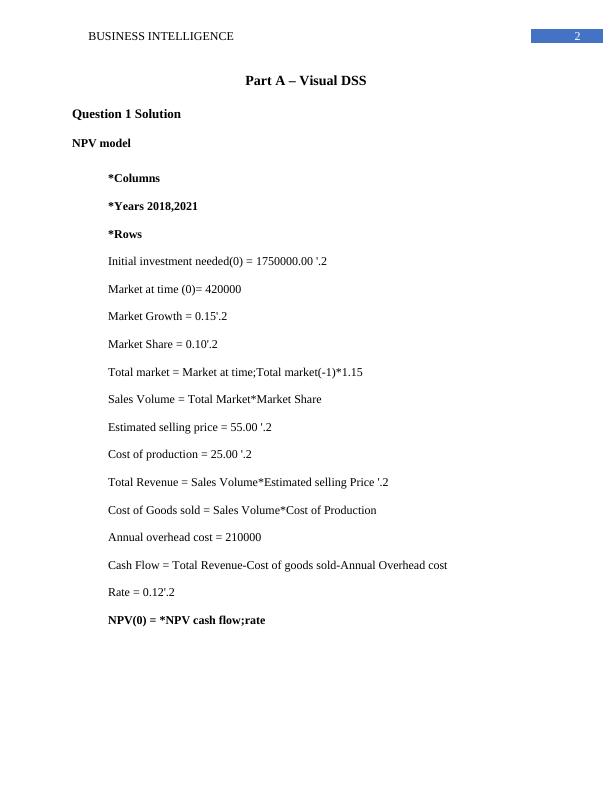
Part A – Visual DSS
Question 1 Solution
NPV model
*Columns
*Years 2018,2021
*Rows
Initial investment needed(0) = 1750000.00 '.2
Market at time (0)= 420000
Market Growth = 0.15'.2
Market Share = 0.10'.2
Total market = Market at time;Total market(-1)*1.15
Sales Volume = Total Market*Market Share
Estimated selling price = 55.00 '.2
Cost of production = 25.00 '.2
Total Revenue = Sales Volume*Estimated selling Price '.2
Cost of Goods sold = Sales Volume*Cost of Production
Annual overhead cost = 210000
Cash Flow = Total Revenue-Cost of goods sold-Annual Overhead cost
Rate = 0.12'.2
NPV(0) = *NPV cash flow;rate
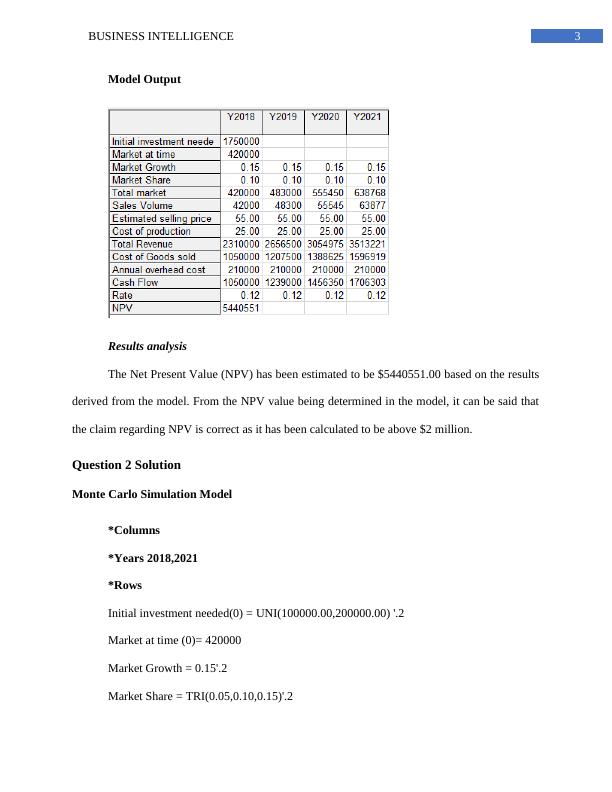
3BUSINESS INTELLIGENCE
Model Output
Results analysis
The Net Present Value (NPV) has been estimated to be $5440551.00 based on the results
derived from the model. From the NPV value being determined in the model, it can be said that
the claim regarding NPV is correct as it has been calculated to be above $2 million.
Question 2 Solution
Monte Carlo Simulation Model
*Columns
*Years 2018,2021
*Rows
Initial investment needed(0) = UNI(100000.00,200000.00) '.2
Market at time (0)= 420000
Market Growth = 0.15'.2
Market Share = TRI(0.05,0.10,0.15)'.2
End of preview
Want to access all the pages? Upload your documents or become a member.
Related Documents
Business Intelligence - Assignment 1lg...
|11
|1116
|453
Business Intelligence and Smart Connected Productslg...
|16
|2307
|315
Business Intelligence: Smart, Connected Products Transforming Competitionlg...
|16
|2848
|436
Business intelligence assignment : Cloud-Pty Limitedlg...
|18
|3303
|43
Business Intelligence Assignment PDFlg...
|17
|3202
|104
Analysis of Noccio Chocolate Company: Determination of Revenue, Cost, Product Mix and Constraintslg...
|19
|2586
|289