Comparative Business Report: Sainsbury's and Morrison's Analysis
VerifiedAdded on 2023/01/16
|12
|2781
|67
Report
AI Summary
This report provides a comparative analysis of Sainsbury's and Morrison's, two major supermarket chains in the United Kingdom. It delves into the core aspects of business management, focusing on financial ratio analysis to evaluate the companies' performance. The report examines profitability...

Business Management
Paraphrase This Document
Need a fresh take? Get an instant paraphrase of this document with our AI Paraphraser
Table of Contents
INTRODUCTION...........................................................................................................................1
MAIN BODY...................................................................................................................................1
Financial ratio Analysis...............................................................................................................1
Performance Factors....................................................................................................................4
CONCLUSION................................................................................................................................5
REFERENCES................................................................................................................................6
APPENDIX......................................................................................................................................7
INTRODUCTION
The organization and coordination of different types of activities of a business in respect
to accomplish all defined objectives. In the management involves all the functions that use by
business to create corporate policy and organizing, planning, controlling and directing business
resources to accomplish set objectives in certain period of time (Binder, 2016). In the business
management requires the activity of the firm's resources in the most effective way. This report
based on the two companies such as Sainsbury or Morrison. Sainsbury is third largest retail
sector organisation in the United Kingdom. The company has been dealing into hypermarket,
convenience, supermarket and forecourt shop. It was founded in 1869 by John James Sainsbury.
The products of the company clothing, foods, groceries and many others. The headquarter of the
business established in 33, Holborn, London, United Kingdom. In past the company remain in
trends for the general and pick up options. merchandise and clothing offers provide online and
provide wide range of selection On the other side Morrison is fourth largest supermarket in the
United kingdom. It was founded in 1899 by William Morrison. The company has been operating
into food & drink, clothing, books, magazines, CDs and DVDs. The aim of the report to compare
financial activity of the both business to know actual position and which is best supermarket. In
this report analysis financial ratio of both company and determine which are financial and non
financial factors impact on the performance in positive as well as negative manner.
MAIN BODY
Financial ratio Analysis
Profitability Ratio: It is a class of financial metrics that are utilised by business to know
their efficiency to generate earnings that link with the revenues, operating costs, balance sheet
assets and using data from a specific point in time. There are consisting different types of ratio
that calculated to know efficiency of Sainsbury and Morrison.
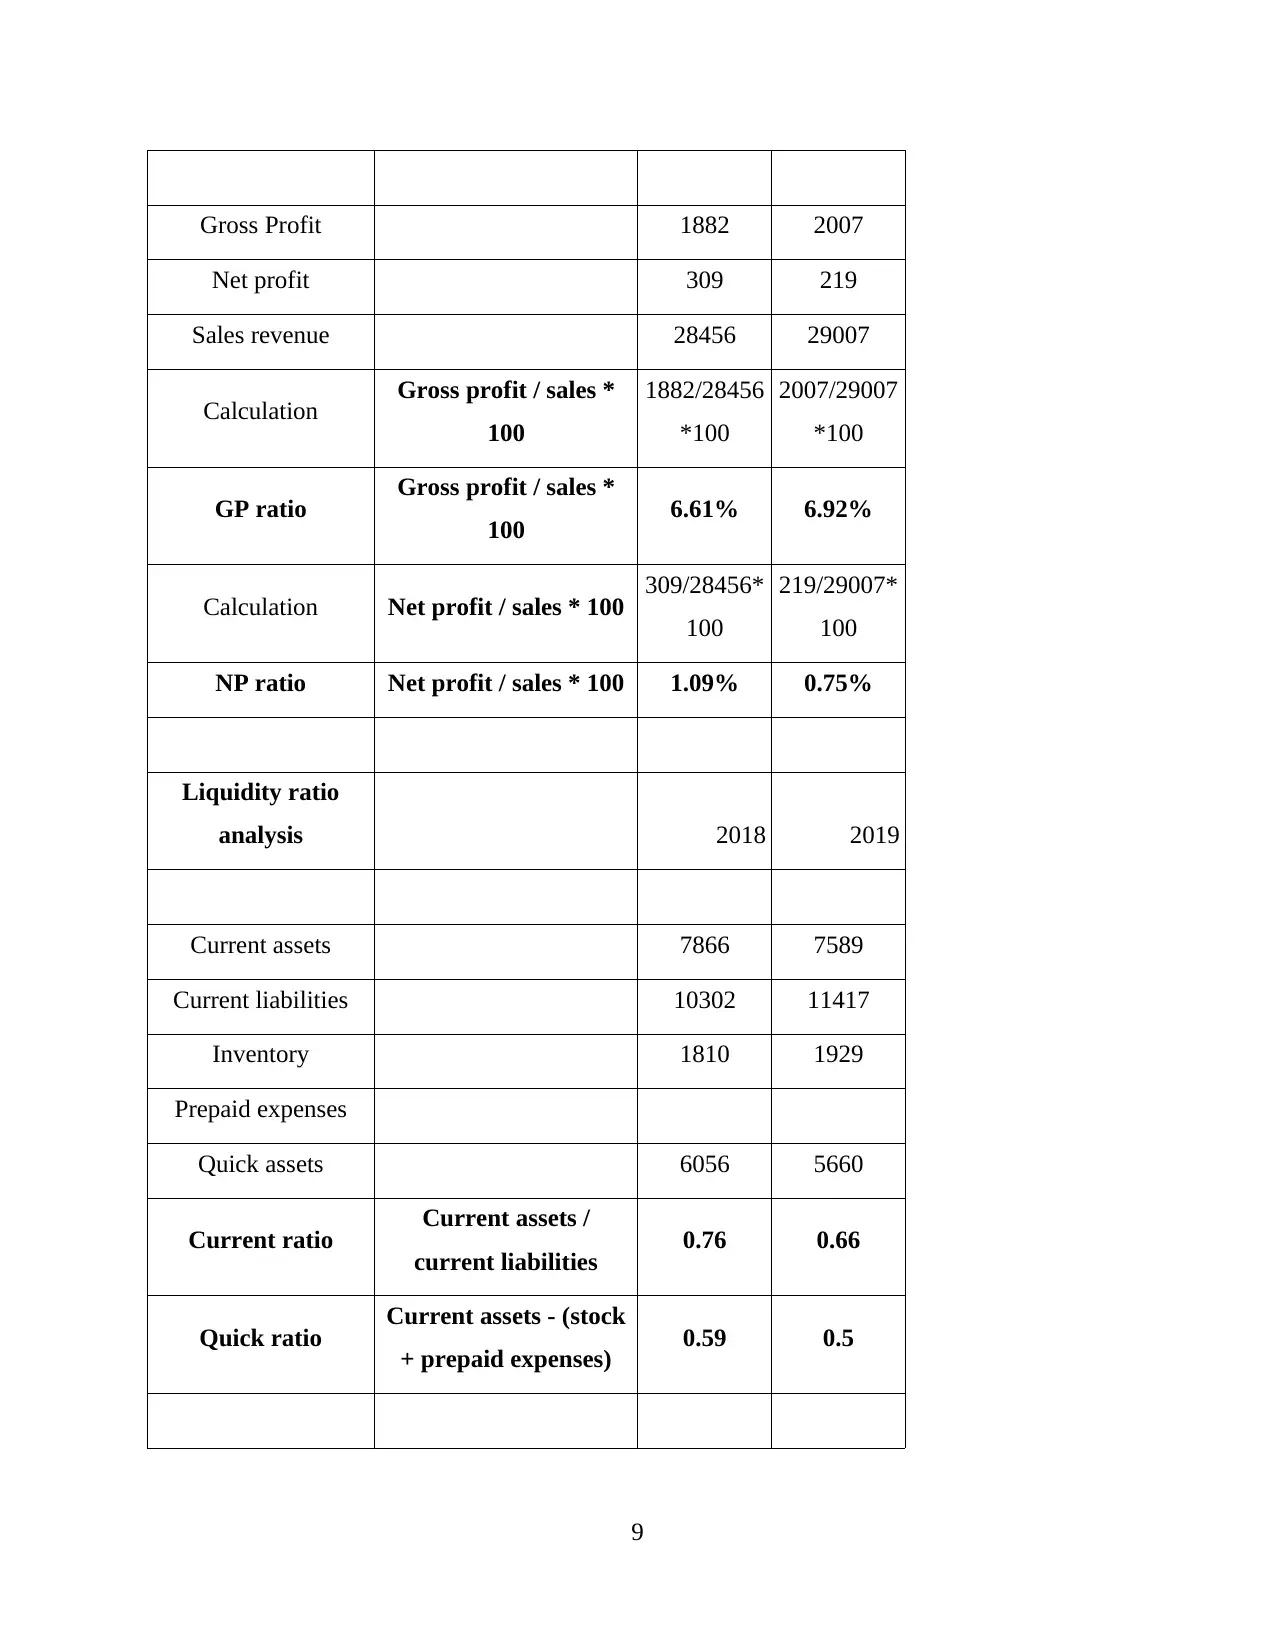
Sainsbury Gross Profit Margin: As per the calculation it is interpreted that the gross profit
calculated by gross profit and net sales. For this apply the formula of gross
profit/sales*100. The company profit increase from 2018 to 2018 which was 1882 to
2007. The net sales of the business 28456 in 2018 & 29007 in 2019. So gross profit ratio
1
The organization and coordination of different types of activities of a business in respect
to accomplish all defined objectives. In the management involves all the functions that use by
business to create corporate policy and organizing, planning, controlling and directing business
resources to accomplish set objectives in certain period of time (Binder, 2016). In the business
management requires the activity of the firm's resources in the most effective way. This report
based on the two companies such as Sainsbury or Morrison. Sainsbury is third largest retail
sector organisation in the United Kingdom. The company has been dealing into hypermarket,
convenience, supermarket and forecourt shop. It was founded in 1869 by John James Sainsbury.
The products of the company clothing, foods, groceries and many others. The headquarter of the
business established in 33, Holborn, London, United Kingdom. In past the company remain in
trends for the general and pick up options. merchandise and clothing offers provide online and
provide wide range of selection On the other side Morrison is fourth largest supermarket in the
United kingdom. It was founded in 1899 by William Morrison. The company has been operating
into food & drink, clothing, books, magazines, CDs and DVDs. The aim of the report to compare
financial activity of the both business to know actual position and which is best supermarket. In
this report analysis financial ratio of both company and determine which are financial and non
financial factors impact on the performance in positive as well as negative manner.
MAIN BODY
Financial ratio Analysis
Profitability Ratio: It is a class of financial metrics that are utilised by business to know
their efficiency to generate earnings that link with the revenues, operating costs, balance sheet
assets and using data from a specific point in time. There are consisting different types of ratio
that calculated to know efficiency of Sainsbury and Morrison.
Sainsbury Gross Profit Margin: As per the calculation it is interpreted that the gross profit
calculated by gross profit and net sales. For this apply the formula of gross
profit/sales*100. The company profit increase from 2018 to 2018 which was 1882 to
2007. The net sales of the business 28456 in 2018 & 29007 in 2019. So gross profit ratio
1
You're viewing a preview
Unlock full access by subscribing today!


of the company 6.61% in 2018 and 6.92% in 2019. There is identified increment in the
ratio in positive manner.
Net profit ratio: To calculate this ratio apply the formula which is net profit/sales*100. In
the year 2018 company have 309 net profit which is decreasing and reach on 219 in 2019.
So after the calculation get results are 1.09% in 2018 & 0.75% in 2019 that was
decreased as compare of 2018 due to reduce amount of the net profit.
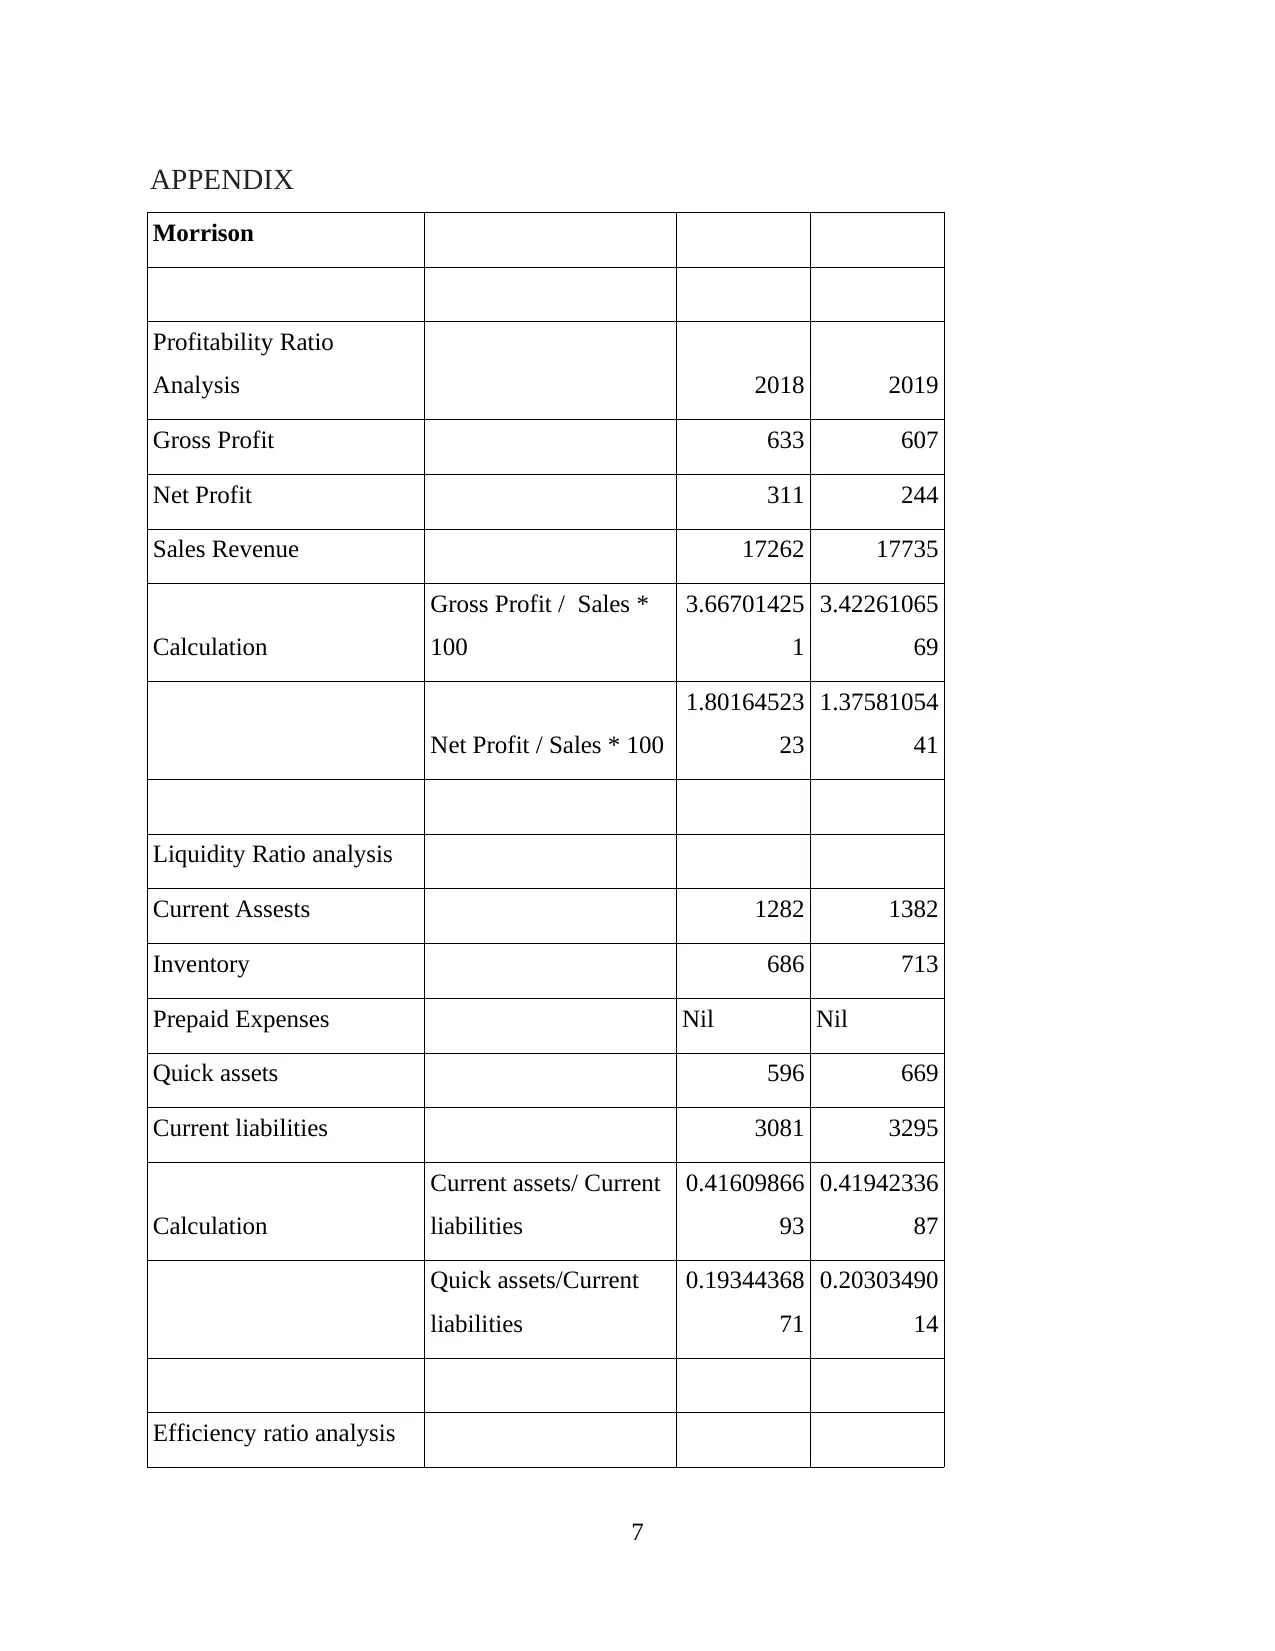
Morrison Gross Profit ratio: To analysis the ratio of Morrison apply authentic formula and get the
result that 3.66 in 2018 and 3.42 in 2019 which is increased as compare with the 2018.
The reason behind that decreasing gross profit of the company.
Net Profit Ratio: As per the calculation it is getting that sales of the company increase in
the year of 2019 as compare in 2018 which is 17262 to 17735. It impact on the ratio
calculation which is decreased such as 1.80 in 2018 and 1.37 in 2019. It is not good for
the organisation.
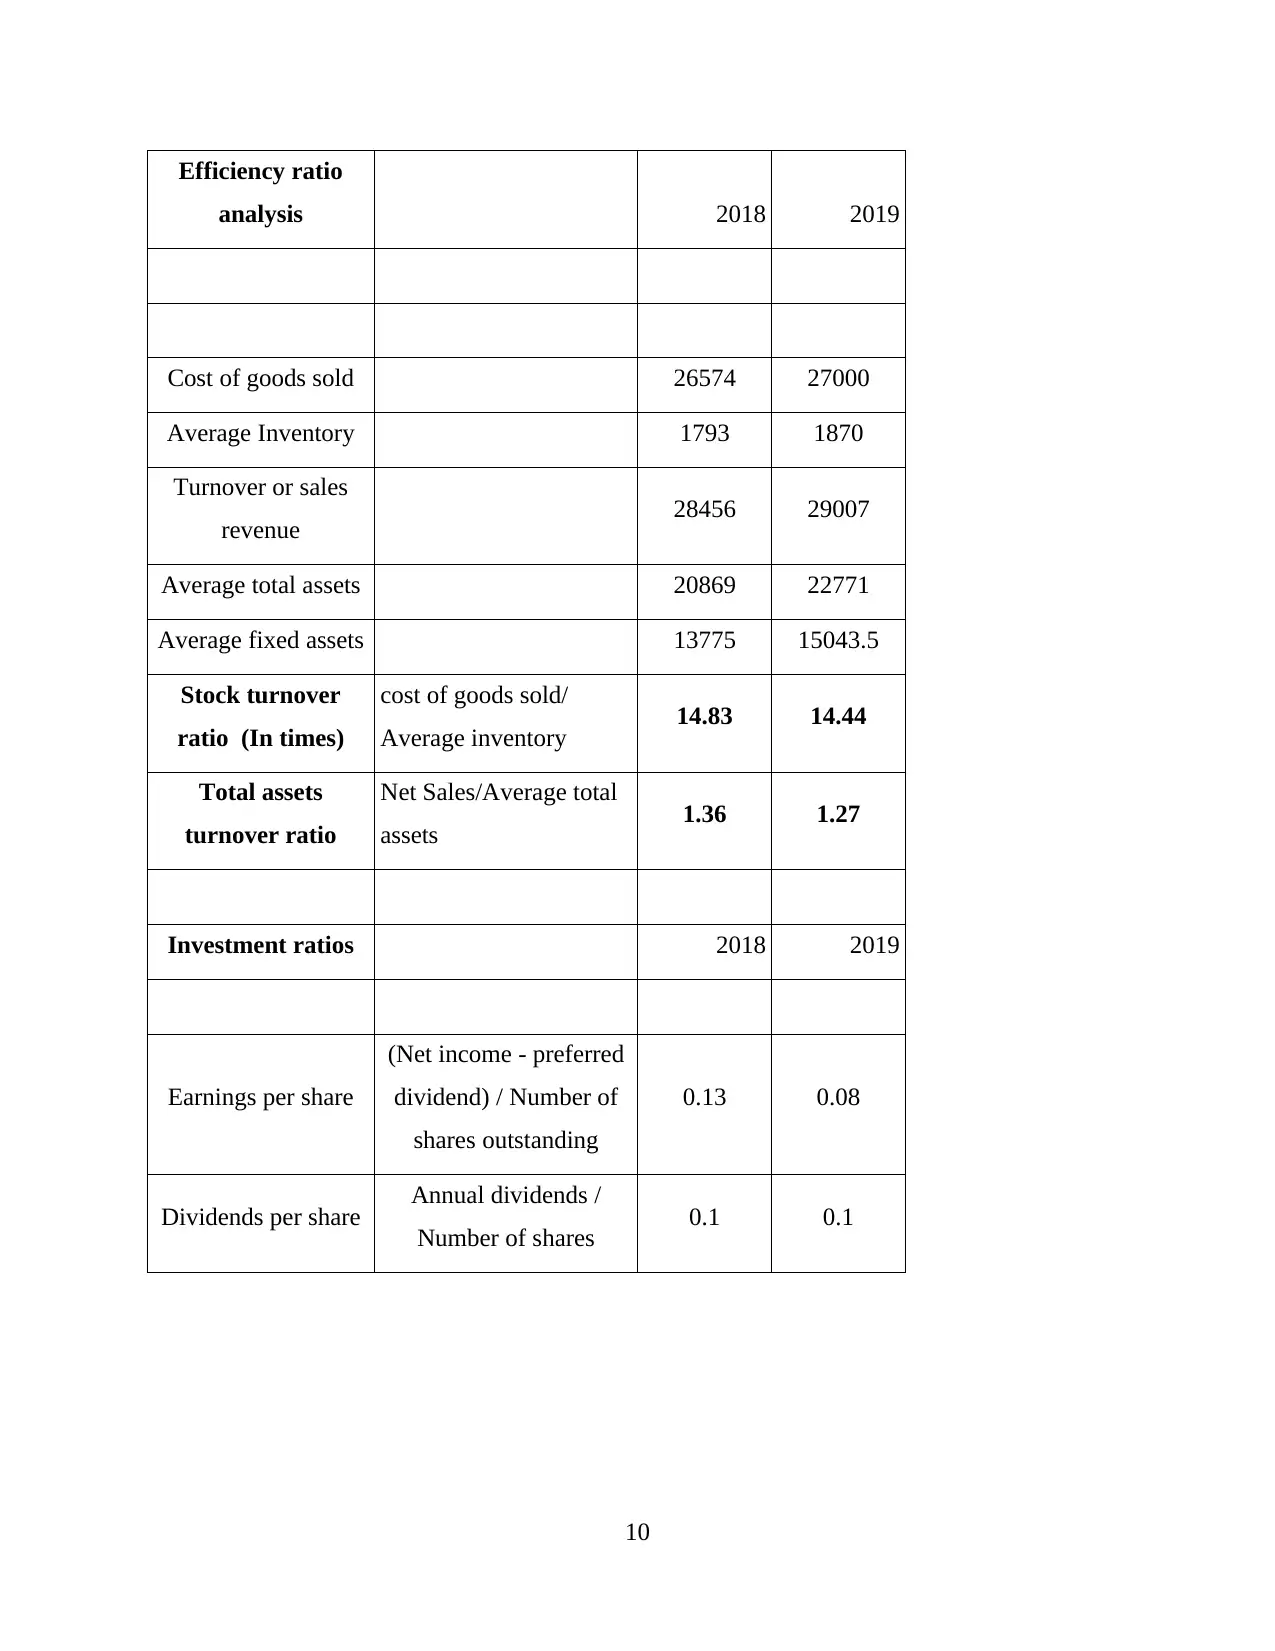
Efficiency Ratio: These types of ratio calculated by business to examine how well
business uses its assets as well as liabilities at internally level. There are consisting of turn over,
liabilities and usage of equity etc. To understand the efficiency of business calculate this ratio of
Sainsbury and Morrison.
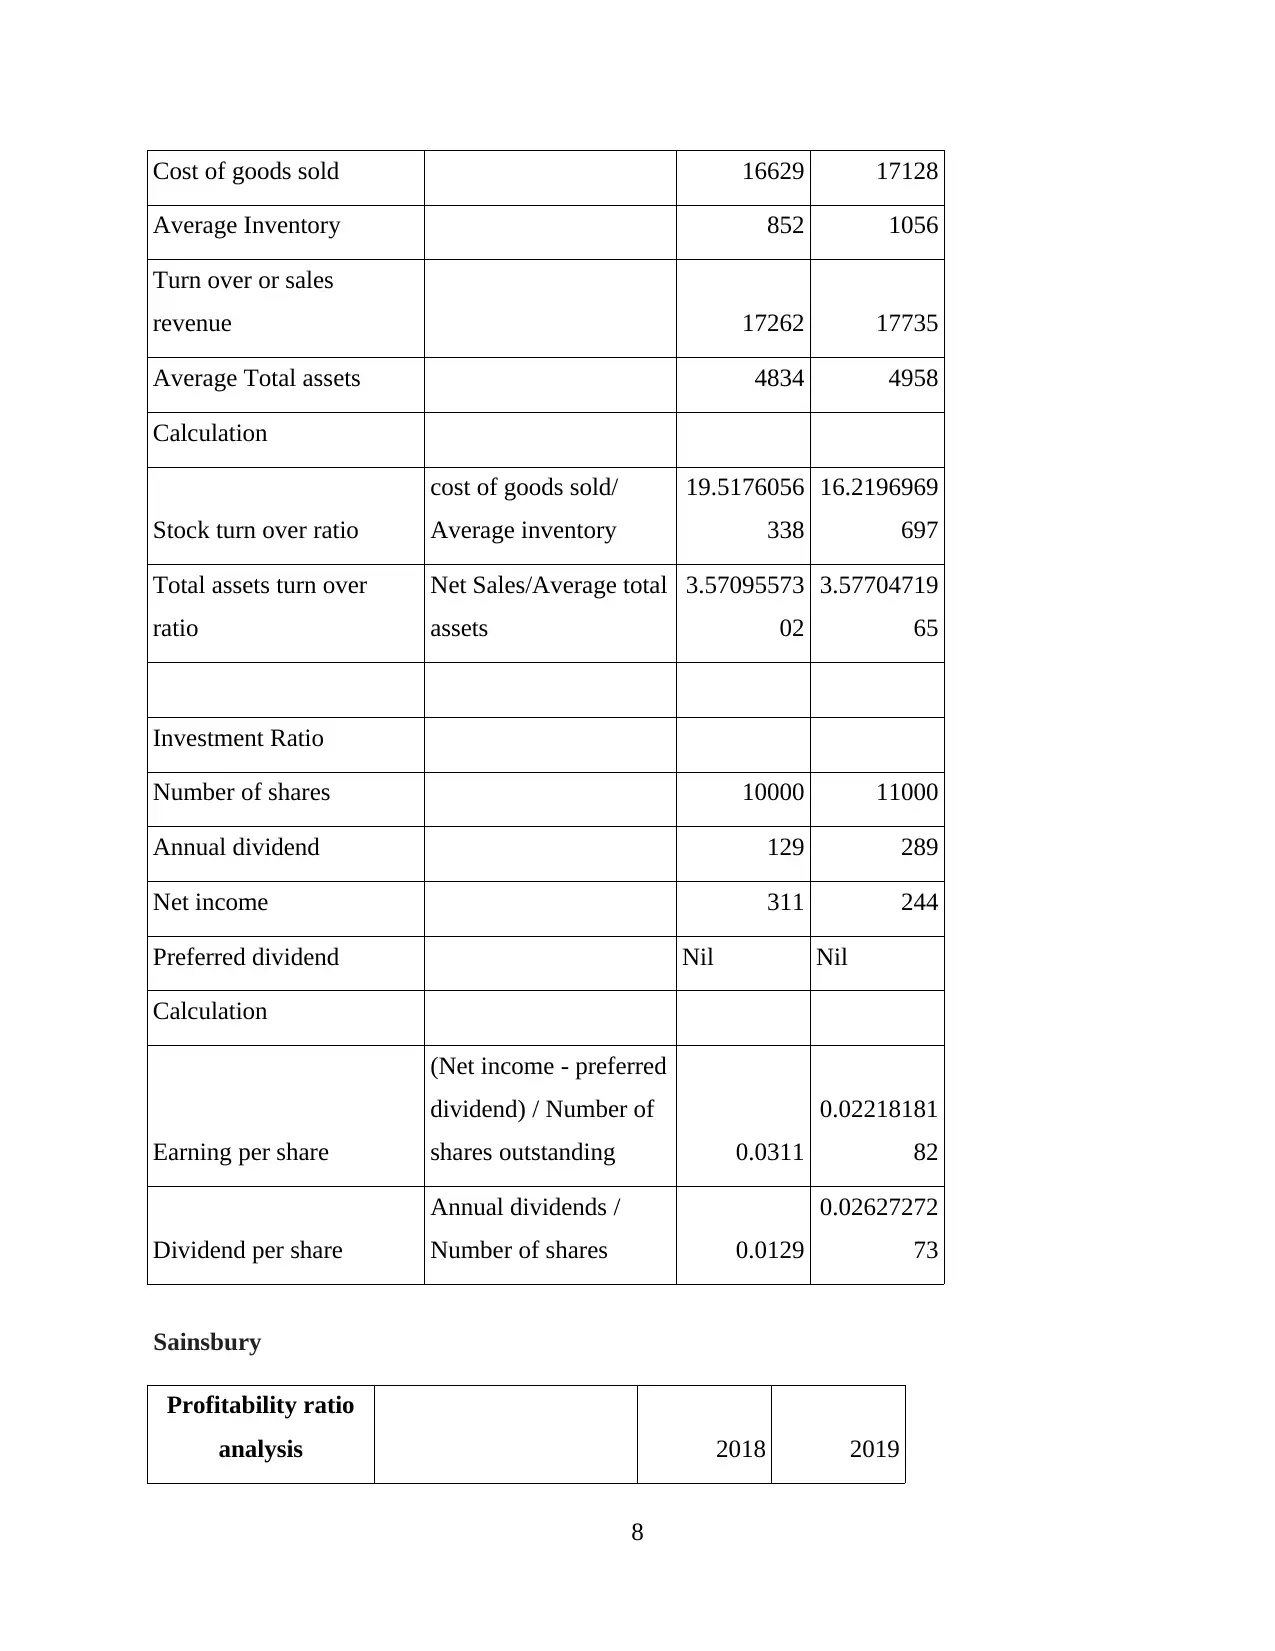
Sainsbury Stock turn over ratio: As per the calculation of calculate time that in which time turn
over increase of an organisation. To calculate this ratio apply formula of cost of goods
sold/ Average inventory. Cost of the goods sold increase in 2019 as compare of 2018 so it
impact on the average inventory which is also increase by 77. The results are 14.83 times
in 2018 and 14.44 times in 2019. It is good sign for the business due to reduce stock turn
over of Sainsbury.
Total assets turn over ratio: To compute this ratio apply the formula of Net
sales/Average total assets of the business. The company have sales about 28456 in 2018
and 29007 in 2019 and average total assets 20869, 22771 respectively. So ratio of the
company about 1.36 & 1.27 in the year of 2018 & 2019.
Morrison
2
ratio in positive manner.
Net profit ratio: To calculate this ratio apply the formula which is net profit/sales*100. In
the year 2018 company have 309 net profit which is decreasing and reach on 219 in 2019.
So after the calculation get results are 1.09% in 2018 & 0.75% in 2019 that was
decreased as compare of 2018 due to reduce amount of the net profit.
Morrison Gross Profit ratio: To analysis the ratio of Morrison apply authentic formula and get the
result that 3.66 in 2018 and 3.42 in 2019 which is increased as compare with the 2018.
The reason behind that decreasing gross profit of the company.
Net Profit Ratio: As per the calculation it is getting that sales of the company increase in
the year of 2019 as compare in 2018 which is 17262 to 17735. It impact on the ratio
calculation which is decreased such as 1.80 in 2018 and 1.37 in 2019. It is not good for
the organisation.
Efficiency Ratio: These types of ratio calculated by business to examine how well
business uses its assets as well as liabilities at internally level. There are consisting of turn over,
liabilities and usage of equity etc. To understand the efficiency of business calculate this ratio of
Sainsbury and Morrison.
Sainsbury Stock turn over ratio: As per the calculation of calculate time that in which time turn
over increase of an organisation. To calculate this ratio apply formula of cost of goods
sold/ Average inventory. Cost of the goods sold increase in 2019 as compare of 2018 so it
impact on the average inventory which is also increase by 77. The results are 14.83 times
in 2018 and 14.44 times in 2019. It is good sign for the business due to reduce stock turn
over of Sainsbury.
Total assets turn over ratio: To compute this ratio apply the formula of Net
sales/Average total assets of the business. The company have sales about 28456 in 2018
and 29007 in 2019 and average total assets 20869, 22771 respectively. So ratio of the
company about 1.36 & 1.27 in the year of 2018 & 2019.
Morrison
2
Paraphrase This Document
Need a fresh take? Get an instant paraphrase of this document with our AI Paraphraser
Stock Turn over ratio: To analysis the performance of the business calculate this ratio
where analysis the stock of the business. There are putting amount in the formula and get
amount 19.51 times in 2018 and 16.22 in 2019 which is decreasing as compare of 2018. it
shows good performance due to increase cost of sales of business.
Total assets turn over ratio: To calculate this ration compute average total assets and
amount put in the formula which is Net sales/ average total assets. The sales revenue of
the company increase in 2019 and average total assets also 4834 to 4958 respectively.
After the computation get result that 3.57 in 2018 and 3.58 in 2019 so there is not more
differences.
Liquidity Ratio: It is a measurement tool that apply by the organisations to know ability
of business to pay off its short term responsibilities without rake amount from external parties. It
is important tool of financial activities. There are calculate current and quick ratio of Sainsbury
and Morrison.
Sainsbury Current Ratio: As per the calculation it is analysed that current assets of the Sainsbury
decrease in 2019 as compare of 2018 about 277. The current liabilities increased in 2019
due to increase obligation of company. In 2018 had 10302 that increase and reach on
11417 in 2019. After put the ratio get results that 0.76 in 2018 and 0.66 in 2019 but in
both year company does not reach on ideal ratio which 2:1.
Quick Ratio: To calculate this ration from current assets less amount of the stock and
prepaid expenses and get quick assets. To calculate this ratio put formula of quick
assets/current liabilities. The company have quick assets 6056 in 2018 & 5660 in 2019.
The results are 0.59 & 0.50 in 2018 & 2019. In the year 2019 get less result as compare
of 2018 and both are not reaching on ideas ratio of 1:1.
Morrison Current Ratio: To calculate this ratio require current assets and current liabilities and get
results that in 2018, 0.41 & in 2019, 0.42 so there is no major different due to no major
increment in the current assets. This ratio is not reach near about the ideal ratio so it
means company have not good liquidity.
3
Quick Ratio: To calculate quick assets from current assets less amount stock and get
ratio 0.19 in 2018 and 0.20 in 2019. This ratio is not reaching the ideal ratio which is not
good for the business.
Investment Ratio: To analysis the performance of company by shares use this ratio.
There involves earning per share, price earning ratio and many others. There are calculated
different ration in regard of investment to know profitability of Sainsbury and Morrison.
Sainsbury: Earning per share: The company have good net income and numbers of share to
calculate this ration. After apply the formula getting results that in 2018 have 0.13 and in
2019 have 0.08 which is decreasing in compare of 2018 which is not good for the
management of company.
Dividends per share: To calculate this apply the formula of Annual dividends/ number of
shares where put the amount and get results that 0.1 in 2018 & 0.1 in 2019 so there is not
coming any changes because of fixed rate of dividend that is good for the investors.
Morrison Earning Per share: It is decreasing of the company that is not good for the business and
investors are not invest in the company and take amount back. Through calculation get
results 0.031 in 2018 and 0.022 in 2019 that not shows good performance of the business.
Dividend per share: In the year company haver 0.0129 dividend and in 2019 have 0.026
that shows that increase dividend amount and stakeholders satisfy with that.
Compare in Both Companies: After analysis the both company ratio it is getting that it
is required to compare ratio in internally and externally basis. Such as comparison supports to
identify trends like Sainsbury should control the flow of inventories or amount of dividends of
stakeholders. Through financial ratio know that Profit margin of the company decrease in the
year of 2019 as compare of 2018 but sales of the company is increased that become strength for
the business. The data presents that financial performance of Sainsbury and Morrison majorly
derived in the year of 2018 & 19. Moreover Morrison profitability less than to Sainsbury due to
less sales of the company and decrease in the year of 2019 as compare of 2018.
Performance Factors
Financial factors: These factors are related with the financial activities that impact on
the performance and help to analysis financial stability of the business (Bider and Jalali, 2016).
4
You're viewing a preview
Unlock full access by subscribing today!
To analysis the position of an organisation focus on the variables to forecast the intrinsic value of
the business. There are defining different factors that impact on the Sainsbury and Morrison such
as:
Profit margin: Through financial report it is analysed that the profit margin of the
business decreasing that impact on the performance and it occurred because reduce quantity of
the products that impact on the sales of business.
Tax rate: On the different products apply different tax rate according to UK government
and company also apply State tax that impact on the price of products. If tax rate increase by the
government so impact on the products price and decrease sales of the business because every one
not afford high cost.
Non Financial Factors: These factors are not related with the financial activities but
affect the performance of the business in positive or negative way. It is required to analysis those
factors that direct impact on the business ad use to analysis the efficiency.
Organisation Management: To manage different operations and activities of the
business use different types of techniques in order to carry out all the results. This factor impact
on the performance because organisation is not used in proper manner and use wrong techniques
as per the situation of the business.
Resource utilization: To increase sales require to proper utilise resources and reduce
wastages so for this require to apply inventory management system that track the record of stock.
These organisation are using this system so both are effectively sale out the products and have
records so it work in positive manner for the business (Choi, Chan and Yue, 2016).
CONCLUSION
As per the above discussion it is concluded that to carry out different function of the
business in front of stakeholders and investors require to manage every activities in effective
manner. To present actual position of the business prepare financial statement where consist of
balance sheet & cash flow statement. To analysis the changes year on year calculate different
types of financial ratios that shows all the changes in different items effectively. There are
calculated ratio of both companies and getting that Sainsbury have good efficiency as compare of
the Morrison in the year of 2018 to 2019. Along with identified profit margin, tax rate as
financial factors that impact on the business activities and company management and other are
non financial factors.
5
Paraphrase This Document
Need a fresh take? Get an instant paraphrase of this document with our AI Paraphraser
REFERENCES
Books and Journal
Bider, I. and Jalali, A., 2016. Agile business process development: why, how and when—
applying Nonaka’s theory of knowledge transformation to business process
development. Information Systems and e-Business Management. 14(4). pp.693-731.
Binder, J., 2016. Global project management: communication, collaboration and management
across borders. Routledge.
Choi, T. M., Chan, H. K. and Yue, X., 2016. Recent development in big data analytics for
business operations and risk management. IEEE transactions on cybernetics. 47(1).
pp.81-92.
Ogbari, M. E. and et. al, 2016. Entrepreneurship and business ethics: Implications on corporate
performance. International Journal of Economics and Financial Issues. 6(3S). pp.50-
58.
Razak, N. A. and et. al, 2016. Theories of knowledge sharing behavior in business
strategy. Procedia Economics and Finance. 37. pp.545-553.
Wirtz, B. W., Pistoia, A., Ullrich, S. and Göttel, V., 2016. Business models: Origin,
development and future research perspectives. Long range planning. 49(1). pp.36-54.
Zhu, Q., Qu, Y., Geng, Y. and Fujita, T., 2017. A comparison of regulatory awareness and green
supply chain management practices among Chinese and Japanese
manufacturers. Business Strategy and the Environment. 26(1). pp.18-30.
6
APPENDIX
Morrison
Profitability Ratio
Analysis 2018 2019
Gross Profit 633 607
Net Profit 311 244
Sales Revenue 17262 17735
Calculation
Gross Profit / Sales *
100
3.66701425
1
3.42261065
69
Net Profit / Sales * 100
1.80164523
23
1.37581054
41
Liquidity Ratio analysis
Current Assests 1282 1382
Inventory 686 713
Prepaid Expenses Nil Nil
Quick assets 596 669
Current liabilities 3081 3295
Calculation
Current assets/ Current
liabilities
0.41609866
93
0.41942336
87
Quick assets/Current
liabilities
0.19344368
71
0.20303490
14
Efficiency ratio analysis
7
You're viewing a preview
Unlock full access by subscribing today!
Cost of goods sold 16629 17128
Average Inventory 852 1056
Turn over or sales
revenue 17262 17735
Average Total assets 4834 4958
Calculation
Stock turn over ratio
cost of goods sold/
Average inventory
19.5176056
338
16.2196969
697
Total assets turn over
ratio
Net Sales/Average total
assets
3.57095573
02
3.57704719
65
Investment Ratio
Number of shares 10000 11000
Annual dividend 129 289
Net income 311 244
Preferred dividend Nil Nil
Calculation
Earning per share
(Net income - preferred
dividend) / Number of
shares outstanding 0.0311
0.02218181
82
Dividend per share
Annual dividends /
Number of shares 0.0129
0.02627272
73
Sainsbury
Profitability ratio
analysis 2018 2019
8
Paraphrase This Document
Need a fresh take? Get an instant paraphrase of this document with our AI Paraphraser
Gross Profit 1882 2007
Net profit 309 219
Sales revenue 28456 29007
Calculation Gross profit / sales *
100
1882/28456
*100
2007/29007
*100
GP ratio Gross profit / sales *
100 6.61% 6.92%
Calculation Net profit / sales * 100 309/28456*
100
219/29007*
100
NP ratio Net profit / sales * 100 1.09% 0.75%
Liquidity ratio
analysis 2018 2019
Current assets 7866 7589
Current liabilities 10302 11417
Inventory 1810 1929
Prepaid expenses
Quick assets 6056 5660
Current ratio Current assets /
current liabilities 0.76 0.66
Quick ratio Current assets - (stock
+ prepaid expenses) 0.59 0.5
9
Efficiency ratio
analysis 2018 2019
Cost of goods sold 26574 27000
Average Inventory 1793 1870
Turnover or sales
revenue 28456 29007
Average total assets 20869 22771
Average fixed assets 13775 15043.5
Stock turnover
ratio (In times)
cost of goods sold/
Average inventory 14.83 14.44
Total assets
turnover ratio
Net Sales/Average total
assets 1.36 1.27
Investment ratios 2018 2019
Earnings per share
(Net income - preferred
dividend) / Number of
shares outstanding
0.13 0.08
Dividends per share Annual dividends /
Number of shares 0.1 0.1
10
You're viewing a preview
Unlock full access by subscribing today!
1 out of 12
Related Documents


Your All-in-One AI-Powered Toolkit for Academic Success.
+13062052269
info@desklib.com
Available 24*7 on WhatsApp / Email
![[object Object]](/_next/static/media/star-bottom.7253800d.svg)
Unlock your academic potential
© 2024 | Zucol Services PVT LTD | All rights reserved.