Research Report on Pricing Strategies and Consumer Purchase Intention
VerifiedAdded on 2022/09/22
|31
|6589
|36
Report
AI Summary
This report presents a business marketing research study focusing on the influence of pricing strategies on consumer purchase intention within the grocery industry in the United Kingdom. The research employs an explanatory research design, utilizing a quantitative approach with data collected through online surveys from 100 respondents in London. The methodology includes stratified sampling and a structured questionnaire with questions on demographics, pricing strategies, and consumer purchase intentions. Data analysis involves SPSS and MS Excel, with Pearson's correlation and regression analysis to examine relationships between variables. The report details the reliability and validity of the data through Cronbach's alpha, KMO, and Bartlett's tests. The findings reveal an average mean response, and the results are linked to the literature review to form valid discussions. The report also adheres to ethical considerations, ensuring respondent privacy and data integrity. The study highlights key statistical results, descriptive statistics, and the correlation and regression analysis to prove the hypothesis mentioned in the literature review section. The report demonstrates a strong internal consistency and scale of the data gathered.
Running head: BUSINESS MARKETING
Business marketing
Name of the student
Name of the university
Author note
Business marketing
Name of the student
Name of the university
Author note
Paraphrase This Document
Need a fresh take? Get an instant paraphrase of this document with our AI Paraphraser
1BUSINESS MARKETING
CHAPTER 3: RESEARCH METHODOLOGY
3.1 INTRODUCTION
This chapter provides a detail description of the research methods,
frameworks and instruments used to gather and evaluate data. Choy (2014) states
that research methodology is the method of generating high level of awareness and
understanding about the addressed research problem. It is key to choose methods,
frameworks and philosophical assumptions which are tested for reliability and validity
and designed to be unbiased and objective. Applied research is the main theme for
the majority of the research and can be implied in different fields of research. In this
study, Saunders’ research onion has been used to discuss the different layers in the
research method (Saunders et al. 2015). There are numerous methods of generating
results and these results ranges from high scientific structural methods to informal
ways of fulfilling the objective of the research. The main objective of the research is
evaluating the influence of pricing strategies on the consumer purchase intention in
the grocery industry in United Kingdom. As per the objective, it can be stated that
evaluating the cause and effect relationship between both the variables in the
purpose of the research.
3.2 RESEARCH DESIGN
Research design is the overall process of choosing techniques and methods
that can be used to combine various components logically. On the contrary, the
choice between qualitative and quantitative methods is also defined as research
design. It also provides insights on the way a methodology can be used to perform
the study effectively (Creswell and Poth 2017). This means that it provides the
outline of the way, research needs to be conducted in the study. Research design
explains the type and nature of study to be performed. This can be experimental,
quasi experimental, correlational, review and others. The four key characteristics of
research design are reliability, neutrality, validity and generalisation (Ioannidis et al.
2014). This means that the results developed from the research needs to unbiased
and the reproducibility of the design is high. Validity measures the appropriateness
of the research instruments. Moreover, the results developed should be applicable to
the whole population sample and not the chosen sub set.
2BUSINESS MARKETING
Research designs are mainly divided into three concepts; descriptive
research design, explanatory research design and exploratory research design. The
current research has chosen the explanatory research design as it has facilitated in
measuring the cause and effect relationship between two variables (Meyers, Gamst
and Guarino 2016). The explanatory research design is also known as causal
research design. It has also been used to depict the pattern in association between
two variables. This uses a high structured design which facilitates in performing
quantification of the observed data. This means that the changes in the pricing
strategies and its possible impacts can be identified using this design. A single
research design has been developed in the research and quantitative data has been
collected using the mentioned design.
3.3 SAMPLING TECHNIQUE
Sampling is the process of the choosing elements from the total population
which forms the sample sub set in the research. As stated by Jishan et al. (2015), it
is not feasible for a study to use the whole population as the sample population so
elements have to be chosen for representing the total target population. The process
of sampling is used for reducing the cost and timeframe of the research. This is
highly relevant in quantitative studies due to the involvement of the large sample
data. The process of sampling follows series of events and steps to select the
sample population and target population (Taherdoost 2016). The first step is
choosing the target population and the target population for the current research are
the retail consumers in the United Kingdom. However, all the consumers cannot be
used in this research and consumers having possible effective contribution to the
research needs to be chosen. Sampling frame is the technique which comes into
play due to this requirement where the sample elements having significant
contribution to the research are chosen. The sampling frame in this research
consists of the retail consumers in London.
The next step is choosing the sampling size and in this current study, the data
has been collected from 100 respondents by conducting an online survey. The online
survey resulted in no missing data and helped in measuring the relationship between
pricing strategies and consumer purchase intention. The next step is choosing the
sampling technique and there are mainly two types of sampling method, one is
probabilistic sampling method and second is non-probabilistic sampling method.
⊘ This is a preview!⊘
Do you want full access?
Subscribe today to unlock all pages.
Trusted by 1+ million students worldwide
3BUSINESS MARKETING
However, in quantitative studies the probabilistic sampling method is preferred where
randomisation of sample elements in the key characteristics of the method. In this
research, stratified sampling has been used to choose respondents from different
strata. This helps in gathering a more diversified response group in the research.
3.4 RESEARCH INSTRUMENT
In this research, the study has chosen online survey questionnaire has been
chosen as the instrument (Cook and Reed 2015). The research questionnaire has
been divided into three sections and consists of 10 questions. The first section
consists of demographic questions, the second section consists of questions on
pricing strategy and the third section consists of the questions on consumer
purchase intention. The first section consists of 4 questions, the second section
includes 2 questions and the last sections also consists of 4 questions.
3.5 PROCEDURE FOR DATA COLLECTION
The process of data uses primary data collection method to gather data from
survey questionnaire. The questionnaire has been sent to respondents through
emails. The survey questionnaire consists of close ended questions where the
questionnaire used nominal scale, ordinal scale and ratio scale to collect relevant
data (Palinkas et al. 2015). The questionnaire uses a structured format to collect
data from different respondents. The questionnaire has been developed based on
the conceptual framework developed in the literature review section to examine the
relationship discussed.
3.6 METHOD OF DATA ANALYSIS
This research uses a quantitative approach where the data collected has
been analysed using statistical tools like SPSS and MS Excel. SPSS has been used
to perform Pearson’s correlation between the variables. Pearson’s correlation
measures the degree of correlations between the chosen elements. The research
has regression analysis to develop a model and perform trend analysis (Palinkas et
al. 2015). The regression line follows the equation, y=mx + c + E, where m is the
slope, c is the constant, x is the dependent variable, y is the independent variable
and E is the error. Regression analysis has been able to establish the relationship
between the different factors by using a multiple regression tool.
Paraphrase This Document
Need a fresh take? Get an instant paraphrase of this document with our AI Paraphraser
4BUSINESS MARKETING
3.7 RELIABILITY AND VALIDITY
It has already been discussed that reliability and validity are important
components of research design. Reliability of the questionnaire has been measured
using test rated reliability where the questionnaire has been used to collect data from
different sets of respondents to check whether the results are similar or not. The
reliability of the collected data has been measured using cronbach’s alpha test which
measures the scale reliability and internal consistency of the collected data (Heale
and Twycross 2015). The value of alpha is expected to be greater than 0.6 for high
level of internal consistency. The validity of the questionnaire has been measured
using pilot testing where the questionnaire was sent to 10 respondents to gather
their opinion on the consumers. The validity of the data collected has been
measured using Bartlett test of sphericity and Kaiser Meyer Olkin test for sampling
adequacy. The KMO test is used to measure the adequacy of the sampling method
and the Bartlett test measures the proportion of variance among the data collected.
3.8 ETHICAL CONSIDERATION
The research has adhered to all the ethical guidelines of performing a
research. The respondents have been provided information regarding the purpose of
performing the research. The research has maintained the privacy and anonymity of
the respondents by withholding their personal data (Connelly 2014). The study has
also made sure that none of the data collected from the respondents has been
fabricated, falsified or plagiarised. The study has followed the data protection act of
1998 and data collected has been stored securely. The collected data has not been
used for any other purpose in the research. The study has also ensured that the
questionnaire does not consist of any discriminatory or offensive language that may
hurt the sentiment of any respondent.
5BUSINESS MARKETING
CHAPTER 4: FINDINGS AND ANALYSIS
4.1 INTRODUCTION
The current section has evaluated the data gathered using statistical tools and
techniques necessary to obtain relevant results. The reliability statistics and validity
test has been performed to analyse the quality of the data collected. Descriptive
statistics has been analysed to understand the mean response of the population in
each of the cases. The frequency charts has been examined to evaluate the
responses from each participant. The correlation and regression analysis measured
the relationship among the different elements to prove the hypothesis mentioned in
the literature review section. The chapter has also linked the results with the
literature review to form valid discussion in the research.
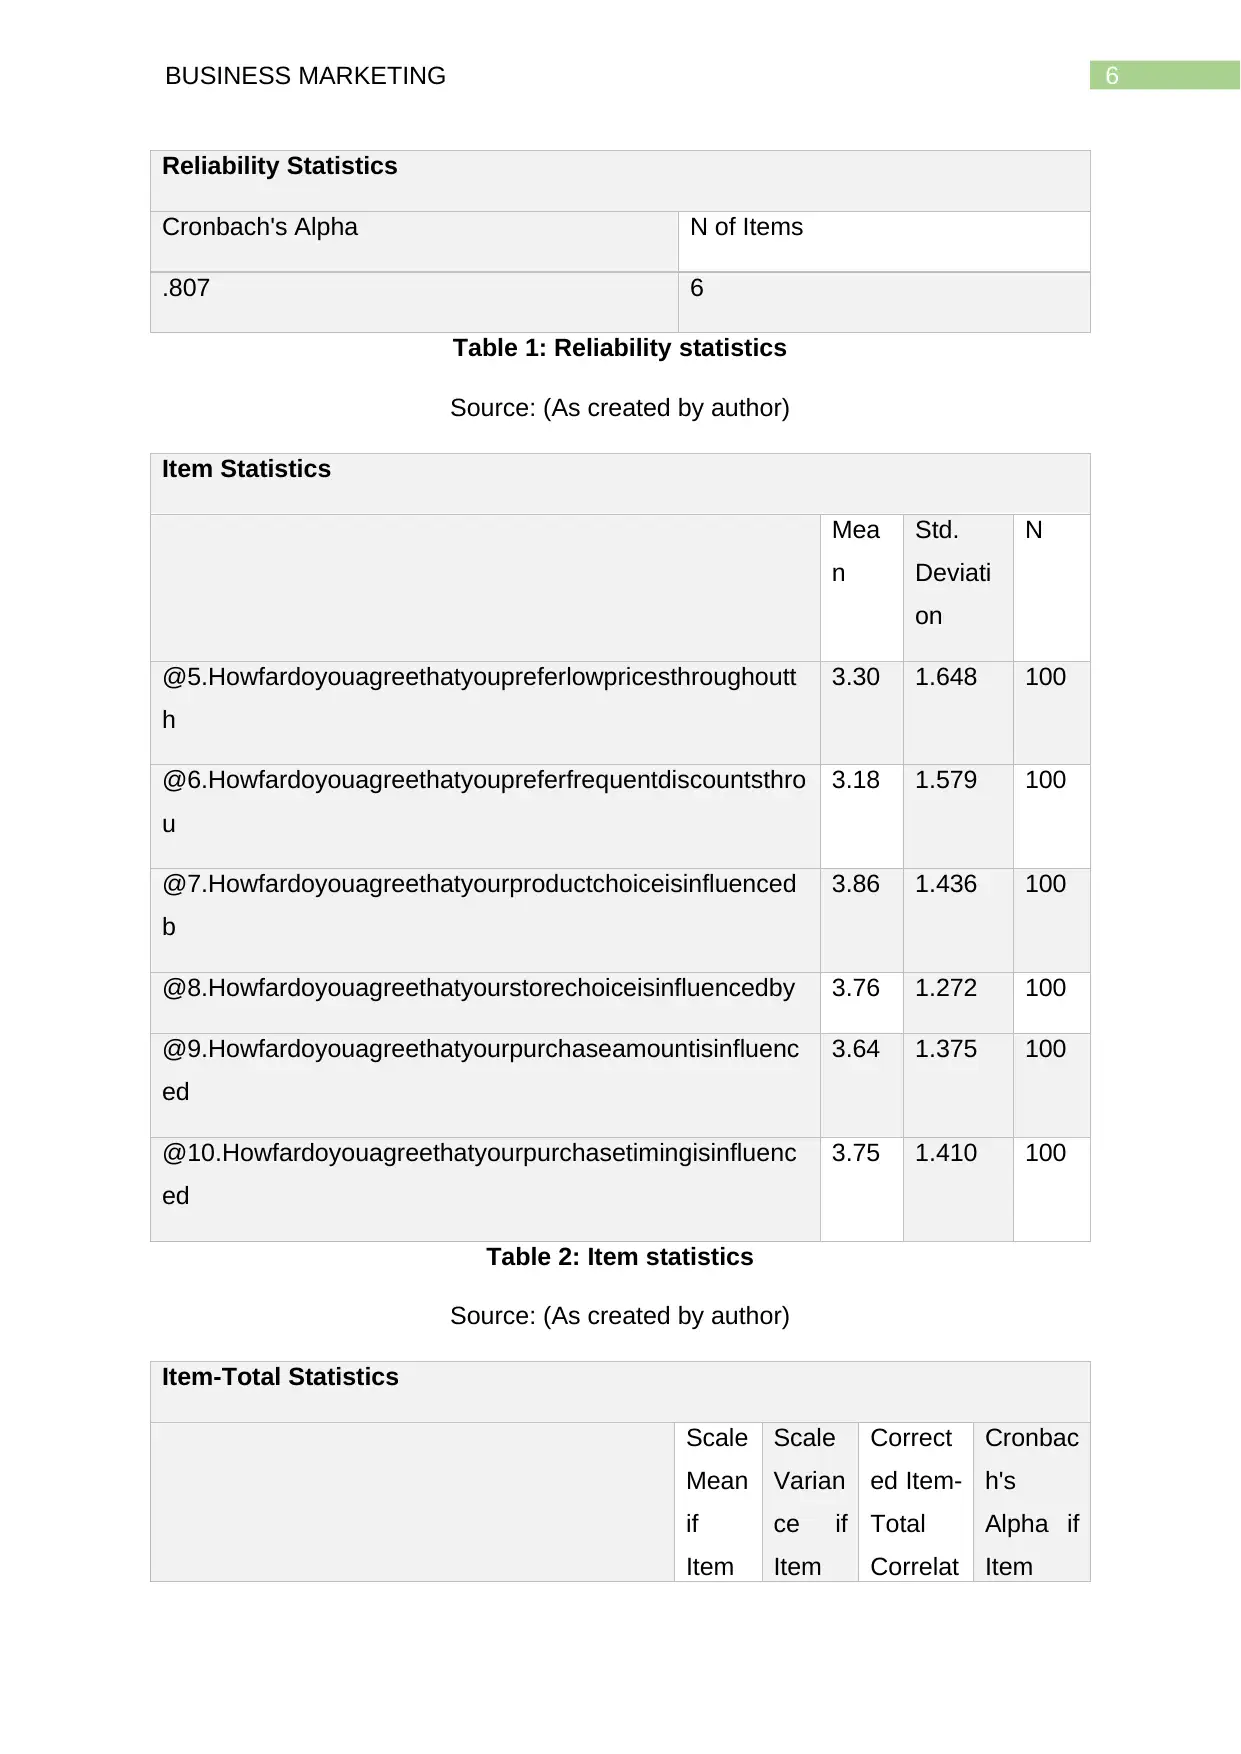
4.2 RELIABILITY AND VALIDITY
Cronbach’s alpha test has been used to measure the internal consistency of
the information gathered as it has the ability to quantify the responses into a range.
The Cronbach’s alpha value has a threshold of 0.7 and the value above 0.7 is
considered acceptable in applied research. The value of alpha is .807 which means
that the internal consistency and scale of the data gathered is significantly high. The
mean value of the responses collected shows a high value which means that similar
responses are obtained in majority of the cases. The item total statistics is used to
evaluate the internal consistency when one of the item is deleted. In this study, it can
be seen that the value of alpha decreases when one of the item is deleted. This
means that all the elements have high level of consistency.
The validity of the data gathered has been measured using Kaiser-Meyer-
Olkin Measure of Sampling Adequacy and Bartlett's Test of Sphericity. The value of
KMO is .798 which means that the sampling of the given data is highly adequate. On
the other hand, the value of Bartlett test is .000 which is less than the p value of .05.
This data implies that the data collected is significant and proportion of variance is
minimal in the research.
The reliability and validity analysis of the data gathered has shown positive
results. It is expected to derive results that are in accordance to the scope of
investigation. It also implies that results created are relevant and high accuracy and
precision.
CHAPTER 4: FINDINGS AND ANALYSIS
4.1 INTRODUCTION
The current section has evaluated the data gathered using statistical tools and
techniques necessary to obtain relevant results. The reliability statistics and validity
test has been performed to analyse the quality of the data collected. Descriptive
statistics has been analysed to understand the mean response of the population in
each of the cases. The frequency charts has been examined to evaluate the
responses from each participant. The correlation and regression analysis measured
the relationship among the different elements to prove the hypothesis mentioned in
the literature review section. The chapter has also linked the results with the
literature review to form valid discussion in the research.
4.2 RELIABILITY AND VALIDITY
Cronbach’s alpha test has been used to measure the internal consistency of
the information gathered as it has the ability to quantify the responses into a range.
The Cronbach’s alpha value has a threshold of 0.7 and the value above 0.7 is
considered acceptable in applied research. The value of alpha is .807 which means
that the internal consistency and scale of the data gathered is significantly high. The
mean value of the responses collected shows a high value which means that similar
responses are obtained in majority of the cases. The item total statistics is used to
evaluate the internal consistency when one of the item is deleted. In this study, it can
be seen that the value of alpha decreases when one of the item is deleted. This
means that all the elements have high level of consistency.
The validity of the data gathered has been measured using Kaiser-Meyer-
Olkin Measure of Sampling Adequacy and Bartlett's Test of Sphericity. The value of
KMO is .798 which means that the sampling of the given data is highly adequate. On
the other hand, the value of Bartlett test is .000 which is less than the p value of .05.
This data implies that the data collected is significant and proportion of variance is
minimal in the research.
The reliability and validity analysis of the data gathered has shown positive
results. It is expected to derive results that are in accordance to the scope of
investigation. It also implies that results created are relevant and high accuracy and
precision.
⊘ This is a preview!⊘
Do you want full access?
Subscribe today to unlock all pages.
Trusted by 1+ million students worldwide
6BUSINESS MARKETING
Reliability Statistics
Cronbach's Alpha N of Items
.807 6
Table 1: Reliability statistics
Source: (As created by author)
Item Statistics
Mea
n
Std.
Deviati
on
N
@5.Howfardoyouagreethatyoupreferlowpricesthroughoutt
h
3.30 1.648 100
@6.Howfardoyouagreethatyoupreferfrequentdiscountsthro
u
3.18 1.579 100
@7.Howfardoyouagreethatyourproductchoiceisinfluenced
b
3.86 1.436 100
@8.Howfardoyouagreethatyourstorechoiceisinfluencedby 3.76 1.272 100
@9.Howfardoyouagreethatyourpurchaseamountisinfluenc
ed
3.64 1.375 100
@10.Howfardoyouagreethatyourpurchasetimingisinfluenc
ed
3.75 1.410 100
Table 2: Item statistics
Source: (As created by author)
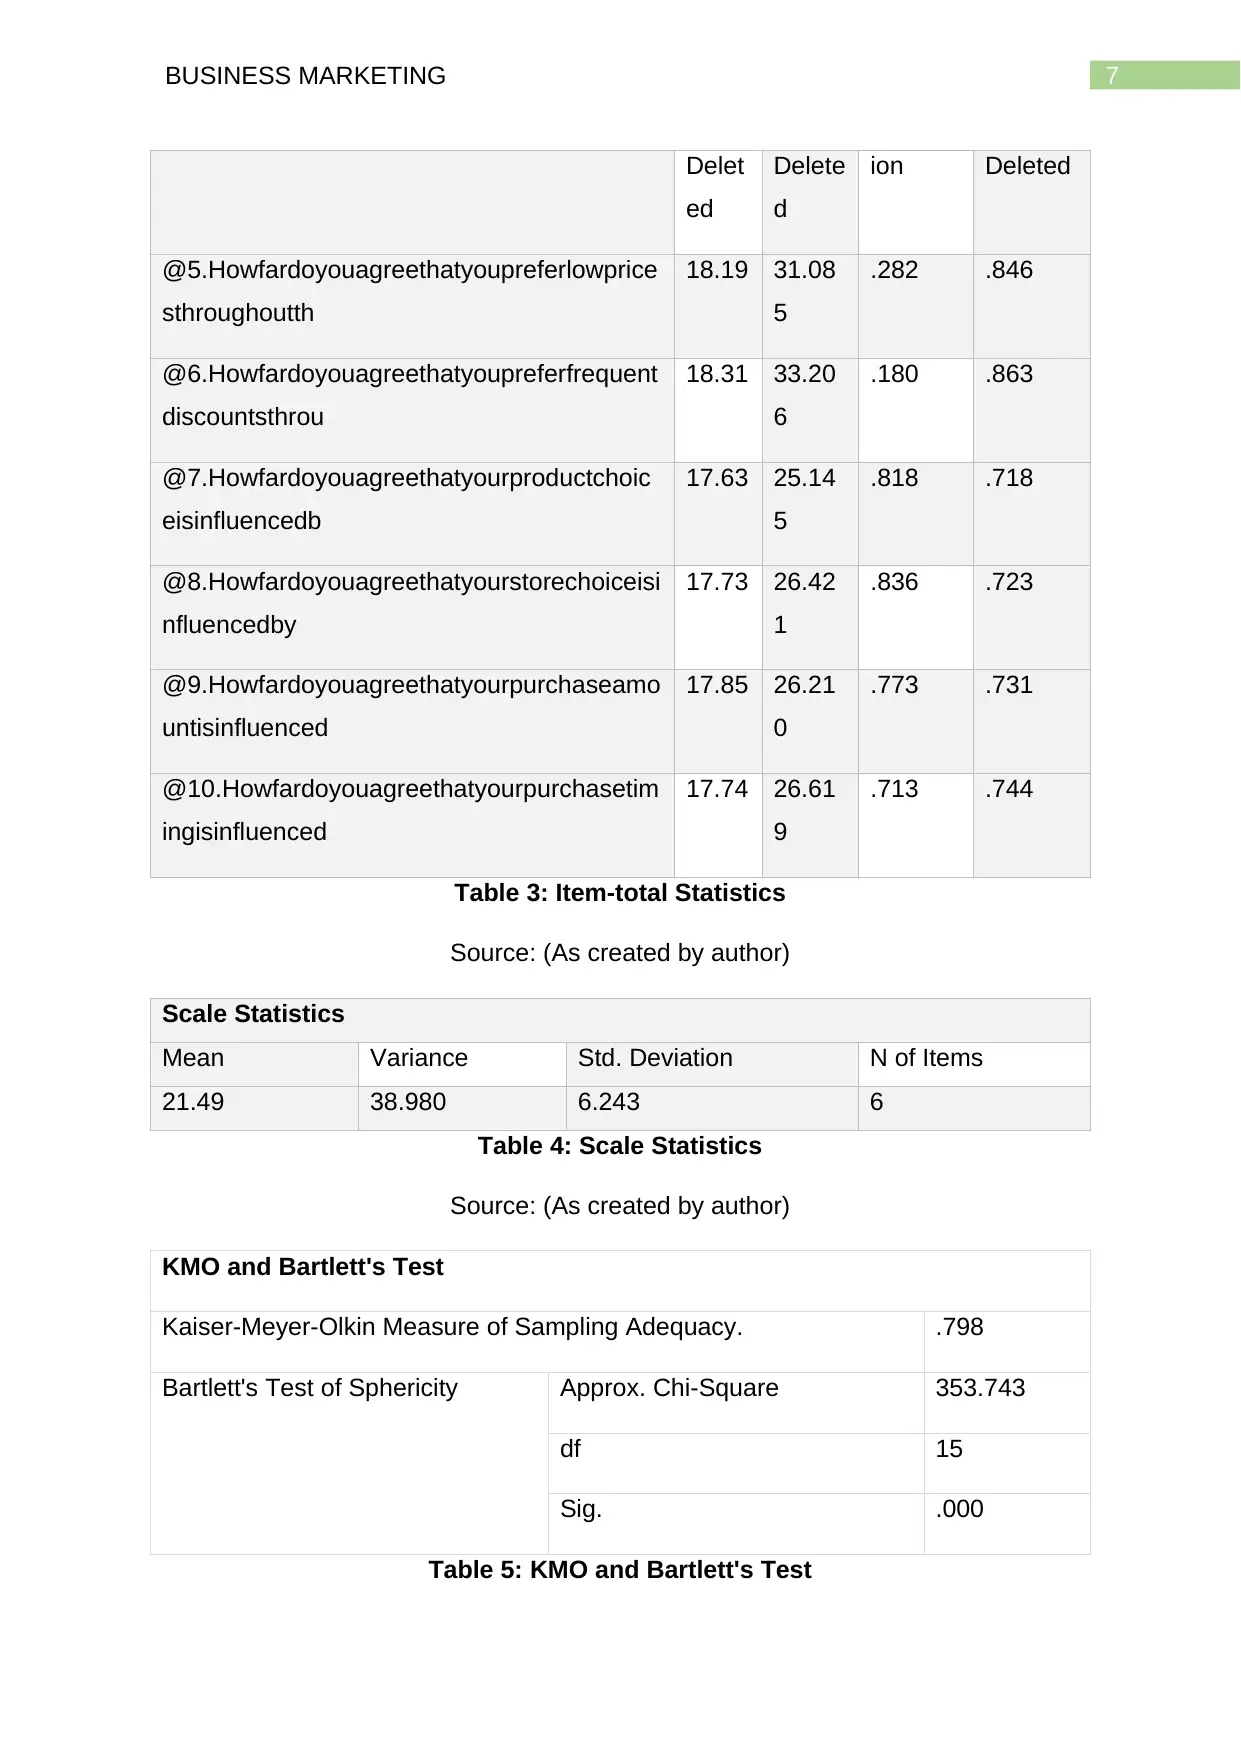
Item-Total Statistics
Scale
Mean
if
Item
Scale
Varian
ce if
Item
Correct
ed Item-
Total
Correlat
Cronbac
h's
Alpha if
Item
Reliability Statistics
Cronbach's Alpha N of Items
.807 6
Table 1: Reliability statistics
Source: (As created by author)
Item Statistics
Mea
n
Std.
Deviati
on
N
@5.Howfardoyouagreethatyoupreferlowpricesthroughoutt
h
3.30 1.648 100
@6.Howfardoyouagreethatyoupreferfrequentdiscountsthro
u
3.18 1.579 100
@7.Howfardoyouagreethatyourproductchoiceisinfluenced
b
3.86 1.436 100
@8.Howfardoyouagreethatyourstorechoiceisinfluencedby 3.76 1.272 100
@9.Howfardoyouagreethatyourpurchaseamountisinfluenc
ed
3.64 1.375 100
@10.Howfardoyouagreethatyourpurchasetimingisinfluenc
ed
3.75 1.410 100
Table 2: Item statistics
Source: (As created by author)
Item-Total Statistics
Scale
Mean
if
Item
Scale
Varian
ce if
Item
Correct
ed Item-
Total
Correlat
Cronbac
h's
Alpha if
Item
Paraphrase This Document
Need a fresh take? Get an instant paraphrase of this document with our AI Paraphraser
7BUSINESS MARKETING
Delet
ed
Delete
d
ion Deleted
@5.Howfardoyouagreethatyoupreferlowprice
sthroughoutth
18.19 31.08
5
.282 .846
@6.Howfardoyouagreethatyoupreferfrequent
discountsthrou
18.31 33.20
6
.180 .863
@7.Howfardoyouagreethatyourproductchoic
eisinfluencedb
17.63 25.14
5
.818 .718
@8.Howfardoyouagreethatyourstorechoiceisi
nfluencedby
17.73 26.42
1
.836 .723
@9.Howfardoyouagreethatyourpurchaseamo
untisinfluenced
17.85 26.21
0
.773 .731
@10.Howfardoyouagreethatyourpurchasetim
ingisinfluenced
17.74 26.61
9
.713 .744
Table 3: Item-total Statistics
Source: (As created by author)
Scale Statistics
Mean Variance Std. Deviation N of Items
21.49 38.980 6.243 6
Table 4: Scale Statistics
Source: (As created by author)
KMO and Bartlett's Test
Kaiser-Meyer-Olkin Measure of Sampling Adequacy. .798
Bartlett's Test of Sphericity Approx. Chi-Square 353.743
df 15
Sig. .000
Table 5: KMO and Bartlett's Test
8BUSINESS MARKETING
Source: (As created by author)
4.3 DESCRIPTIVE STATISTICS
The descriptive statistics examines the mean, standard deviation and kurtosis.
The average mean value of all the questions is 3.581 which means that majority of
the respondents have agreed to the research questions. The average standard
deviation of the data collected is 1.453 which means that the responses range from 5
to 2. It implies that there are few respondents that have disagreed to the research
questions. The kurtosis value measures the heaviness of the tail in the study and the
negative value determines that the distribution is platykurtic and the tails are lightly
distributed.
Descriptive Statistics
N Minim
um
Maxim
um
Mean Std.
Deviation
Kurtos
is
Statist
ic
Statisti
c
Statisti
c
Statist
ic
Statistic Statist
ic
@5.Howfardoyouag
reethatyoupreferlow
pricesthroughoutth
100 1 5 3.30 1.648 -1.550
@6.Howfardoyouag
reethatyoupreferfre
quentdiscountsthro
u
100 1 5 3.18 1.579 -1.613
@7.Howfardoyouag
reethatyourproductc
hoiceisinfluencedb
100 1 5 3.86 1.436 -.433
@8.Howfardoyouag
reethatyourstorecho
iceisinfluencedby
100 1 5 3.76 1.272 -.041
@9.Howfardoyouag
reethatyourpurchas
eamountisinfluence
d
100 1 5 3.64 1.375 -.743
@10.Howfardoyoua
greethatyourpurcha
setimingisinfluence
d
100 1 5 3.75 1.410 -.661
Valid N (listwise) 100 3.581 1.453
Table 6: Descriptive Statistics
⊘ This is a preview!⊘
Do you want full access?
Subscribe today to unlock all pages.
Trusted by 1+ million students worldwide
9BUSINESS MARKETING
Source: (As created by author)
Descriptive Statistics
Kurtosis
Std. Error
@5.Howfardoyouagreethatyoupreferlowpricesthroughoutth .478
@6.Howfardoyouagreethatyoupreferfrequentdiscountsthrou .478
@7.Howfardoyouagreethatyourproductchoiceisinfluencedb .478
@8.Howfardoyouagreethatyourstorechoiceisinfluencedby .478
@9.Howfardoyouagreethatyourpurchaseamountisinfluenced .478
@10.Howfardoyouagreethatyourpurchasetimingisinfluenced .478
Valid N (listwise)
Table 7: Descriptive Statistics
Source: (As created by author)
4.4 FREQUENCY RESPONSES
Image 1: Age
Source: (As created by author)
Descriptive Statistics
Kurtosis
Std. Error
@5.Howfardoyouagreethatyoupreferlowpricesthroughoutth .478
@6.Howfardoyouagreethatyoupreferfrequentdiscountsthrou .478
@7.Howfardoyouagreethatyourproductchoiceisinfluencedb .478
@8.Howfardoyouagreethatyourstorechoiceisinfluencedby .478
@9.Howfardoyouagreethatyourpurchaseamountisinfluenced .478
@10.Howfardoyouagreethatyourpurchasetimingisinfluenced .478
Valid N (listwise)
Table 7: Descriptive Statistics
Source: (As created by author)
4.4 FREQUENCY RESPONSES
Image 1: Age
Paraphrase This Document
Need a fresh take? Get an instant paraphrase of this document with our AI Paraphraser
10BUSINESS MARKETING
Source: (As created by author)
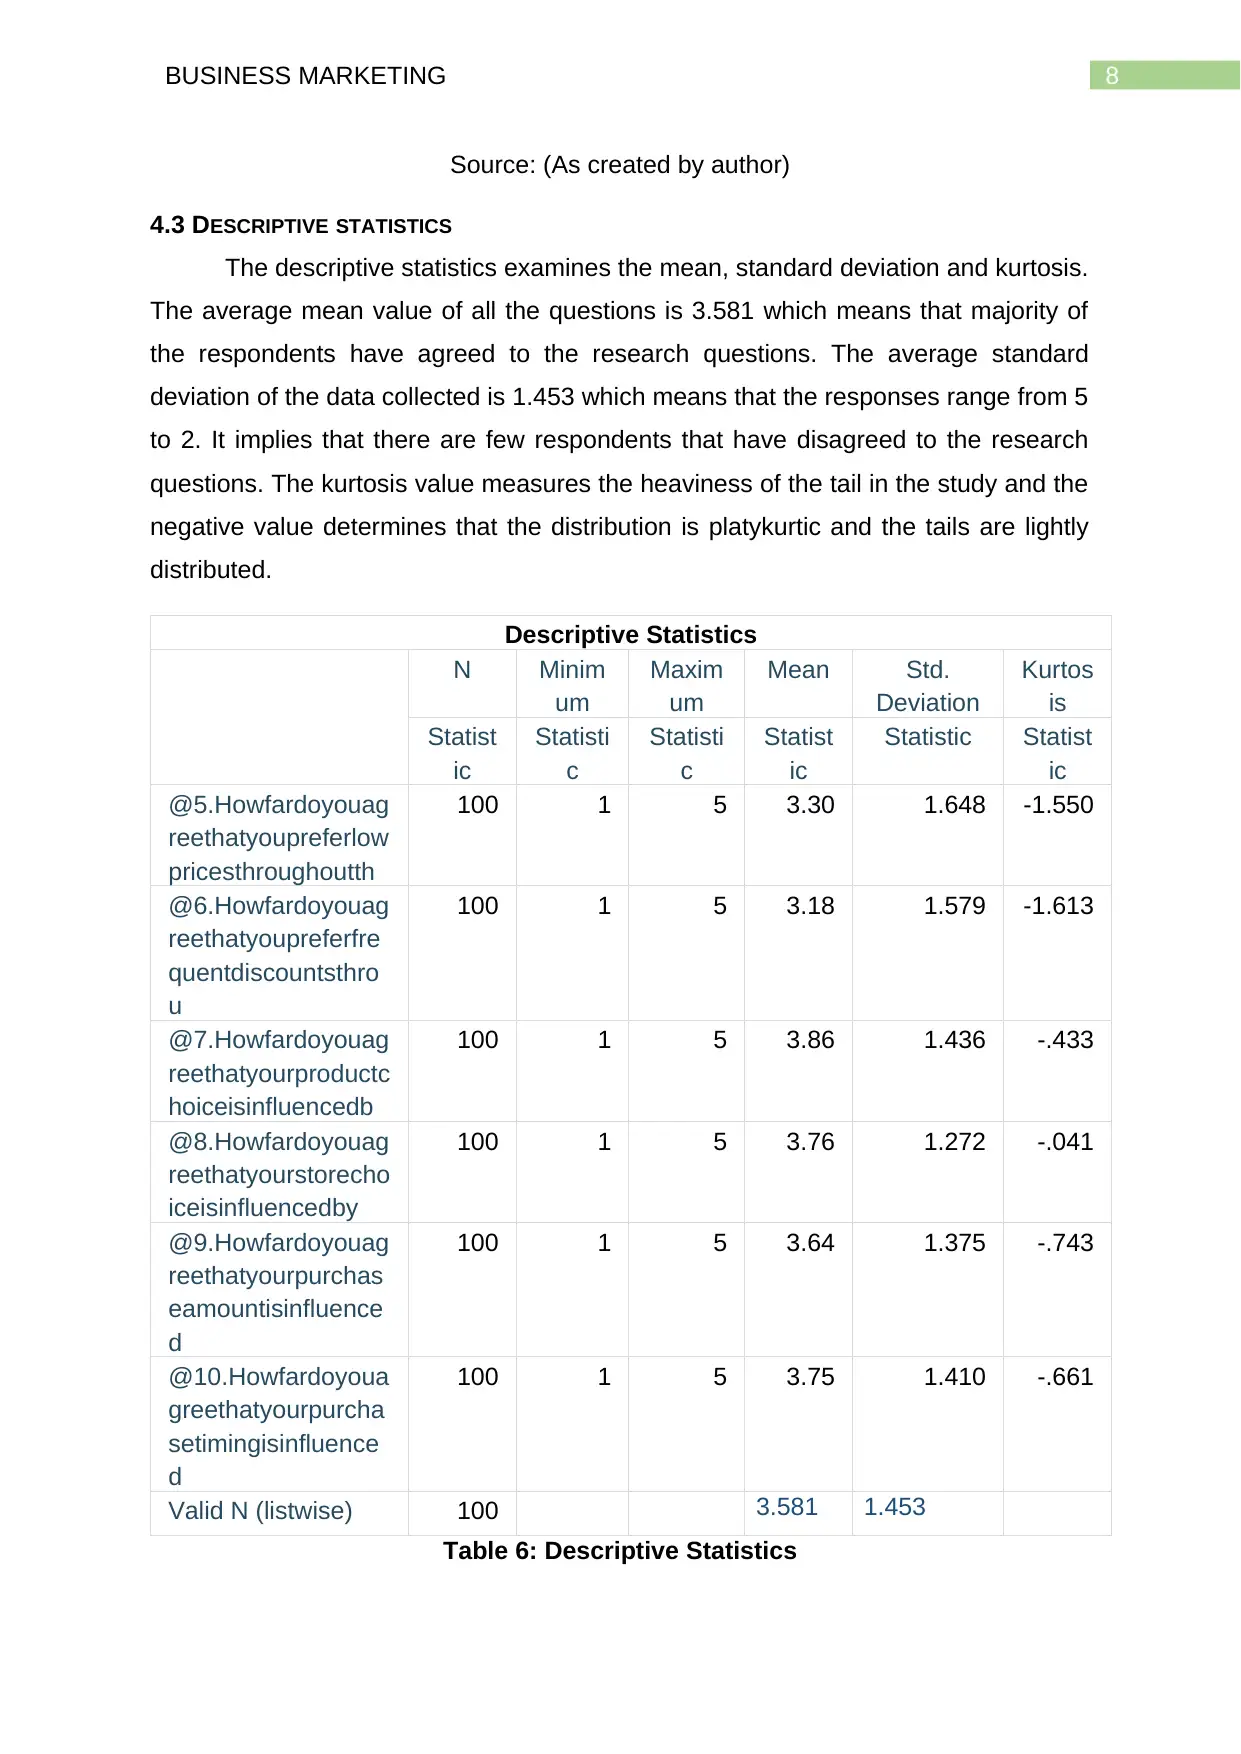
The purpose of the question is examination of the age of the participants for
the current investigation. The results show that 42% of the participants belong to the
age group of 25-30 years, 26%% of the respondents belong to the age group of 35-
40 years, 18% belong to the age group of 18-24 years and the remaining
respondents belong to the age group of 40 and above. The frequency distribution
shows diversity among the respondents.
Image 2: Gender
Source: (As created by author)
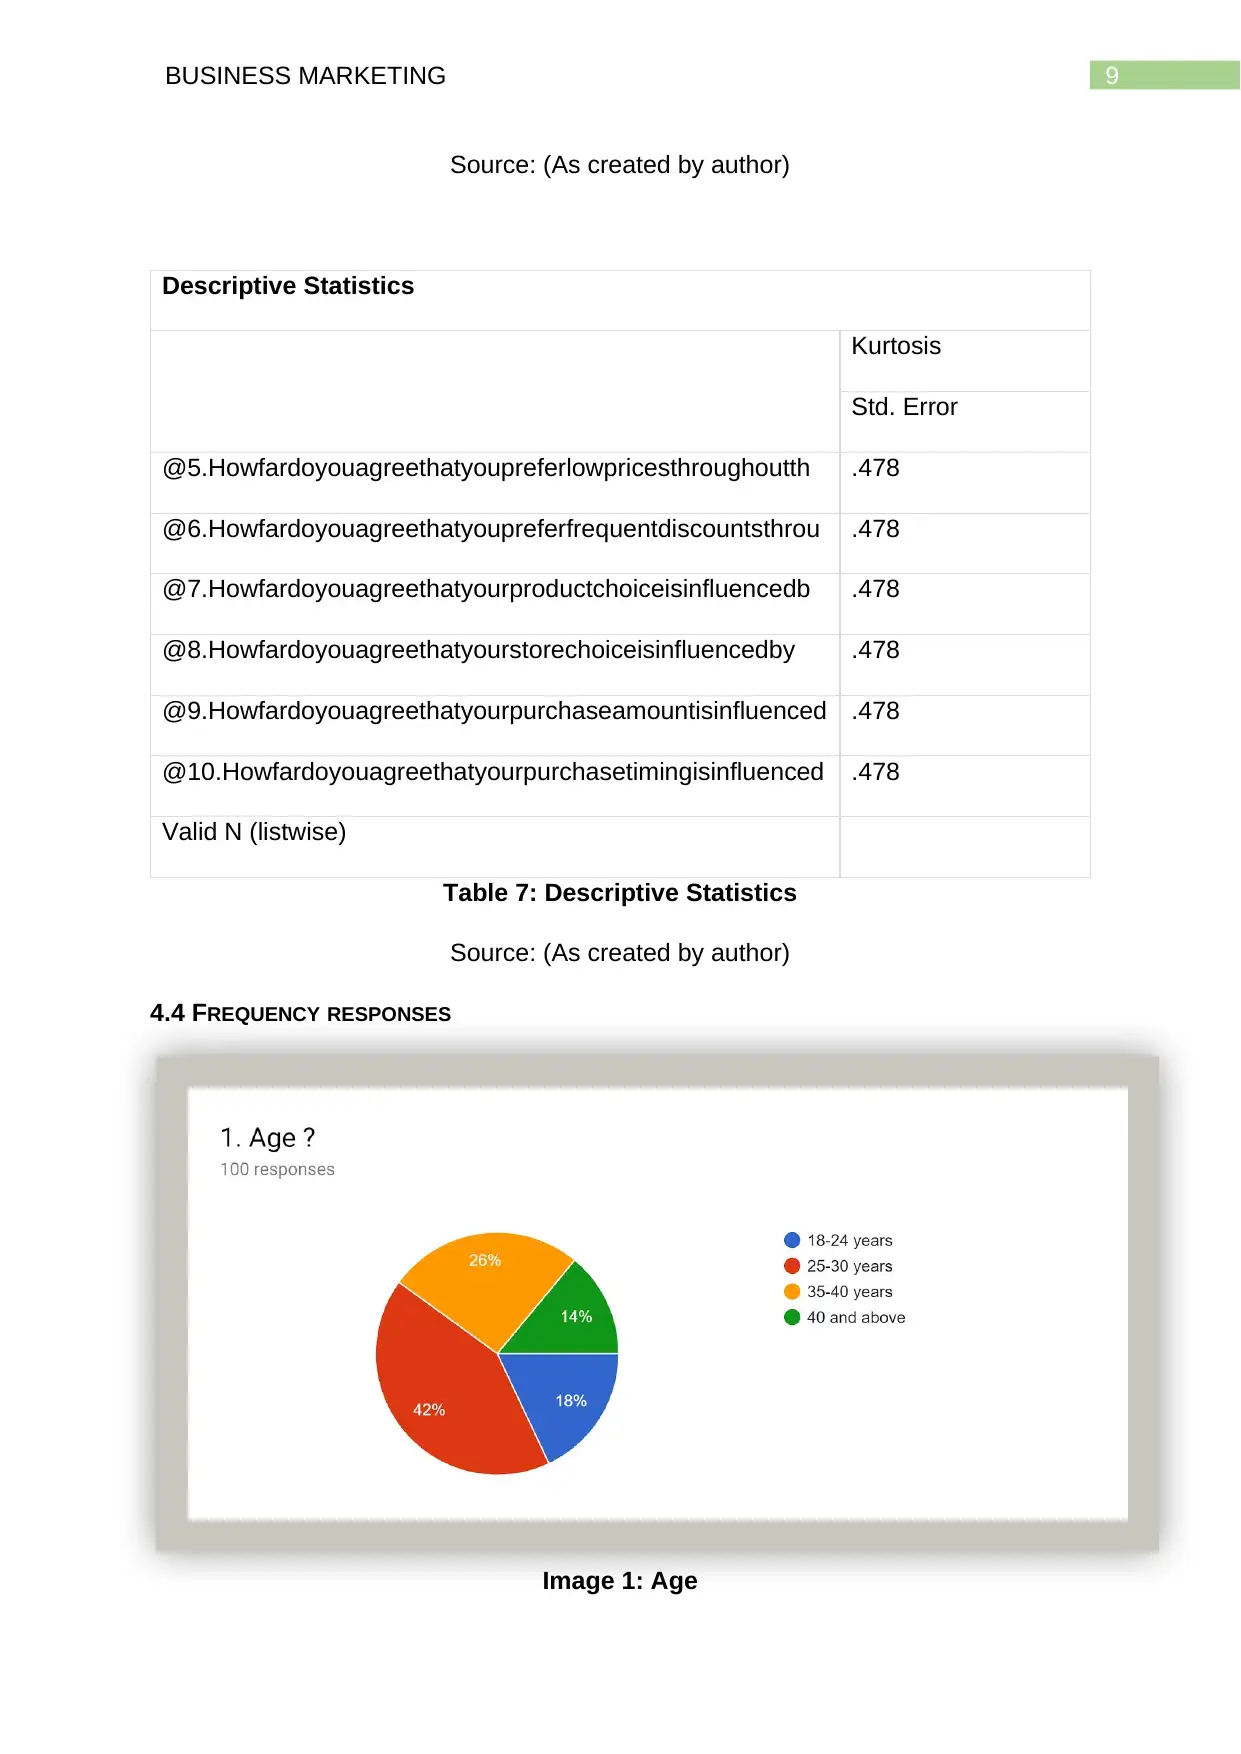
The question aims to highlight the gender of the participants and the results
show that 51% are female, 40% are male and remaining preferred not to say. The
diversity in the gender can be used as a moderating variable in understanding the
difference in opinion between both the genders. The preferences and spending
characteristics may vary depending upon the gender.
Source: (As created by author)
The purpose of the question is examination of the age of the participants for
the current investigation. The results show that 42% of the participants belong to the
age group of 25-30 years, 26%% of the respondents belong to the age group of 35-
40 years, 18% belong to the age group of 18-24 years and the remaining
respondents belong to the age group of 40 and above. The frequency distribution
shows diversity among the respondents.
Image 2: Gender
Source: (As created by author)
The question aims to highlight the gender of the participants and the results
show that 51% are female, 40% are male and remaining preferred not to say. The
diversity in the gender can be used as a moderating variable in understanding the
difference in opinion between both the genders. The preferences and spending
characteristics may vary depending upon the gender.
11BUSINESS MARKETING
Image 3: Monthly Income
Source: (As created by author)
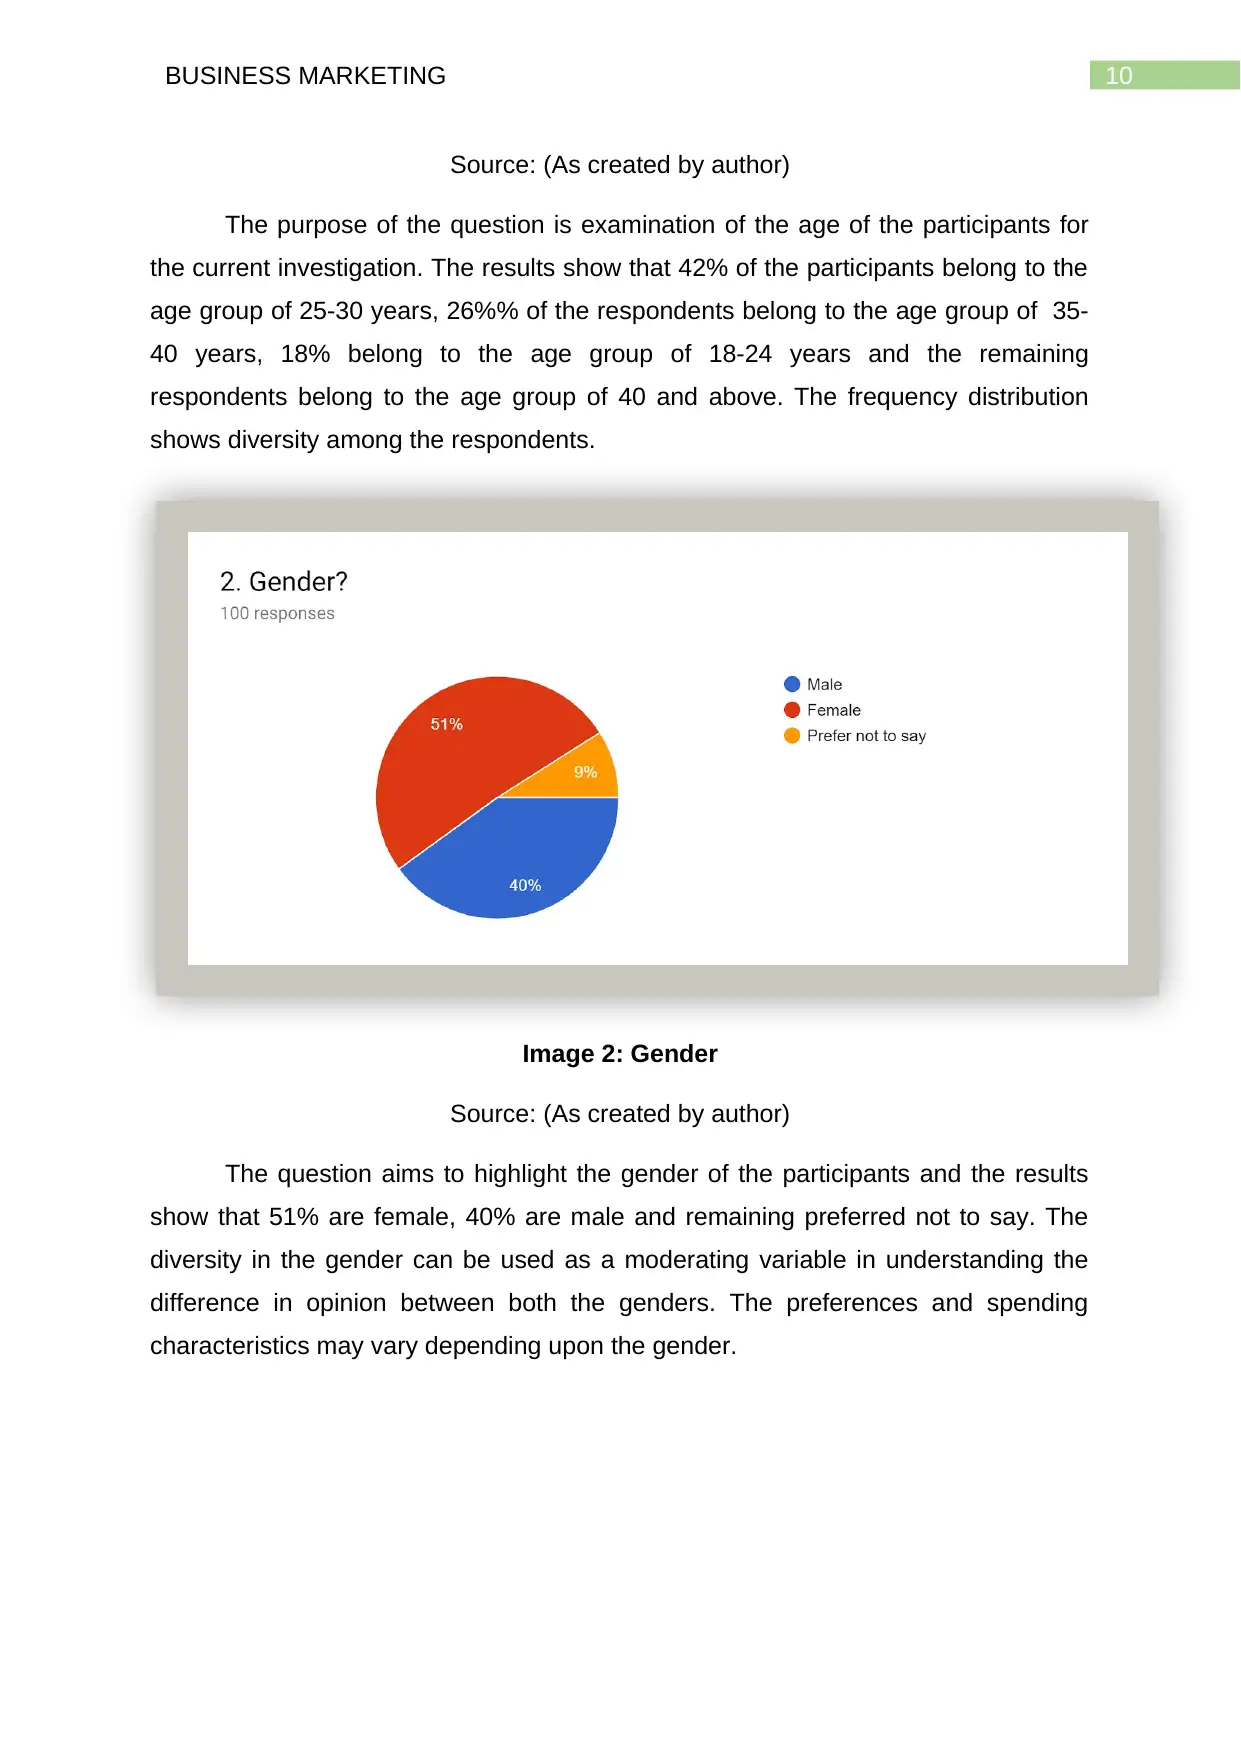
The present questions examines the monthly income of the respondents. The
results show that 38% of the respondents have an annual income between 25,001 to
35,000 GBP, 28% have an annual income between 15,001 to 25000 GBP, 17% have
an annual income of less than 15,000 GBP and 17% have an annual income of
greater than 35,000 GBP. This shows that the disposable income of the consumers
are relatively on the higher side in United Kingdom. However, it would be interesting
to analyse the buying behaviour based on the income level of each participant
segment.
Image 3: Monthly Income
Source: (As created by author)
The present questions examines the monthly income of the respondents. The
results show that 38% of the respondents have an annual income between 25,001 to
35,000 GBP, 28% have an annual income between 15,001 to 25000 GBP, 17% have
an annual income of less than 15,000 GBP and 17% have an annual income of
greater than 35,000 GBP. This shows that the disposable income of the consumers
are relatively on the higher side in United Kingdom. However, it would be interesting
to analyse the buying behaviour based on the income level of each participant
segment.
⊘ This is a preview!⊘
Do you want full access?
Subscribe today to unlock all pages.
Trusted by 1+ million students worldwide
1 out of 31
Related Documents


Your All-in-One AI-Powered Toolkit for Academic Success.
+13062052269
info@desklib.com
Available 24*7 on WhatsApp / Email
![[object Object]](/_next/static/media/star-bottom.7253800d.svg)
Unlock your academic potential
Copyright © 2020–2026 A2Z Services. All Rights Reserved. Developed and managed by ZUCOL.