Business Modelling: Report
18 Pages2929 Words43 Views
Added on 2020-03-23
Business Modelling: Report
Added on 2020-03-23
ShareRelated Documents
Business ModellingNameInstitutionInstructor24th September 2017Student Name: 1

Executive summaryThe main aim of this report was to analyze Social Progress Index data and come up with findingsthat can inform on the Sustainable Development Goals set by the UN. We analyzed data from 82countries and results showed that when compared with European countries, African countries arestill lagging behind in terms of adult literacy rates. In terms of human rights (political rights),countries in the Asian continent are still much behind countries in American continent. Analysisof premature deaths from non-communicable diseases between American and Europeancountries showed that the two continents have no significant differences.Lastly, we found out that Household air pollution attributable deaths significantly estimatepremature deaths from non-communicable diseases. Student Name: 2
Introduction The purpose of this report is to present analysis of Social Progress Index data. The report willaddress the following questions;How does Basic Knowledge compare between European countries and African countries?Is there difference in terms of Personal Rights between Asian and American countries?Is there any difference in terms of Health and Wellness between European and Americancountries? Last, the report will present two regression models For predicting the premature deaths from non-communicable diseases using Householdair pollution attributable deaths.For predicting the political rights using Adult literacy rate.The analysis utilizes the Social Progress Index data which comprises of 182 observations(countries). Out this, a sample of 100 was selected where random numbers were generated inexcel and then sorted in ascending order. The first 100 samples was then selected. However, outof the 100 selected samples there were missing values which resulted to the whole row beingdeleted and thus we ended up with a sample of 82 observations (countries). The data is presentedin the appendix named A1.Student Name: 3
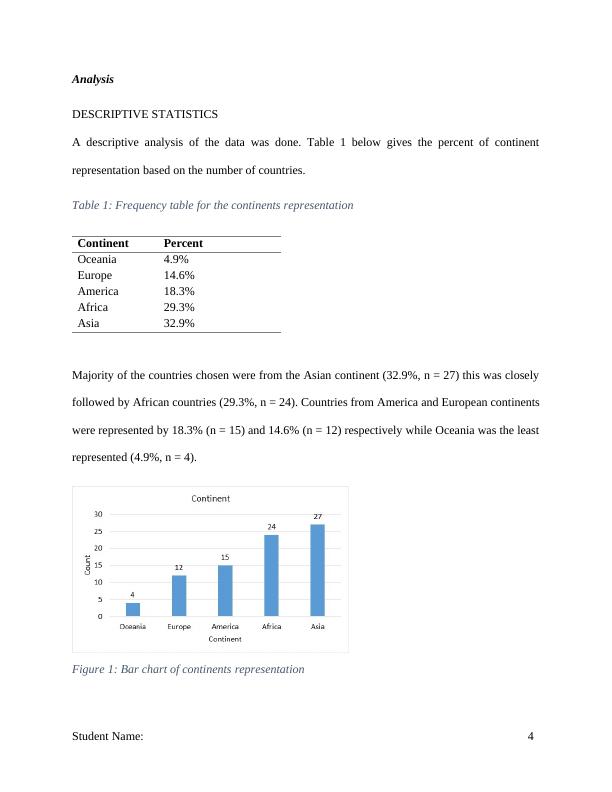
AnalysisDESCRIPTIVE STATISTICS A descriptive analysis of the data was done. Table 1 below gives the percent of continentrepresentation based on the number of countries.Table 1: Frequency table for the continents representationContinentPercentOceania4.9%Europe14.6%America18.3%Africa29.3%Asia32.9%Majority of the countries chosen were from the Asian continent (32.9%, n = 27) this was closelyfollowed by African countries (29.3%, n = 24). Countries from America and European continentswere represented by 18.3% (n = 15) and 14.6% (n = 12) respectively while Oceania was the leastrepresented (4.9%, n = 4).Figure 1: Bar chart of continents representationStudent Name: 4
End of preview
Want to access all the pages? Upload your documents or become a member.
Related Documents
Analysis of Social Progress Index data for Sustainable Development Goalslg...
|18
|3095
|162
FIN60003 Business Modelling and Statisticslg...
|29
|2946
|218