Business Planning: Budgeted vs Actual Performance Analysis
VerifiedAdded on 2023/06/12
|17
|3038
|398
AI Summary
This report analyzes the budgeted and actual performance of a company in terms of profit and loss, financial position, cost, sales, gross profit, and operating profit. It also includes ratio calculation and interpretation.
Contribute Materials
Your contribution can guide someone’s learning journey. Share your
documents today.

BUSINESS PLANNING
Secure Best Marks with AI Grader
Need help grading? Try our AI Grader for instant feedback on your assignments.
Table of Contents
INTRODUCTIO..............................................................................................................................3
REPORT SUMMARY.....................................................................................................................3
PREPARATION OF BUDGETED STATEMENT OF PROFIT & LOSS ACCOUNT............3
PREPARATION OF ACTUAL STATEMENT OF PROFIT & LOSS ACCOUNT..................4
PREPARATION OF BUDGETED STATEMENT OF FINANCIAL POSITION FOR THE
FINANCIAL YEAR....................................................................................................................5
PREPARATION OF ACTUAL STATEMENT OF FINANCIAL POSITION FOR THE
FINANCIAL YEAR....................................................................................................................6
COMMENTS ON BUDGETED COST..........................................................................................7
COMMENTS ON ACTUAL COST................................................................................................9
COMMENTS ON SALES, GROSS PROFIT AND OPERATING PROFIT...............................11
RATIO CALCULATION AND INTERPRETATION ON PERFORMANCE OF COMPANY
....................................................................................................................................................12
INTERPRETATION OF LIQUIDITY RATIO-.......................................................................13
CONCLUSION..............................................................................................................................14
REFERENCES..............................................................................................................................14
INTRODUCTIO
Business planning is the process of anticipation of future outcomes in order to make an
impactful plan to carry out business (Shubita, 2019) The report will be discussing how the entity
has performed relative to the budget. It will be discussing profit and loss statement for the
company for both budgeted and actual figures. Along with its financial position statement would
also be made separately for both budgeted and actual figures, further with regard to the
calculations various charts will also be fabricated to make the picture clearer. At the end of the
report ratios would be calculated and substantiated with interpretation.
REPORT SUMMARY
The performance of the company over the year has been good but not as it was expected
since the budgeted gross profit for the year was 5198 (in 000) but actually it has been 4101
which is less than the budgeted figures. Performance of the company is satisfactory the gross
profits in the initial months were exceeding budgeted figures but after initial five months it took
a sharp turn in adverse direction and from sixth month it came in negative figure. Then it has
shown good recovery and came to positive number and in following months again it started
following the budgeted data but could not over step (Bužinskienė, 2019) At last in the last month
the actual sales crossed the budgeted in great manner. Altogether it can be concluded that the
performance has not shown consistency throughout the year.
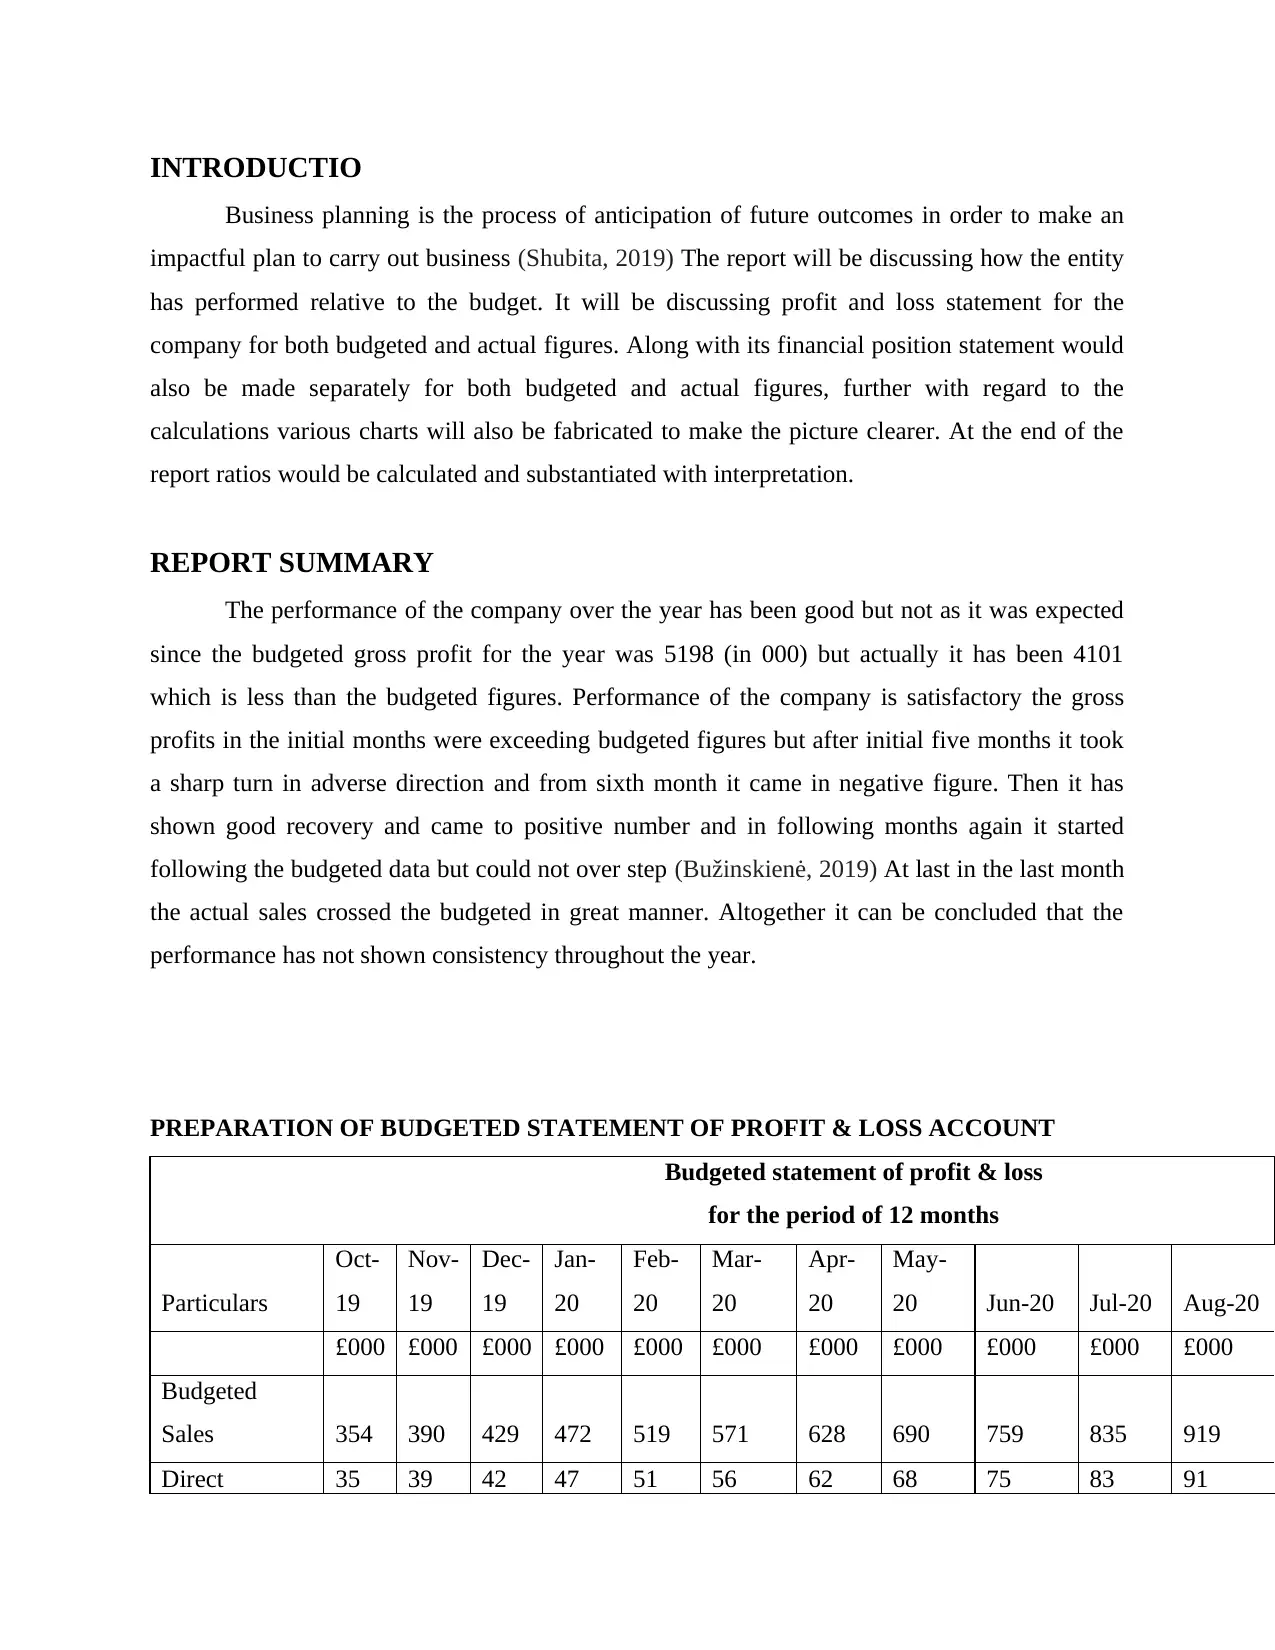
PREPARATION OF BUDGETED STATEMENT OF PROFIT & LOSS ACCOUNT
Budgeted statement of profit & loss
for the period of 12 months
Particulars
Oct-
19
Nov-
19
Dec-
19
Jan-
20
Feb-
20
Mar-
20
Apr-
20
May-
20 Jun-20 Jul-20 Aug-20
£000 £000 £000 £000 £000 £000 £000 £000 £000 £000 £000
Budgeted
Sales 354 390 429 472 519 571 628 690 759 835 919
Direct 35 39 42 47 51 56 62 68 75 83 91
Business planning is the process of anticipation of future outcomes in order to make an
impactful plan to carry out business (Shubita, 2019) The report will be discussing how the entity
has performed relative to the budget. It will be discussing profit and loss statement for the
company for both budgeted and actual figures. Along with its financial position statement would
also be made separately for both budgeted and actual figures, further with regard to the
calculations various charts will also be fabricated to make the picture clearer. At the end of the
report ratios would be calculated and substantiated with interpretation.
REPORT SUMMARY
The performance of the company over the year has been good but not as it was expected
since the budgeted gross profit for the year was 5198 (in 000) but actually it has been 4101
which is less than the budgeted figures. Performance of the company is satisfactory the gross
profits in the initial months were exceeding budgeted figures but after initial five months it took
a sharp turn in adverse direction and from sixth month it came in negative figure. Then it has
shown good recovery and came to positive number and in following months again it started
following the budgeted data but could not over step (Bužinskienė, 2019) At last in the last month
the actual sales crossed the budgeted in great manner. Altogether it can be concluded that the
performance has not shown consistency throughout the year.
PREPARATION OF BUDGETED STATEMENT OF PROFIT & LOSS ACCOUNT
Budgeted statement of profit & loss
for the period of 12 months
Particulars
Oct-
19
Nov-
19
Dec-
19
Jan-
20
Feb-
20
Mar-
20
Apr-
20
May-
20 Jun-20 Jul-20 Aug-20
£000 £000 £000 £000 £000 £000 £000 £000 £000 £000 £000
Budgeted
Sales 354 390 429 472 519 571 628 690 759 835 919
Direct 35 39 42 47 51 56 62 68 75 83 91
Material
Direct Labour 45 50 55 60 66 73 80 88 96 106 117
Variable
overheads 25 28 30 33 37 40 44 49 54 59 65
Fixed
overheads 11 11 11 11 11 11 11 11 11 11 11
Gross Profit 238 263 291 321 354 391 431 474 523 576 635
Administration
costs 35 35 35 35 35 35 35 35 35 35 35
Distribution
costs 75 83 91 100 110 121 133 146 161 177 195
Selling costs 40 40 40 40 40 40 40 40 40 40 40
Operating
profit 88 106 125 146 169 195 223 253 287 324 366
Finance costs 20 20 20 20 20 20 20 20 20 20 20
Profit before
tax (PBT) 68 86 105 126 149 175 203 233 267 304 346
Tax (10% of
PBT) 6.8 8.6 10.5 12.6 14.9 17.5 20.3 23.3 26.7 30.4 34.6
Profit after tax 61.2 77.1 94.4 113.4 134.2 157.2 182.4 209.8 240.4 274.0 311.1
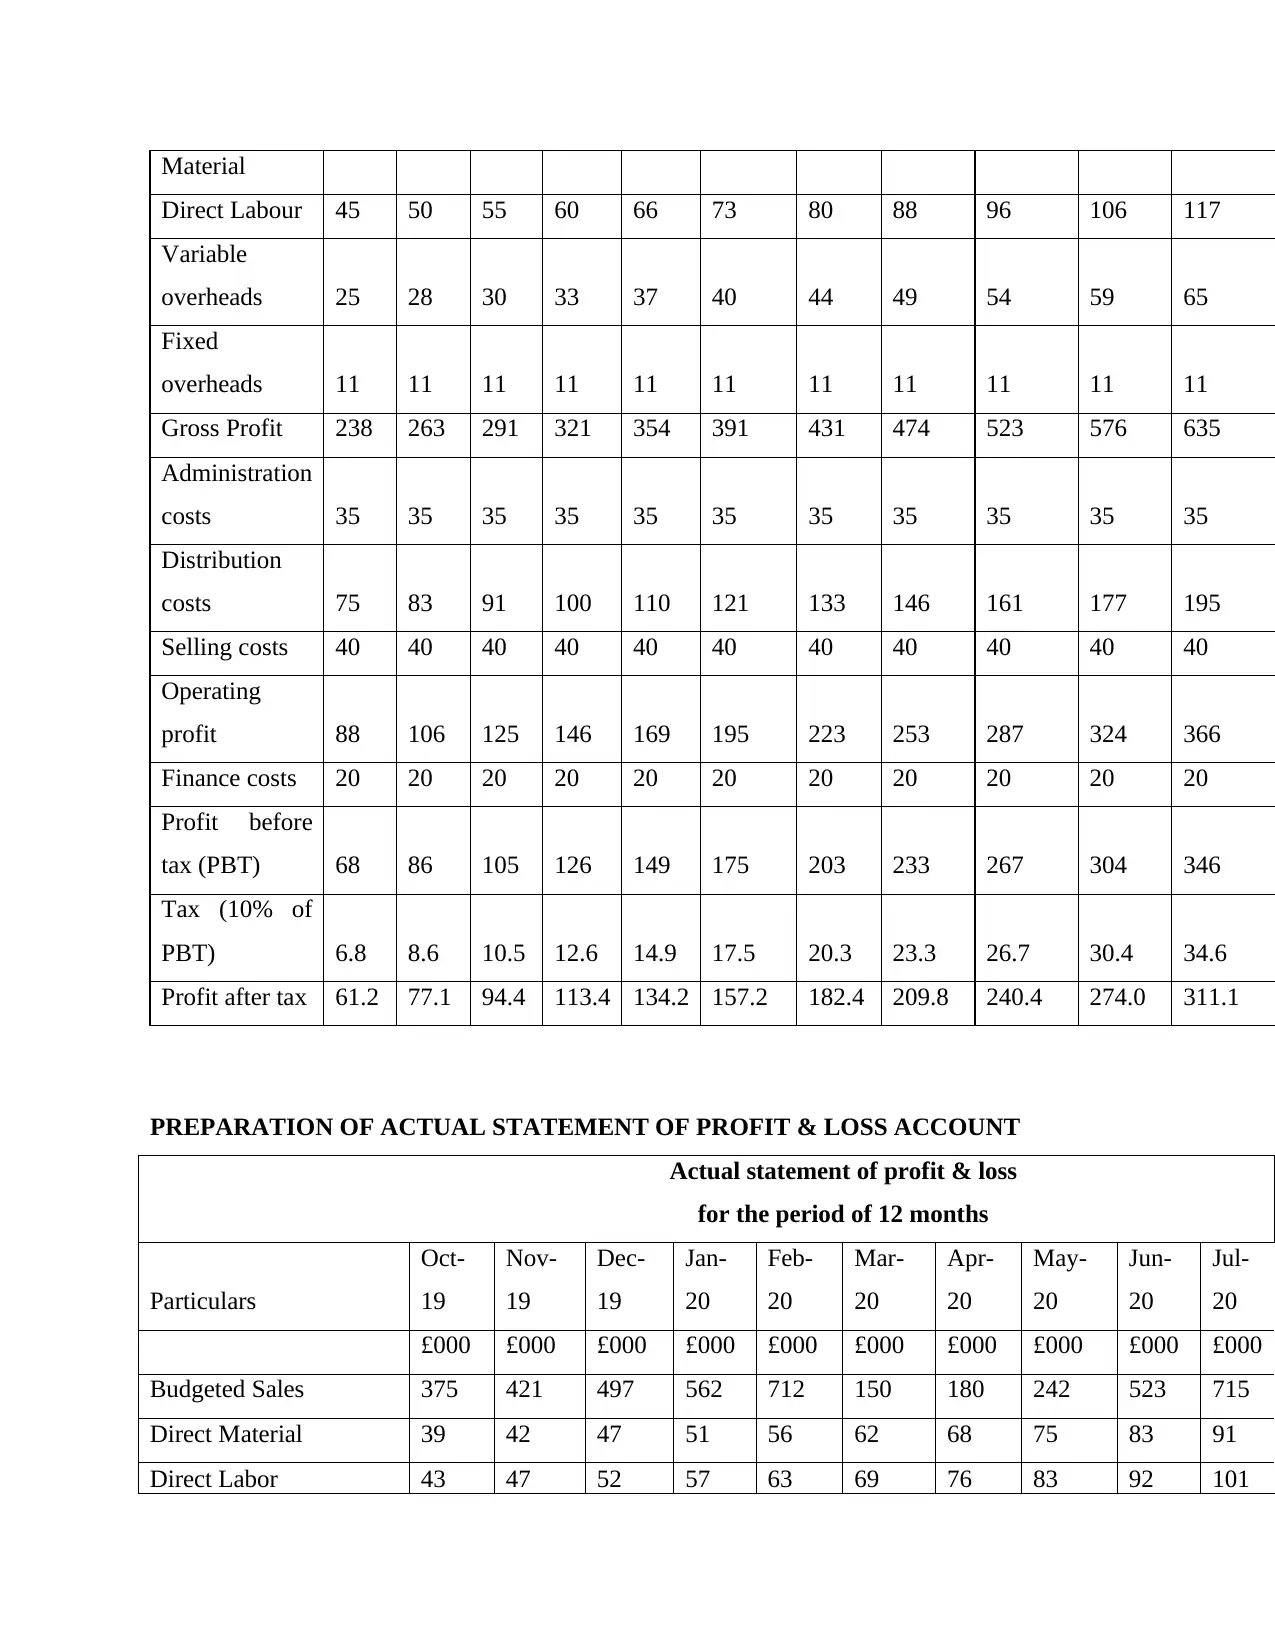
PREPARATION OF ACTUAL STATEMENT OF PROFIT & LOSS ACCOUNT
Actual statement of profit & loss
for the period of 12 months
Particulars
Oct-
19
Nov-
19
Dec-
19
Jan-
20
Feb-
20
Mar-
20
Apr-
20
May-
20
Jun-
20
Jul-
20
£000 £000 £000 £000 £000 £000 £000 £000 £000 £000
Budgeted Sales 375 421 497 562 712 150 180 242 523 715
Direct Material 39 42 47 51 56 62 68 75 83 91
Direct Labor 43 47 52 57 63 69 76 83 92 101
Direct Labour 45 50 55 60 66 73 80 88 96 106 117
Variable
overheads 25 28 30 33 37 40 44 49 54 59 65
Fixed
overheads 11 11 11 11 11 11 11 11 11 11 11
Gross Profit 238 263 291 321 354 391 431 474 523 576 635
Administration
costs 35 35 35 35 35 35 35 35 35 35 35
Distribution
costs 75 83 91 100 110 121 133 146 161 177 195
Selling costs 40 40 40 40 40 40 40 40 40 40 40
Operating
profit 88 106 125 146 169 195 223 253 287 324 366
Finance costs 20 20 20 20 20 20 20 20 20 20 20
Profit before
tax (PBT) 68 86 105 126 149 175 203 233 267 304 346
Tax (10% of
PBT) 6.8 8.6 10.5 12.6 14.9 17.5 20.3 23.3 26.7 30.4 34.6
Profit after tax 61.2 77.1 94.4 113.4 134.2 157.2 182.4 209.8 240.4 274.0 311.1
PREPARATION OF ACTUAL STATEMENT OF PROFIT & LOSS ACCOUNT
Actual statement of profit & loss
for the period of 12 months
Particulars
Oct-
19
Nov-
19
Dec-
19
Jan-
20
Feb-
20
Mar-
20
Apr-
20
May-
20
Jun-
20
Jul-
20
£000 £000 £000 £000 £000 £000 £000 £000 £000 £000
Budgeted Sales 375 421 497 562 712 150 180 242 523 715
Direct Material 39 42 47 51 56 62 68 75 83 91
Direct Labor 43 47 52 57 63 69 76 83 92 101
Secure Best Marks with AI Grader
Need help grading? Try our AI Grader for instant feedback on your assignments.
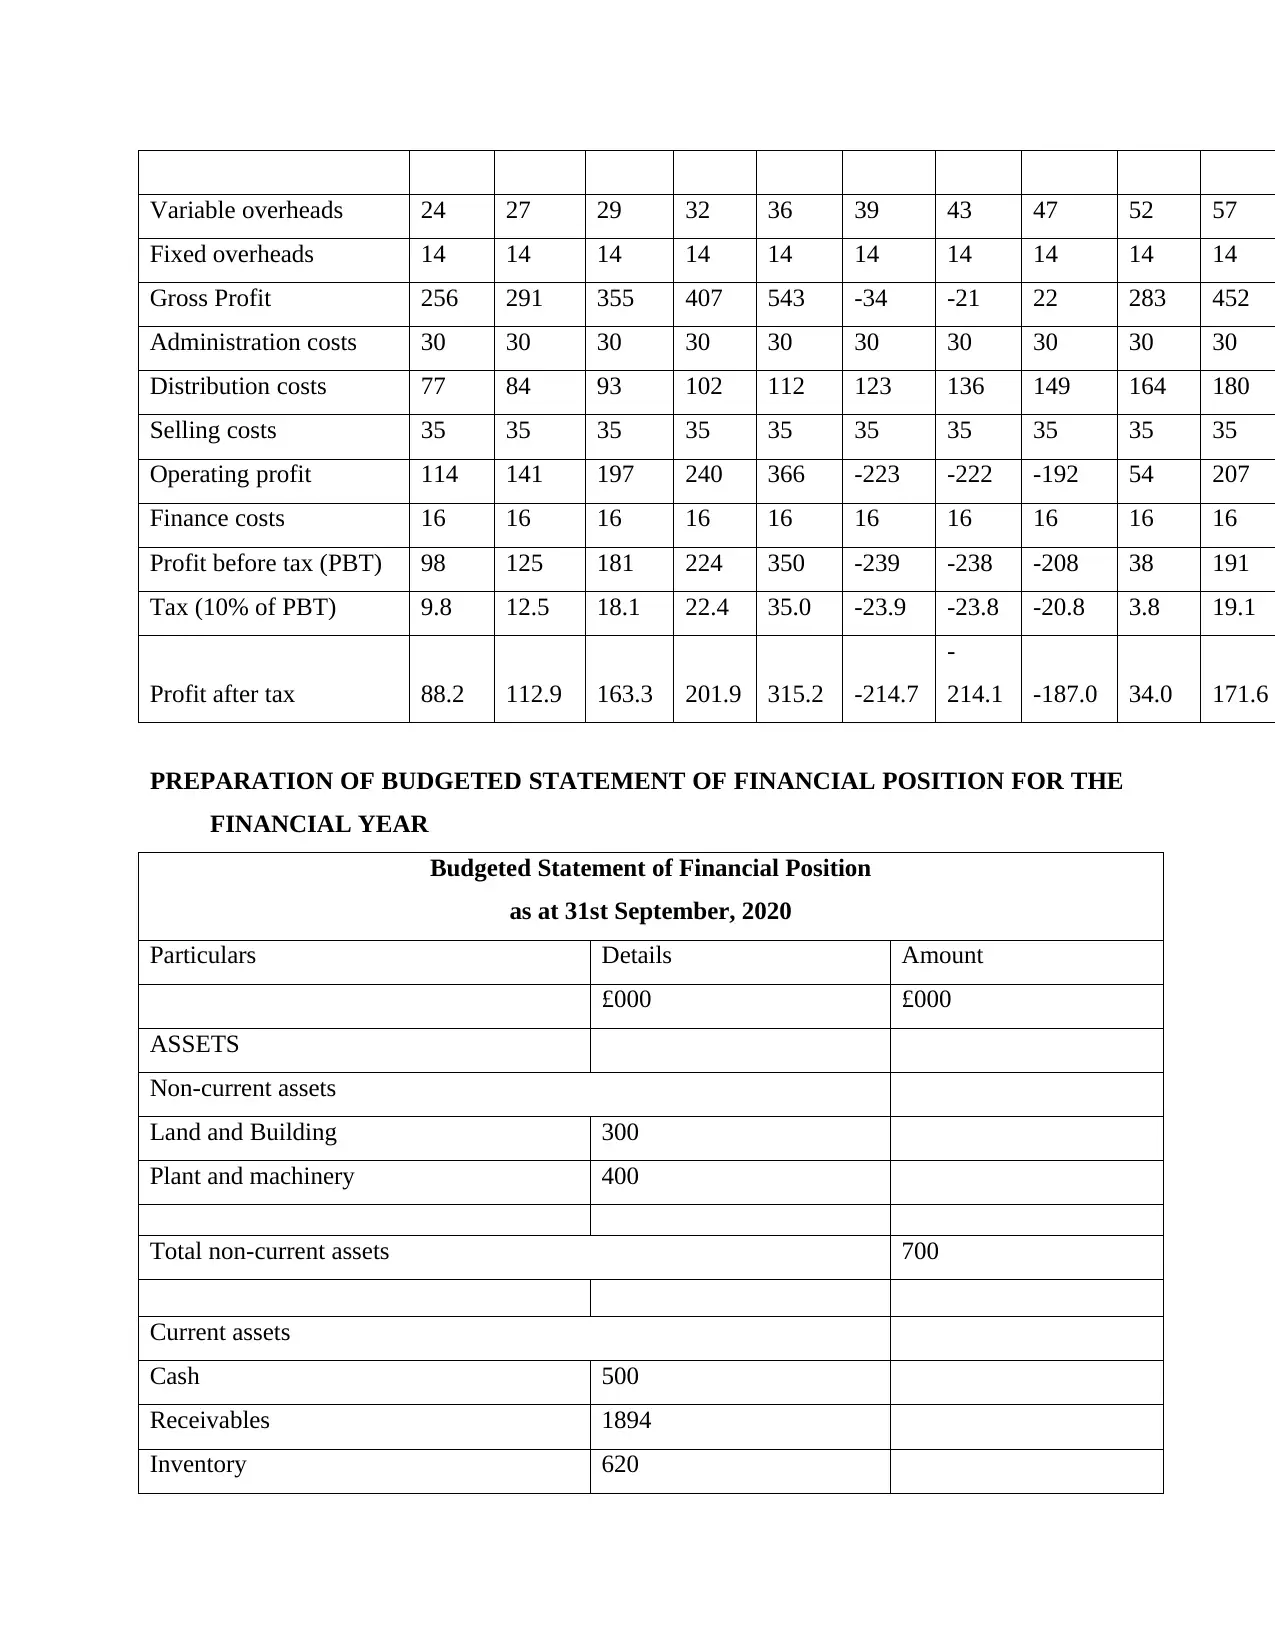
Variable overheads 24 27 29 32 36 39 43 47 52 57
Fixed overheads 14 14 14 14 14 14 14 14 14 14
Gross Profit 256 291 355 407 543 -34 -21 22 283 452
Administration costs 30 30 30 30 30 30 30 30 30 30
Distribution costs 77 84 93 102 112 123 136 149 164 180
Selling costs 35 35 35 35 35 35 35 35 35 35
Operating profit 114 141 197 240 366 -223 -222 -192 54 207
Finance costs 16 16 16 16 16 16 16 16 16 16
Profit before tax (PBT) 98 125 181 224 350 -239 -238 -208 38 191
Tax (10% of PBT) 9.8 12.5 18.1 22.4 35.0 -23.9 -23.8 -20.8 3.8 19.1
Profit after tax 88.2 112.9 163.3 201.9 315.2 -214.7
-
214.1 -187.0 34.0 171.6
PREPARATION OF BUDGETED STATEMENT OF FINANCIAL POSITION FOR THE
FINANCIAL YEAR
Budgeted Statement of Financial Position
as at 31st September, 2020
Particulars Details Amount
£000 £000
ASSETS
Non-current assets
Land and Building 300
Plant and machinery 400
Total non-current assets 700
Current assets
Cash 500
Receivables 1894
Inventory 620
Prepayments 35
Accrued Income 25
Total current assets 3074
Total Assets 3774
EQUITIES AND LIABILITIES
Current liabilities
Payables 412
Accruals 55
Total current liabilities 467
Non-current liabilities
Long-term Bank loan 100
Equity
Share capital 1000
Retained earnings 2207.1
Total equities and liabilities 3774
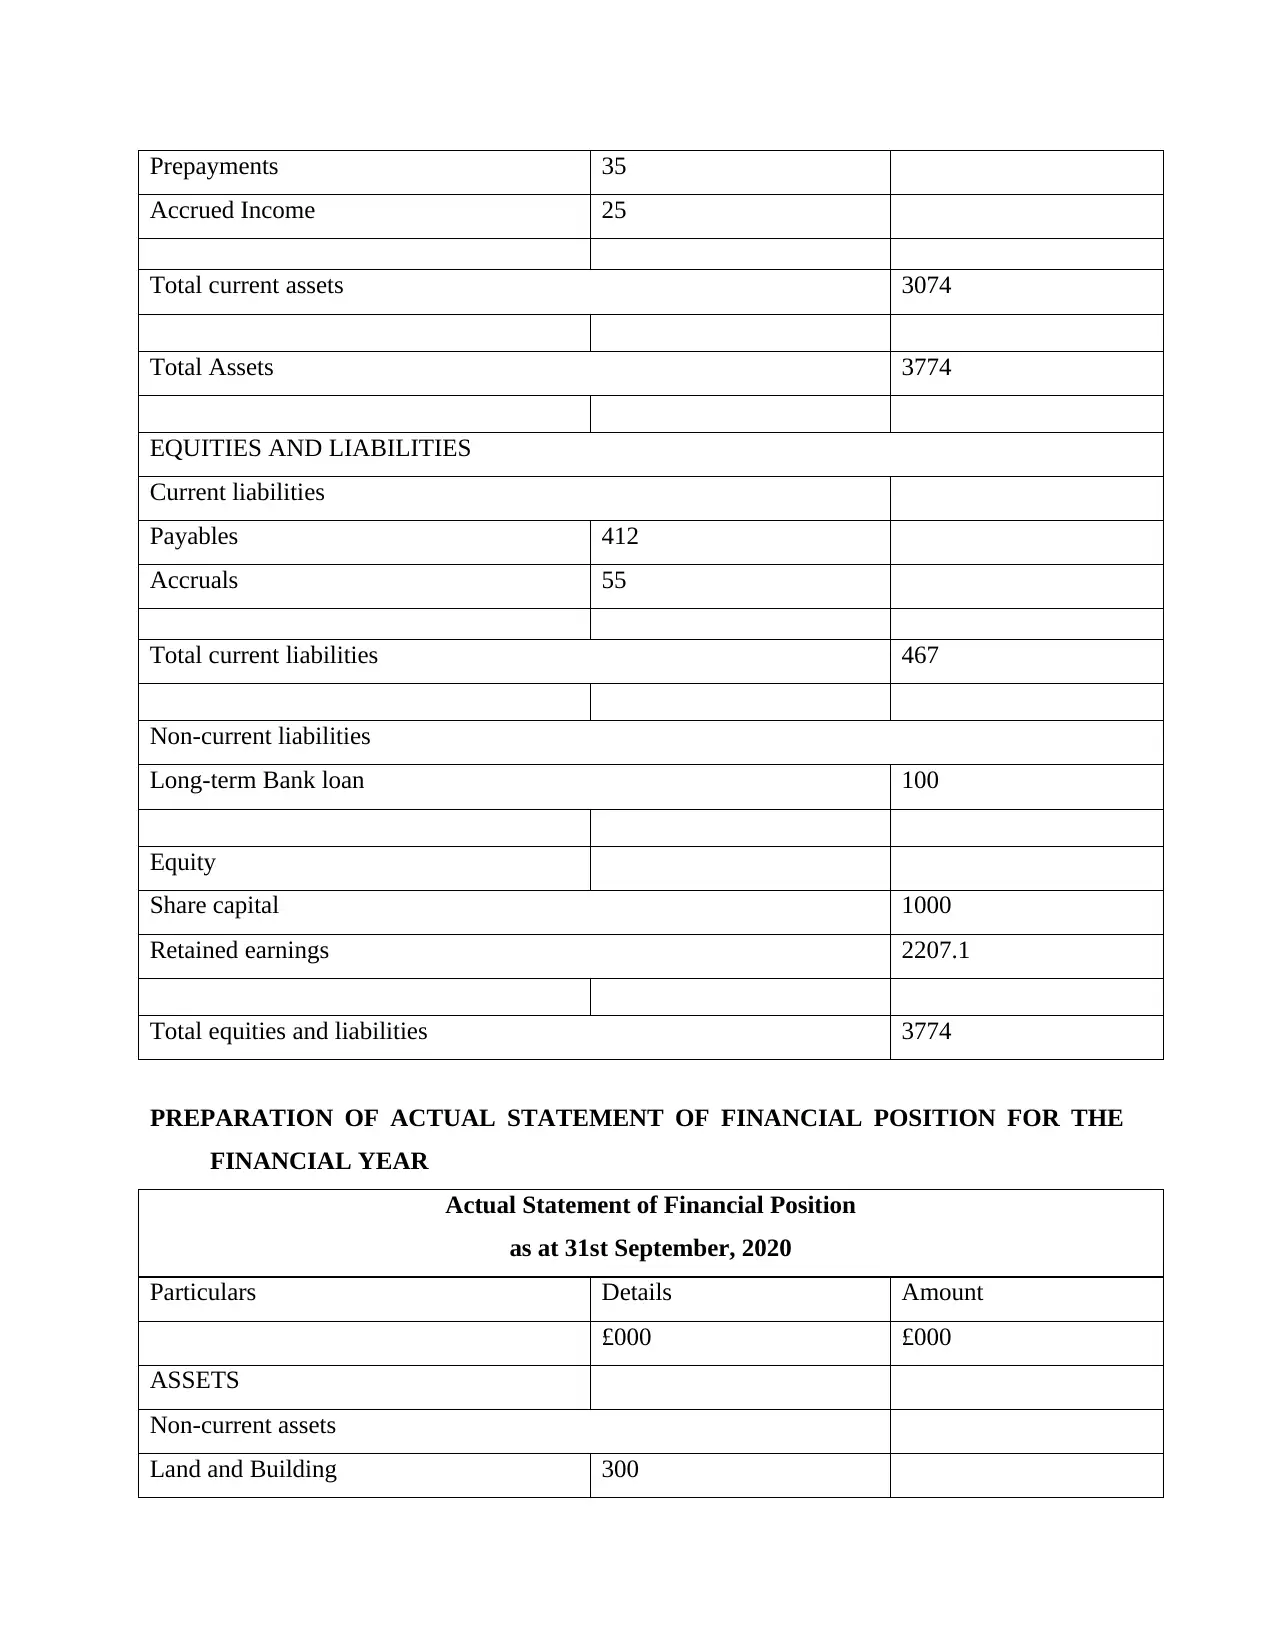
PREPARATION OF ACTUAL STATEMENT OF FINANCIAL POSITION FOR THE
FINANCIAL YEAR
Actual Statement of Financial Position
as at 31st September, 2020
Particulars Details Amount
£000 £000
ASSETS
Non-current assets
Land and Building 300
Accrued Income 25
Total current assets 3074
Total Assets 3774
EQUITIES AND LIABILITIES
Current liabilities
Payables 412
Accruals 55
Total current liabilities 467
Non-current liabilities
Long-term Bank loan 100
Equity
Share capital 1000
Retained earnings 2207.1
Total equities and liabilities 3774
PREPARATION OF ACTUAL STATEMENT OF FINANCIAL POSITION FOR THE
FINANCIAL YEAR
Actual Statement of Financial Position
as at 31st September, 2020
Particulars Details Amount
£000 £000
ASSETS
Non-current assets
Land and Building 300
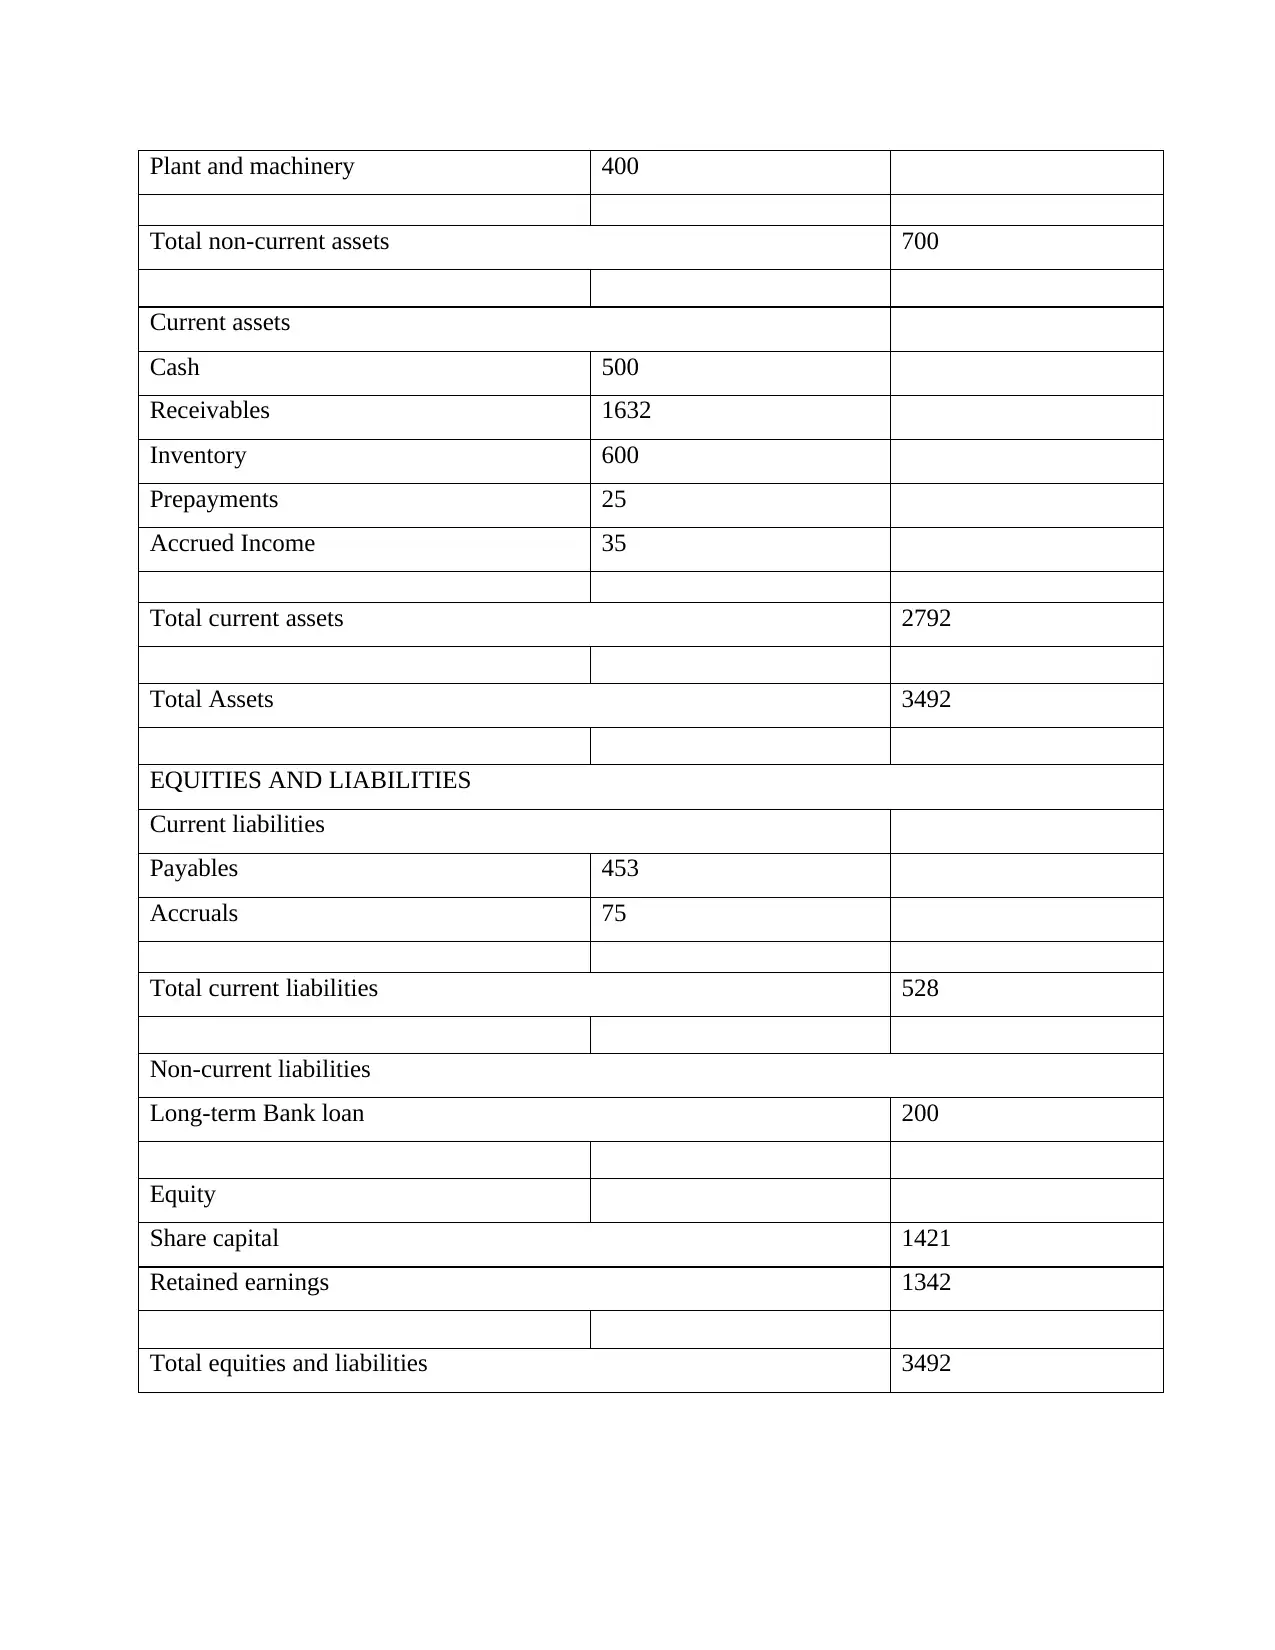
Plant and machinery 400
Total non-current assets 700
Current assets
Cash 500
Receivables 1632
Inventory 600
Prepayments 25
Accrued Income 35
Total current assets 2792
Total Assets 3492
EQUITIES AND LIABILITIES
Current liabilities
Payables 453
Accruals 75
Total current liabilities 528
Non-current liabilities
Long-term Bank loan 200
Equity
Share capital 1421
Retained earnings 1342
Total equities and liabilities 3492
Paraphrase This Document
Need a fresh take? Get an instant paraphrase of this document with our AI Paraphraser
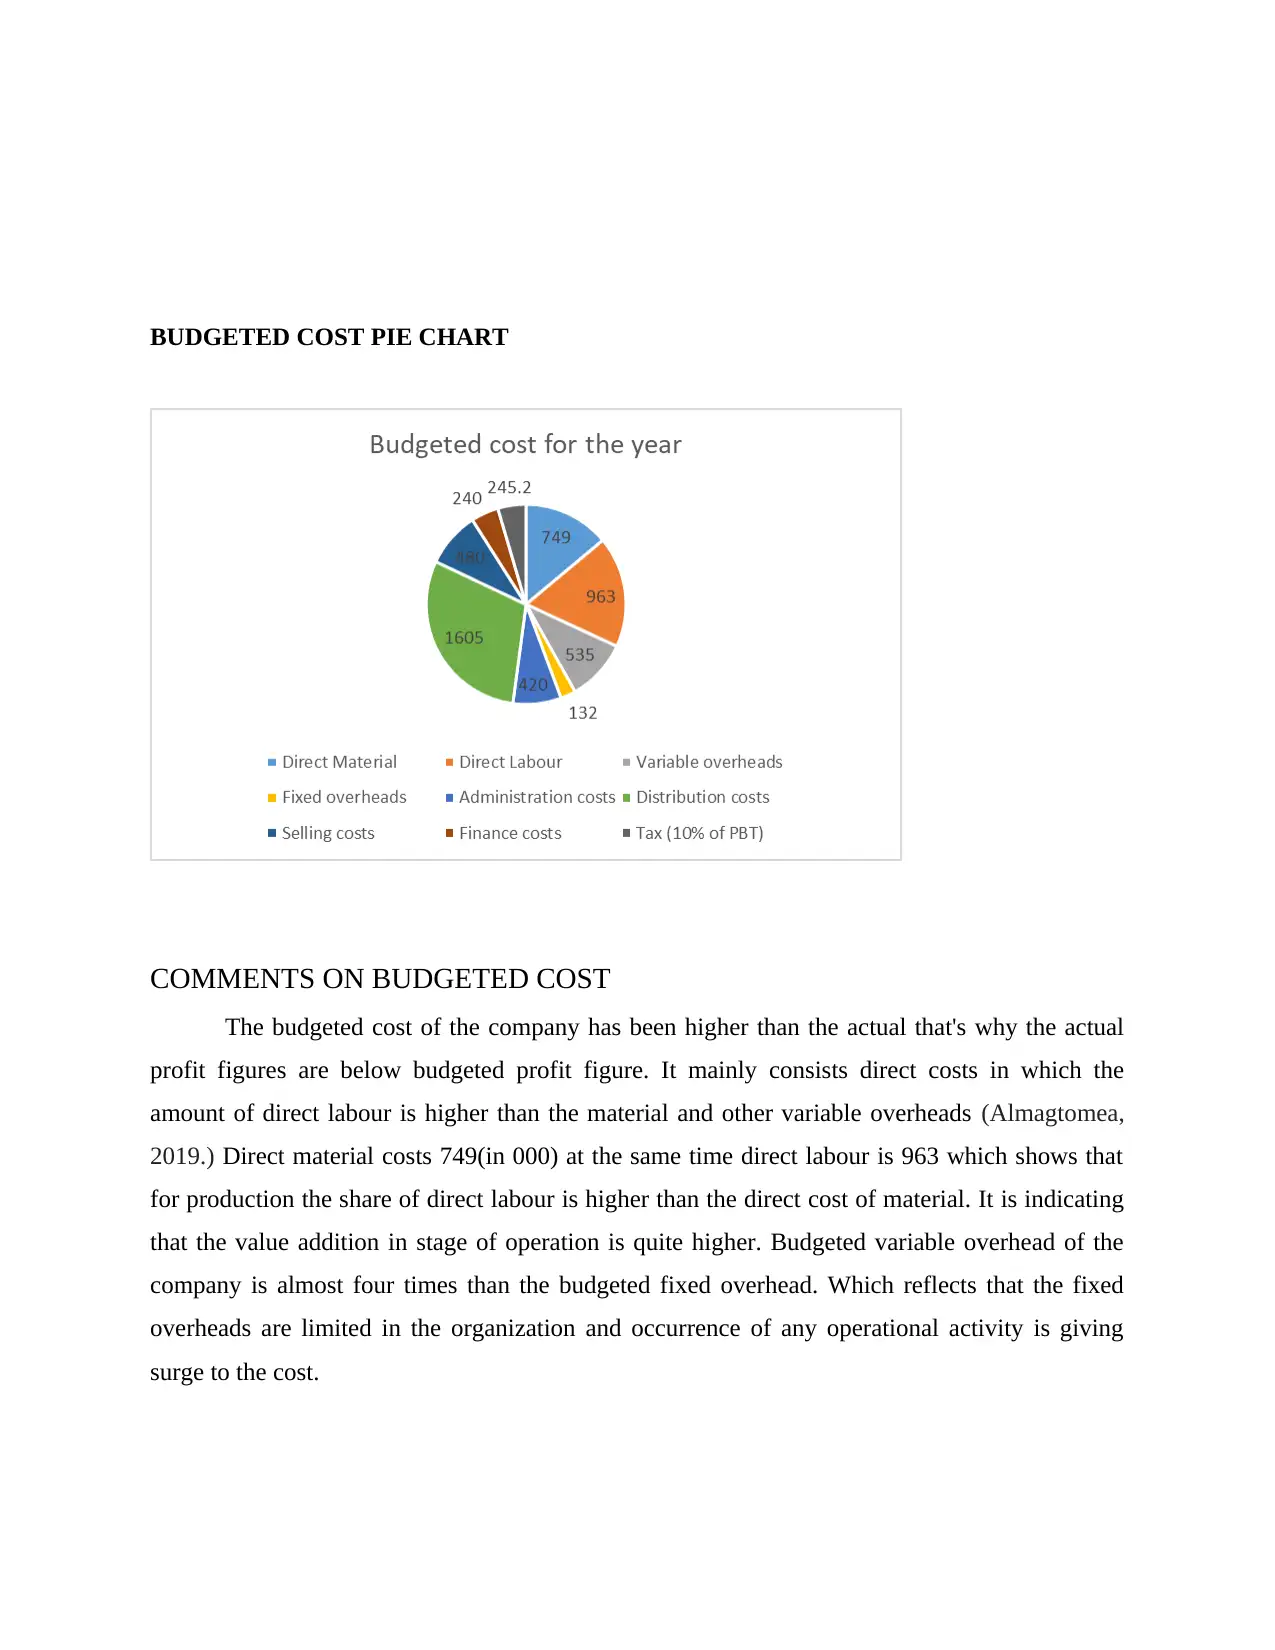
BUDGETED COST PIE CHART
COMMENTS ON BUDGETED COST
The budgeted cost of the company has been higher than the actual that's why the actual
profit figures are below budgeted profit figure. It mainly consists direct costs in which the
amount of direct labour is higher than the material and other variable overheads (Almagtomea,
2019.) Direct material costs 749(in 000) at the same time direct labour is 963 which shows that
for production the share of direct labour is higher than the direct cost of material. It is indicating
that the value addition in stage of operation is quite higher. Budgeted variable overhead of the
company is almost four times than the budgeted fixed overhead. Which reflects that the fixed
overheads are limited in the organization and occurrence of any operational activity is giving
surge to the cost.
The administrative cost of the entity is 420(in 000) which is more than three times of
fixed overhead which shows that the company has budgeted higher amount to its administrative
actions. It may be seen from different angle as well since if it is seen relatively yet the
administrative cost is quite higher than fixed overhead. The biggest component of the budgeted
cost is distribution cost. Which is in four figures and constituting a huge share of total budgeted
cost of the company. It is 1605 which is almost double or more than double of direct material
and almost three times of variable overhead. It shows that as per the anticoagulation of the entity
they are looking for most efforts in distribution. If we compare it with the prime cost yet it is
significant (Gamayuni, 2018.)
The budgeted prime cost is 1712 which is a bit more than the budgeted distribution cost.
Budgeted selling cost of the company is around fourth part of the distribution cost. It shows that
the company wants to pay more attention to its selling and distribution functions. Financial cost
of the organization is just 240 which is satisfactory since shows that the company is more relying
on equity so the fixed costs are expected lower. But it would impact while paying tax because the
amount paid to load providers is exempted and this is the reason company is anticipating to pay
around 245.2 as tax.
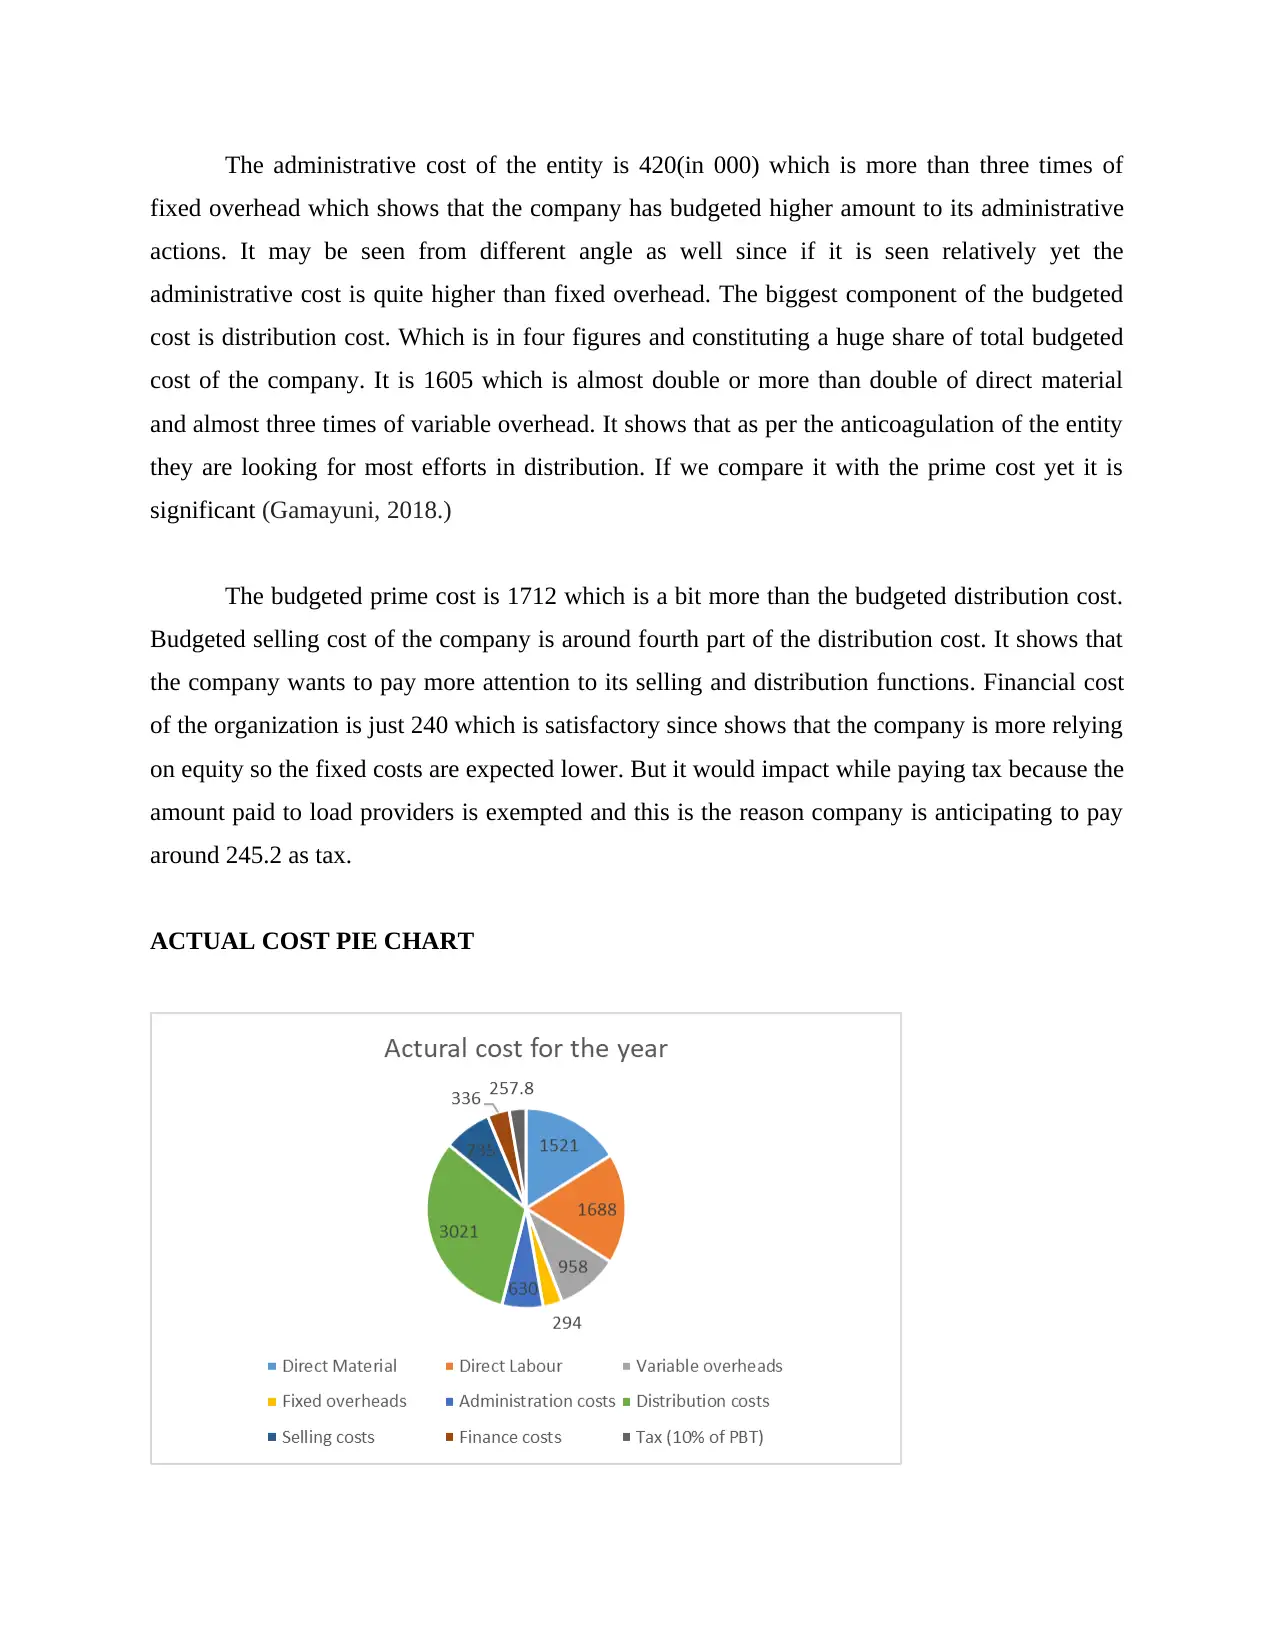
ACTUAL COST PIE CHART
fixed overhead which shows that the company has budgeted higher amount to its administrative
actions. It may be seen from different angle as well since if it is seen relatively yet the
administrative cost is quite higher than fixed overhead. The biggest component of the budgeted
cost is distribution cost. Which is in four figures and constituting a huge share of total budgeted
cost of the company. It is 1605 which is almost double or more than double of direct material
and almost three times of variable overhead. It shows that as per the anticoagulation of the entity
they are looking for most efforts in distribution. If we compare it with the prime cost yet it is
significant (Gamayuni, 2018.)
The budgeted prime cost is 1712 which is a bit more than the budgeted distribution cost.
Budgeted selling cost of the company is around fourth part of the distribution cost. It shows that
the company wants to pay more attention to its selling and distribution functions. Financial cost
of the organization is just 240 which is satisfactory since shows that the company is more relying
on equity so the fixed costs are expected lower. But it would impact while paying tax because the
amount paid to load providers is exempted and this is the reason company is anticipating to pay
around 245.2 as tax.
ACTUAL COST PIE CHART
COMMENTS ON ACTUAL COST
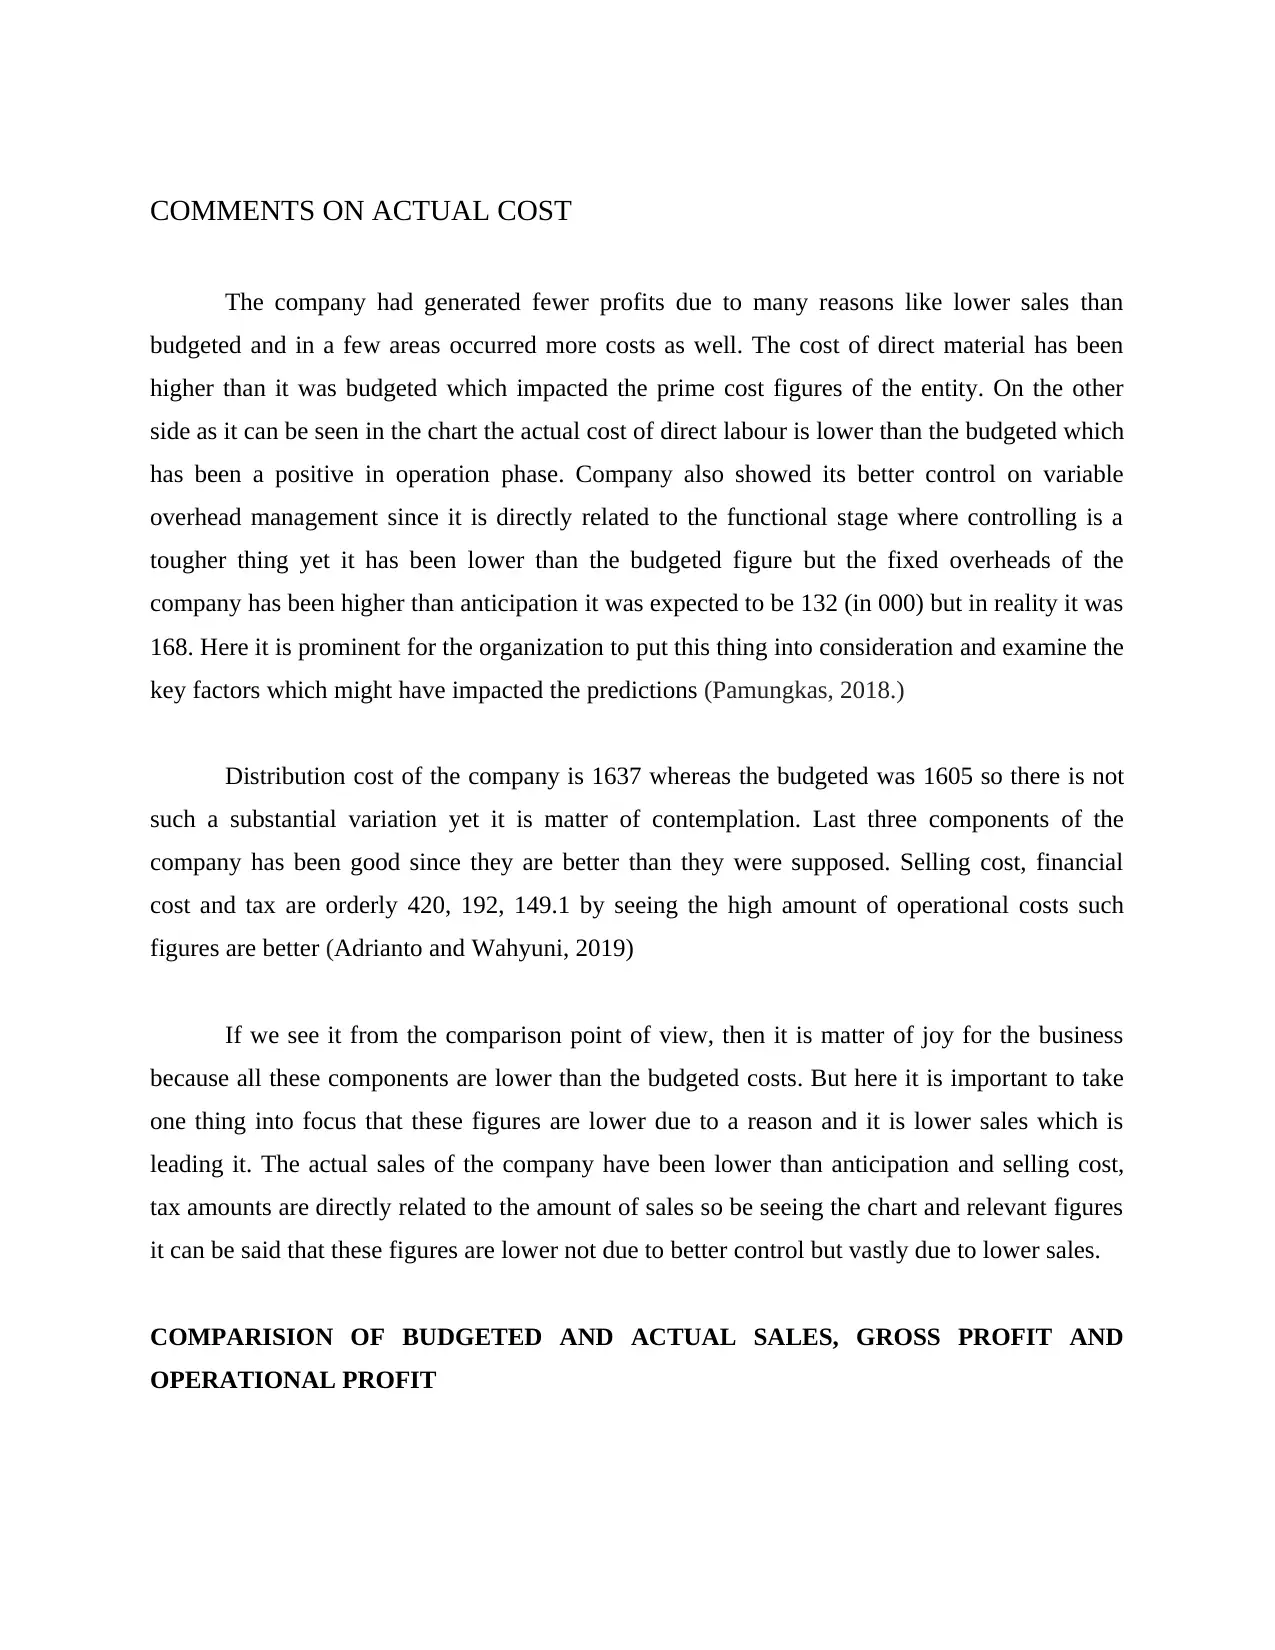
The company had generated fewer profits due to many reasons like lower sales than
budgeted and in a few areas occurred more costs as well. The cost of direct material has been
higher than it was budgeted which impacted the prime cost figures of the entity. On the other
side as it can be seen in the chart the actual cost of direct labour is lower than the budgeted which
has been a positive in operation phase. Company also showed its better control on variable
overhead management since it is directly related to the functional stage where controlling is a
tougher thing yet it has been lower than the budgeted figure but the fixed overheads of the
company has been higher than anticipation it was expected to be 132 (in 000) but in reality it was
168. Here it is prominent for the organization to put this thing into consideration and examine the
key factors which might have impacted the predictions (Pamungkas, 2018.)
Distribution cost of the company is 1637 whereas the budgeted was 1605 so there is not
such a substantial variation yet it is matter of contemplation. Last three components of the
company has been good since they are better than they were supposed. Selling cost, financial
cost and tax are orderly 420, 192, 149.1 by seeing the high amount of operational costs such
figures are better (Adrianto and Wahyuni, 2019)
If we see it from the comparison point of view, then it is matter of joy for the business
because all these components are lower than the budgeted costs. But here it is important to take
one thing into focus that these figures are lower due to a reason and it is lower sales which is
leading it. The actual sales of the company have been lower than anticipation and selling cost,
tax amounts are directly related to the amount of sales so be seeing the chart and relevant figures
it can be said that these figures are lower not due to better control but vastly due to lower sales.
COMPARISION OF BUDGETED AND ACTUAL SALES, GROSS PROFIT AND
OPERATIONAL PROFIT
Secure Best Marks with AI Grader
Need help grading? Try our AI Grader for instant feedback on your assignments.
COMMENTS ON SALES, GROSS PROFIT AND OPERATING PROFIT
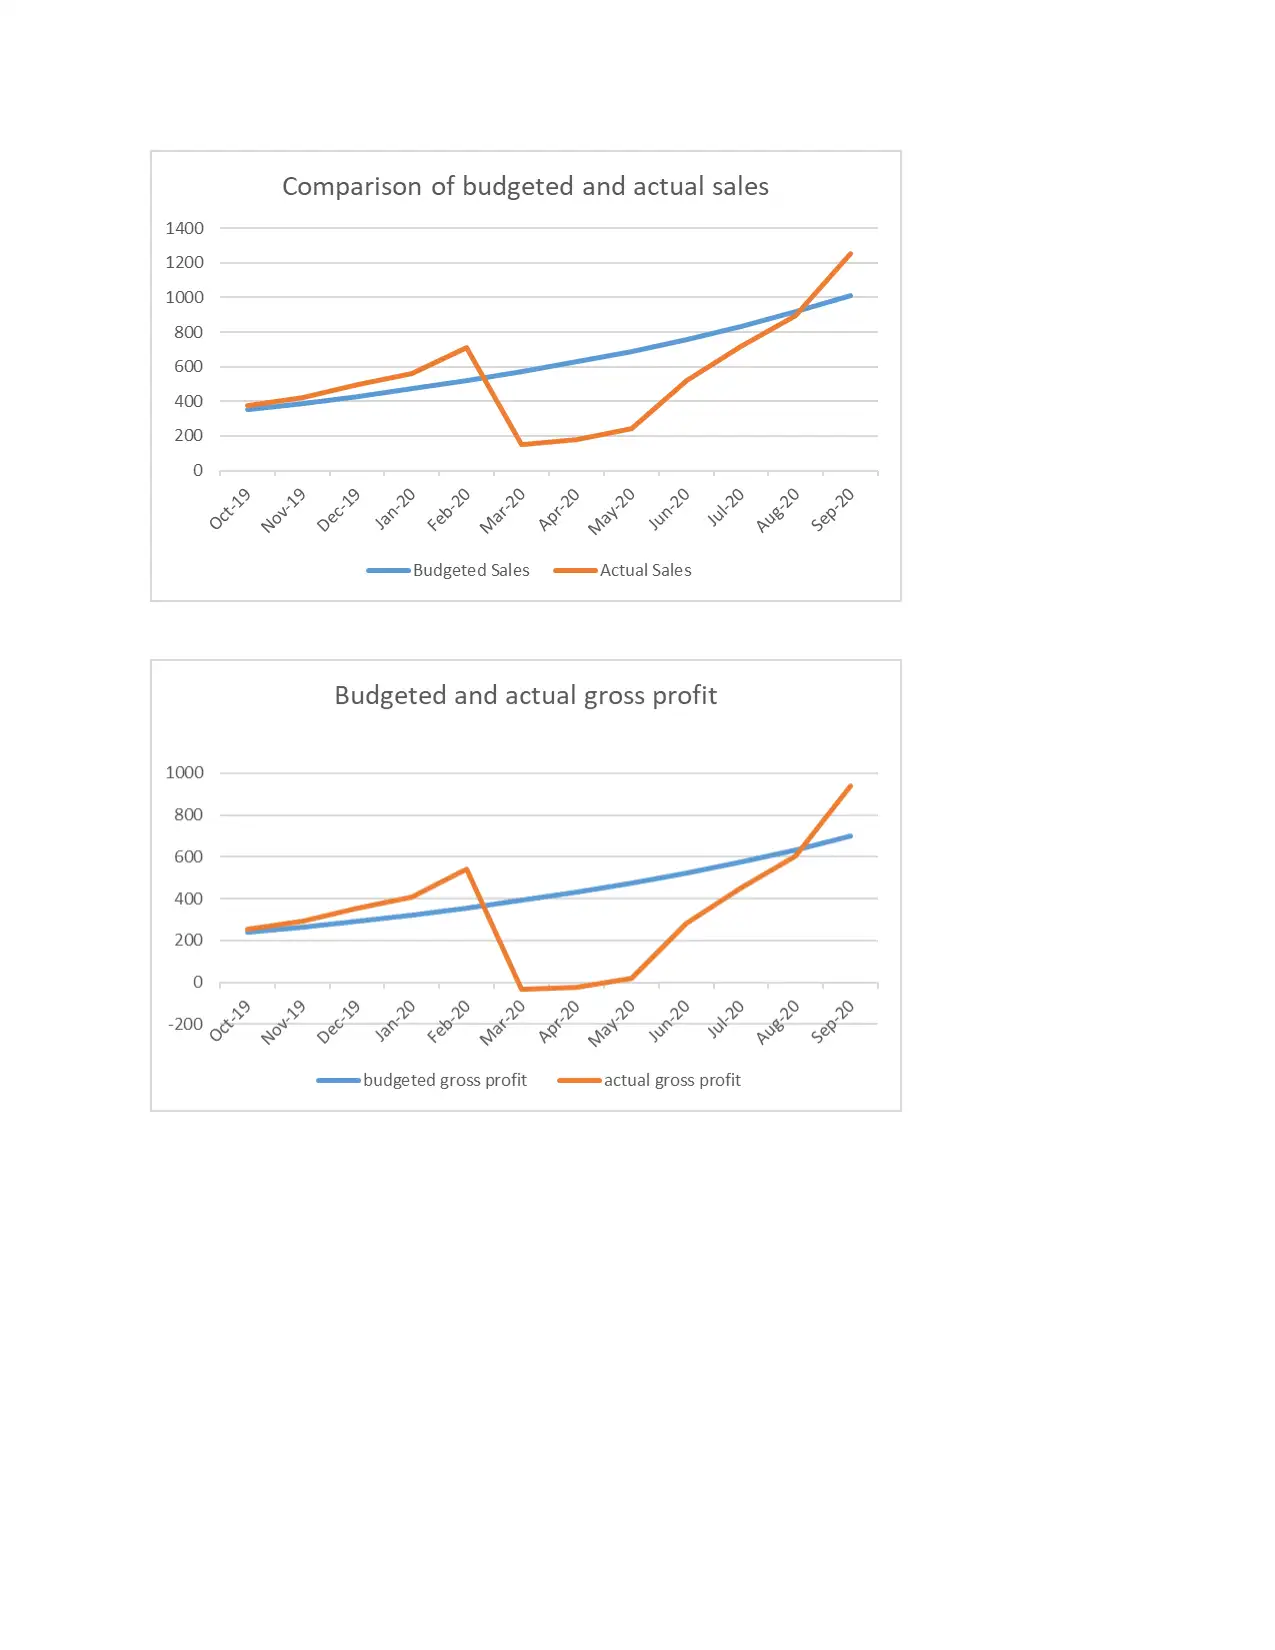
The sales line graphs of the company are showing a drastic variation between budgeted
and actual sales. In the initial months the actual sales were riding over the budgeted sales but
from February it dived and then it took more than six months for getting its position back. At last
in august it again crossed the budgeted line, After January the only month in which it has shown
sharp upside growth is September (Setiyani, 2018. )
The graph of budgeted and actual gross profit is showing the same pattern as sales
showed due to direct relationship of sales and gross profit of an organization. The gross profit is
also following the same trend and having direct implications of sales of the company. That's why
actual gross profit of the entity has been lower till the time when sales have been in negative
figure.
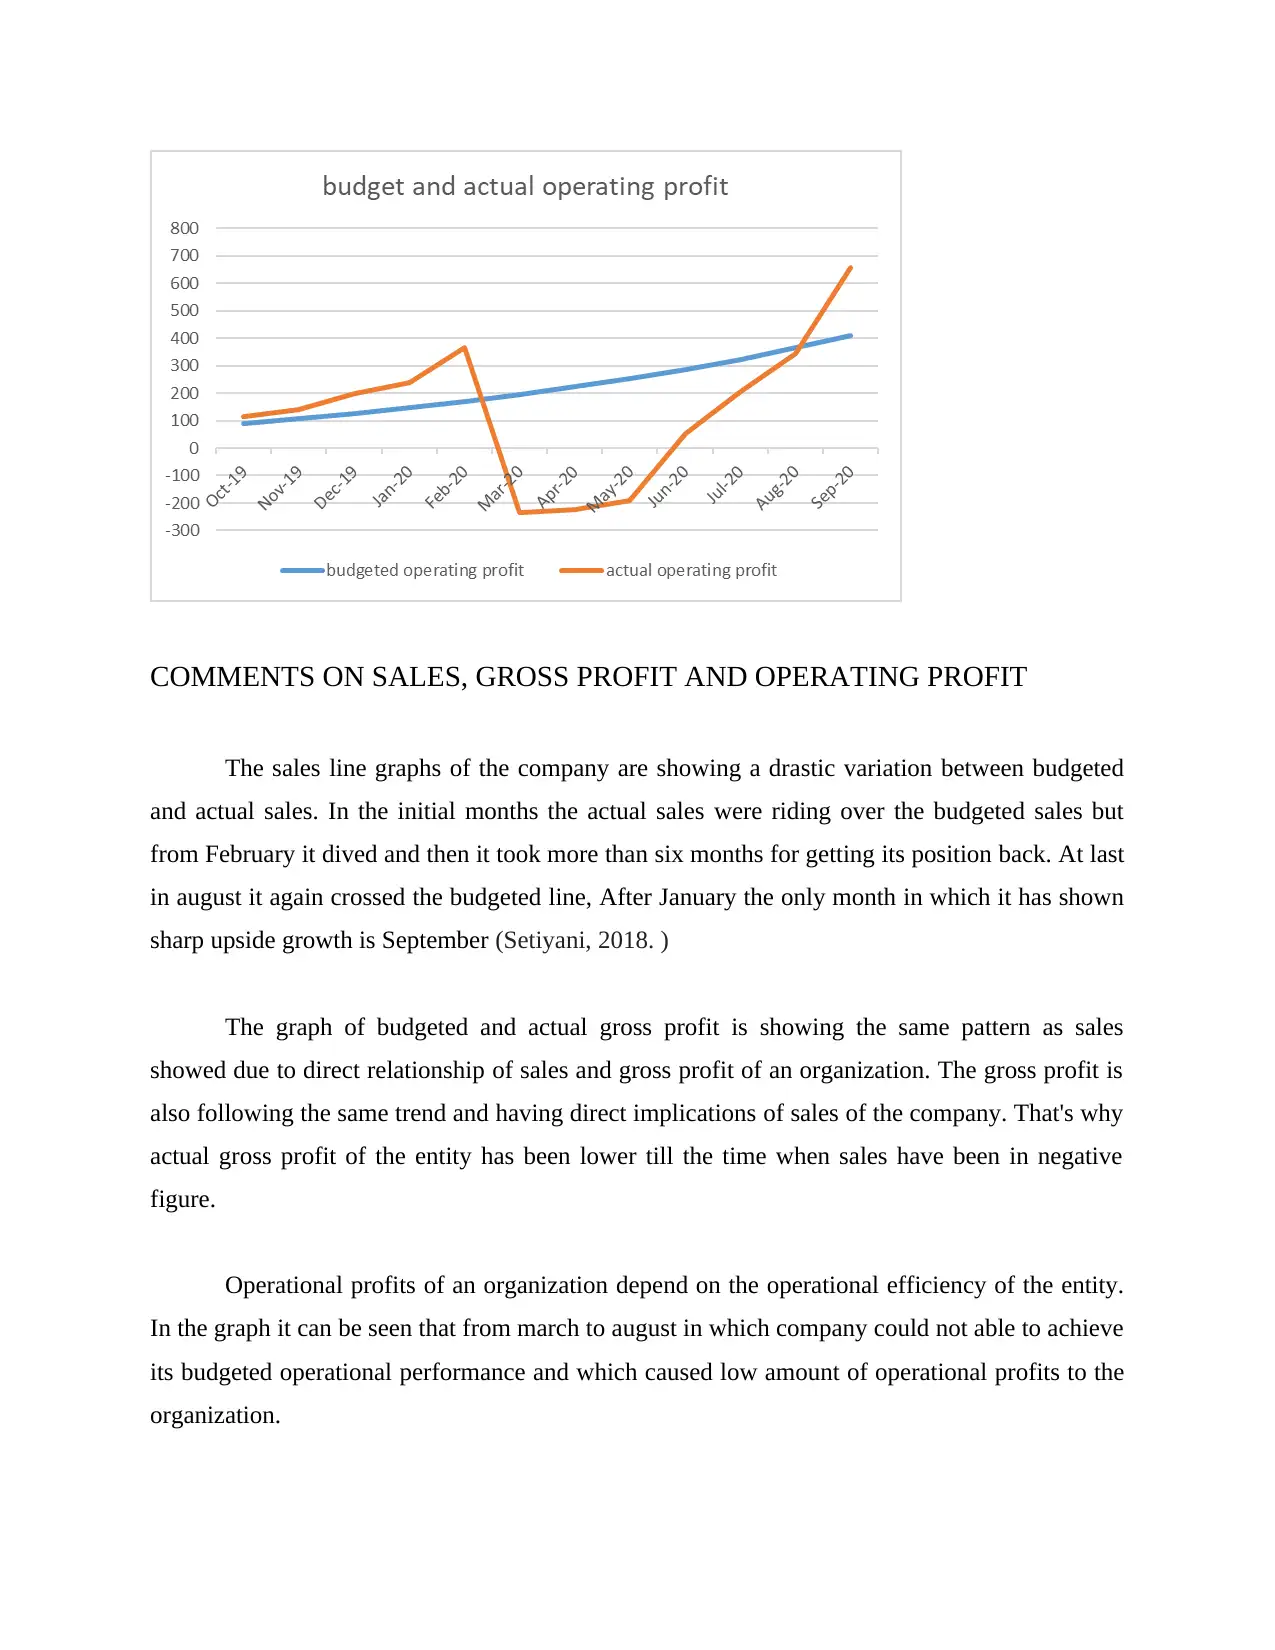
Operational profits of an organization depend on the operational efficiency of the entity.
In the graph it can be seen that from march to august in which company could not able to achieve
its budgeted operational performance and which caused low amount of operational profits to the
organization.
The sales line graphs of the company are showing a drastic variation between budgeted
and actual sales. In the initial months the actual sales were riding over the budgeted sales but
from February it dived and then it took more than six months for getting its position back. At last
in august it again crossed the budgeted line, After January the only month in which it has shown
sharp upside growth is September (Setiyani, 2018. )
The graph of budgeted and actual gross profit is showing the same pattern as sales
showed due to direct relationship of sales and gross profit of an organization. The gross profit is
also following the same trend and having direct implications of sales of the company. That's why
actual gross profit of the entity has been lower till the time when sales have been in negative
figure.
Operational profits of an organization depend on the operational efficiency of the entity.
In the graph it can be seen that from march to august in which company could not able to achieve
its budgeted operational performance and which caused low amount of operational profits to the
organization.
RATIO CALCULATION AND INTERPRETATION ON PERFORMANCE OF
COMPANY
Profitability Ratio
Particulars Formula
Budgeted
Year
Actual
Year
Net Profit 2207.1 1342.3
Net Sales 7577 6527
Total assets 3774 3492
Total current liabilities 467 528
Capital employed
Total assets - Total current
liabilities 3307 2964
Net profit margin Net Profit / Net sales * 100 29% 21%
Return on capital
employed
Net profit / Capital employed
* 100 67% 45%
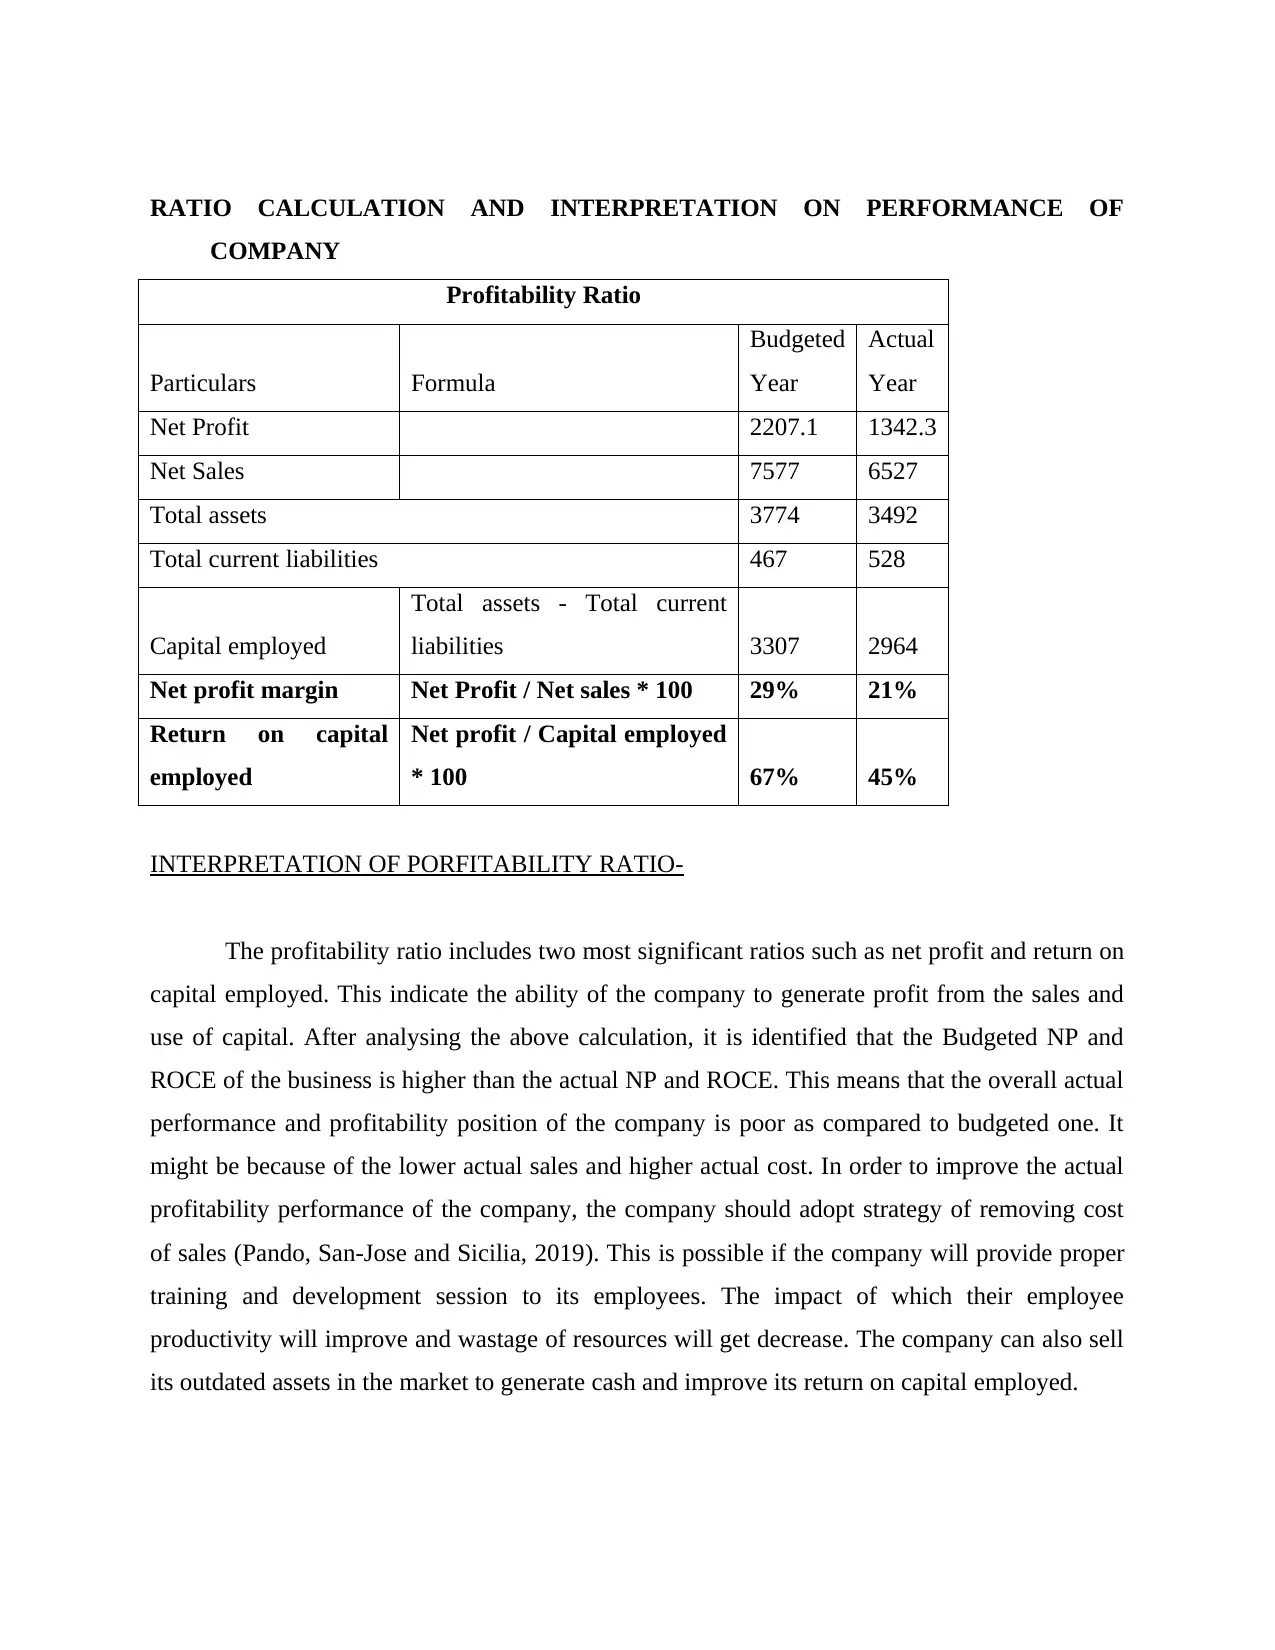
INTERPRETATION OF PORFITABILITY RATIO-
The profitability ratio includes two most significant ratios such as net profit and return on
capital employed. This indicate the ability of the company to generate profit from the sales and
use of capital. After analysing the above calculation, it is identified that the Budgeted NP and
ROCE of the business is higher than the actual NP and ROCE. This means that the overall actual
performance and profitability position of the company is poor as compared to budgeted one. It
might be because of the lower actual sales and higher actual cost. In order to improve the actual
profitability performance of the company, the company should adopt strategy of removing cost
of sales (Pando, San-Jose and Sicilia, 2019). This is possible if the company will provide proper
training and development session to its employees. The impact of which their employee
productivity will improve and wastage of resources will get decrease. The company can also sell
its outdated assets in the market to generate cash and improve its return on capital employed.
COMPANY
Profitability Ratio
Particulars Formula
Budgeted
Year
Actual
Year
Net Profit 2207.1 1342.3
Net Sales 7577 6527
Total assets 3774 3492
Total current liabilities 467 528
Capital employed
Total assets - Total current
liabilities 3307 2964
Net profit margin Net Profit / Net sales * 100 29% 21%
Return on capital
employed
Net profit / Capital employed
* 100 67% 45%
INTERPRETATION OF PORFITABILITY RATIO-
The profitability ratio includes two most significant ratios such as net profit and return on
capital employed. This indicate the ability of the company to generate profit from the sales and
use of capital. After analysing the above calculation, it is identified that the Budgeted NP and
ROCE of the business is higher than the actual NP and ROCE. This means that the overall actual
performance and profitability position of the company is poor as compared to budgeted one. It
might be because of the lower actual sales and higher actual cost. In order to improve the actual
profitability performance of the company, the company should adopt strategy of removing cost
of sales (Pando, San-Jose and Sicilia, 2019). This is possible if the company will provide proper
training and development session to its employees. The impact of which their employee
productivity will improve and wastage of resources will get decrease. The company can also sell
its outdated assets in the market to generate cash and improve its return on capital employed.
Paraphrase This Document
Need a fresh take? Get an instant paraphrase of this document with our AI Paraphraser
Liquidity Ratio
Particulars Formula
Budgeted
Year
Actual
Year
Current assets 3074 2792
Current liabilities 467 528
Inventory 620 600
Prepayments 35 25
Quick assets
Current assets - inventory -
prepayments 2419 2167
Current ratio
Current assets / Current
liabilities 6.58 5.29
Quick assets
Quick assets / Current
liabilities 5.2 4.1
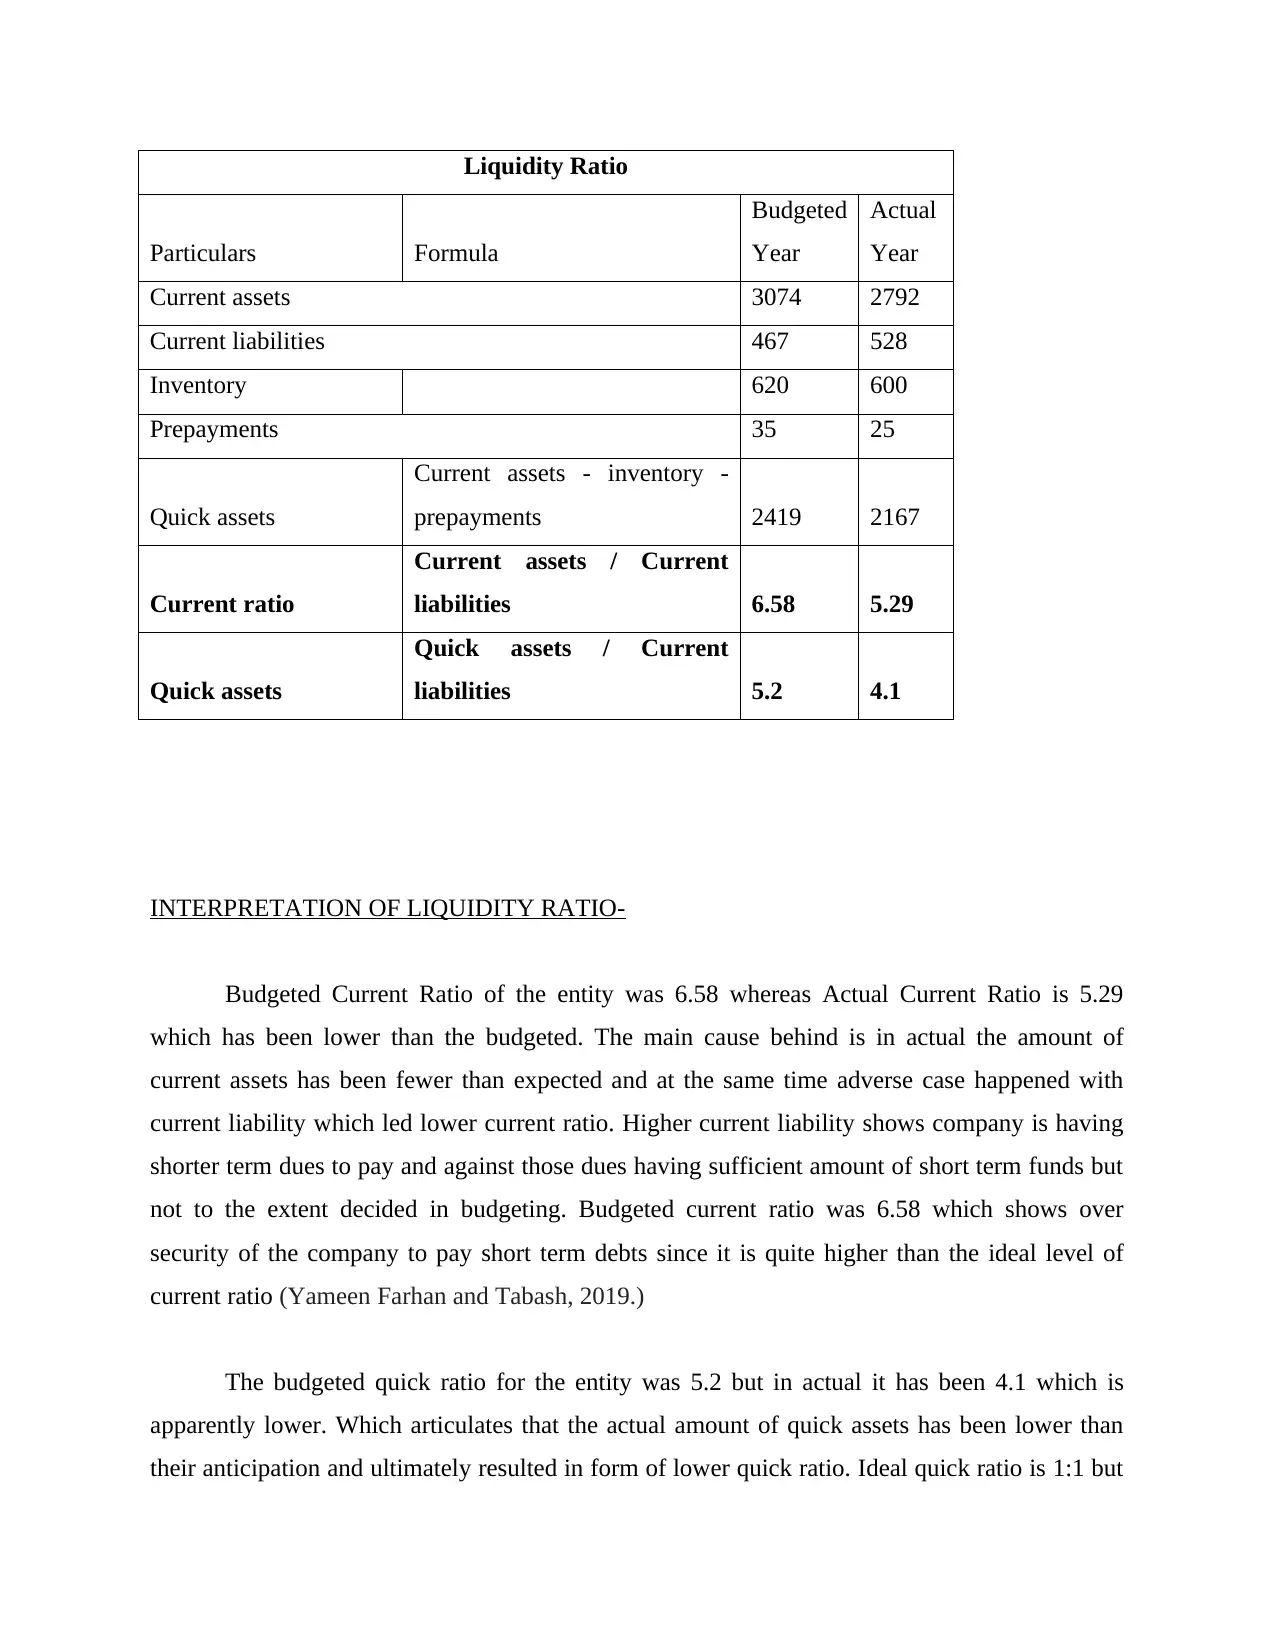
INTERPRETATION OF LIQUIDITY RATIO-
Budgeted Current Ratio of the entity was 6.58 whereas Actual Current Ratio is 5.29
which has been lower than the budgeted. The main cause behind is in actual the amount of
current assets has been fewer than expected and at the same time adverse case happened with
current liability which led lower current ratio. Higher current liability shows company is having
shorter term dues to pay and against those dues having sufficient amount of short term funds but
not to the extent decided in budgeting. Budgeted current ratio was 6.58 which shows over
security of the company to pay short term debts since it is quite higher than the ideal level of
current ratio (Yameen Farhan and Tabash, 2019.)
The budgeted quick ratio for the entity was 5.2 but in actual it has been 4.1 which is
apparently lower. Which articulates that the actual amount of quick assets has been lower than
their anticipation and ultimately resulted in form of lower quick ratio. Ideal quick ratio is 1:1 but
Particulars Formula
Budgeted
Year
Actual
Year
Current assets 3074 2792
Current liabilities 467 528
Inventory 620 600
Prepayments 35 25
Quick assets
Current assets - inventory -
prepayments 2419 2167
Current ratio
Current assets / Current
liabilities 6.58 5.29
Quick assets
Quick assets / Current
liabilities 5.2 4.1
INTERPRETATION OF LIQUIDITY RATIO-
Budgeted Current Ratio of the entity was 6.58 whereas Actual Current Ratio is 5.29
which has been lower than the budgeted. The main cause behind is in actual the amount of
current assets has been fewer than expected and at the same time adverse case happened with
current liability which led lower current ratio. Higher current liability shows company is having
shorter term dues to pay and against those dues having sufficient amount of short term funds but
not to the extent decided in budgeting. Budgeted current ratio was 6.58 which shows over
security of the company to pay short term debts since it is quite higher than the ideal level of
current ratio (Yameen Farhan and Tabash, 2019.)
The budgeted quick ratio for the entity was 5.2 but in actual it has been 4.1 which is
apparently lower. Which articulates that the actual amount of quick assets has been lower than
their anticipation and ultimately resulted in form of lower quick ratio. Ideal quick ratio is 1:1 but
the budgeted quick ratio was more than five which shows the company was too much concerned
about their capacity of encashment of quick assets but in reality it has been 4.1 which not far
away from the desired one.
CONCLUSION
The report above had made statement of financial performance and position for the
company keeping both budgeted and actual figures into consideration. It had also discussed
various aspects of the carried out calculation and presented the performance with diagrams. The
report discussed various dimensions of the comparison between budgeted and actual sales, gross
profit and operational profit for the organization in the year to the fullest extent in attempt to
bring clearer position. At the end of it required ratios got calculated and their interpretation was
also articulated in order to make more sense about the budgeted and actual performance of the
entity and its impacts on the financial figures.
REFERENCES
Books and Journals-
Adrianto, E. and Wahyuni, T., 2019, October. Evaluation of Internal Control Over Financial
Reporting on Inventory Management: A Case Study on Inventory Management at
National Human Right Commission. In 3rd Asia-Pacific Research in Social Sciences
and Humanities Universitas Indonesia Conference (APRISH 2018) (pp. 153-160).
Atlantis Press.
Almagtomea, A., 2019. The integration between financial sustainability and accountability in
higher education institutions: an exploratory case study. Integration. 8(2). pp.202-221.
Bužinskienė, R., 2019. Master budget formation in private companies. Professional studies:
theory and practice: social sciences. (6). pp.32-39.
Gamayuni, R. R., 2018. The effect of internal audit function effectiveness and implementation of
accrual based government accounting standard on financial reporting quality. Review of
Integrative Business and Economics Research. 7(1). pp.46-58.
Pamungkas, B., 2018. Accrual-based accounting implementation in Indonesian’s local
governments compared to other countries’ experiences. Man in India. 98(1). pp.1-23.
Setiyani, A. I., 2018. ANALYSIS OF LIQUIDITY RATIO FINANCIAL STATEMENTS IN
PT. FINANSIA MULTI FINANCE (CREDIT PLUS) TO ASSESS COMPANY
PERFORMANCE. JOSAR (Journal of Students Academic Research). 3(1). pp.114-124.
Shubita, M. F., 2019. Specification of the relationship between the sales expenses and the sales
in Jordanian companies. Innovative Marketing. 15(4). p.57.
Yameen, M., Farhan, N. H. and Tabash, M. I., 2019. The impact of liquidity on firms’
performance: Empirical investigation from Indian pharmaceutical companies. Academic
journal of interdisciplinary studies. 8(3). pp.212-212.
Pando, V., San-Jose, L. A. and Sicilia, J., 2019. Profitability ratio maximization in an inventory
model with stock-dependent demand rate and non-linear holding cost. Applied
Mathematical Modelling. 66. pp.643-661.
Secure Best Marks with AI Grader
Need help grading? Try our AI Grader for instant feedback on your assignments.

1 out of 17


Your All-in-One AI-Powered Toolkit for Academic Success.
+13062052269
info@desklib.com
Available 24*7 on WhatsApp / Email
![[object Object]](/_next/static/media/star-bottom.7253800d.svg)
Unlock your academic potential
© 2024 | Zucol Services PVT LTD | All rights reserved.