Comprehensive Financial Performance Analysis Report of a Business Plan
VerifiedAdded on 2022/12/30

Paraphrase This Document
Report summary..........................................................................................................................................3
Budgeted profit and loss account.............................................................................................................4
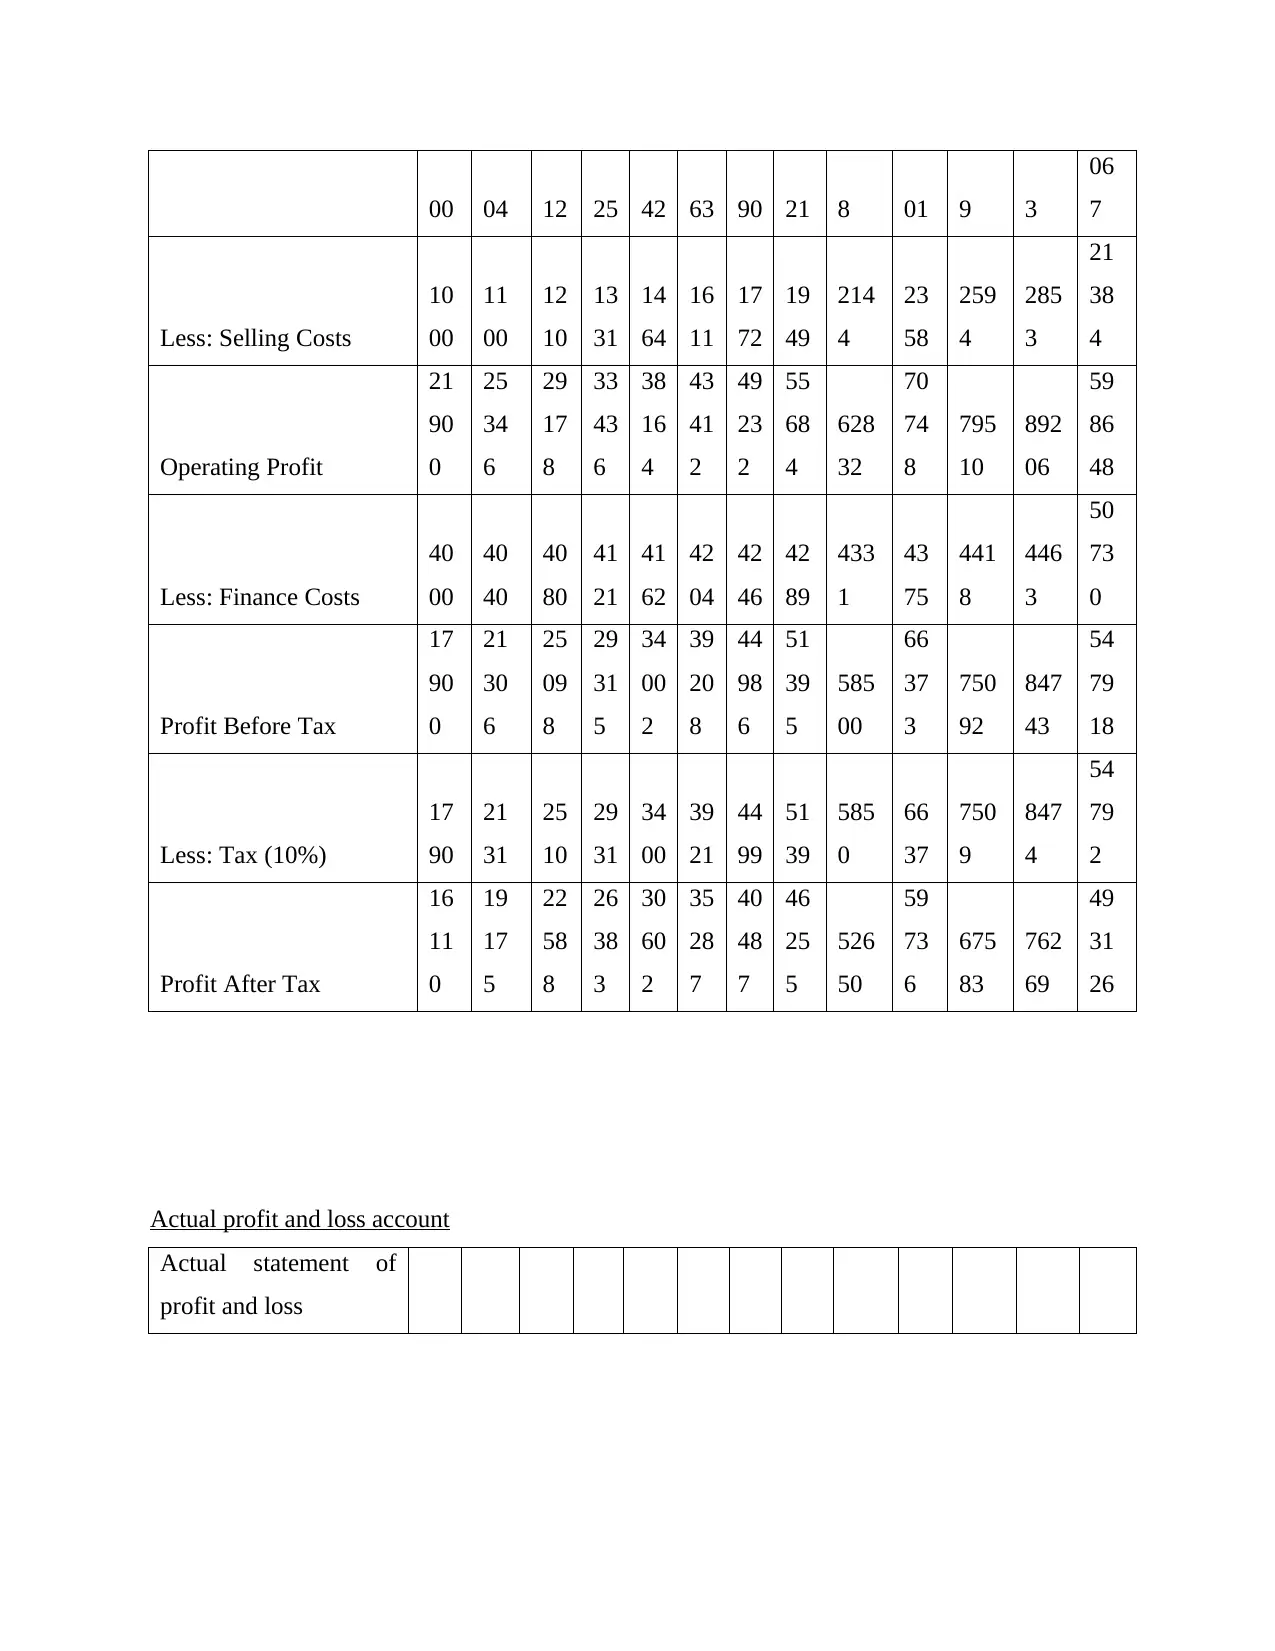
Actual profit and loss account.................................................................................................................5
A pie chart showing the relative size of each of the costs for the year.....................................................7
Graphs for comparing actual outcome with budgeted..............................................................................8
Cost variances........................................................................................................................................11
Actual and budgeted financial statement of position.............................................................................13
Ratio calculation....................................................................................................................................14
Bar charts for different ratios.................................................................................................................15
The report summarizes financial analysis of a factionary company under which data are assumed
to prepare balance sheet and income statement for 12 months. From below done analysis, this
can be stated that company’s performance is better in actual as compared to budgeted data. It has
been proved by help of range of ratios and variances. The report contains detailed information
about analysis of ratio for each aspect including liquidity, profitability and many more. Apart
from this, in the report a detailed statement of balance sheet and profit & loss account is
produced that shows that company’s performance is better under each aspect. Though, there are
some variances which are stating negative result but cannot affect to company’s performance.
⊘ This is a preview!⊘
Do you want full access?
Subscribe today to unlock all pages.
Trusted by 1+ million students worldwide
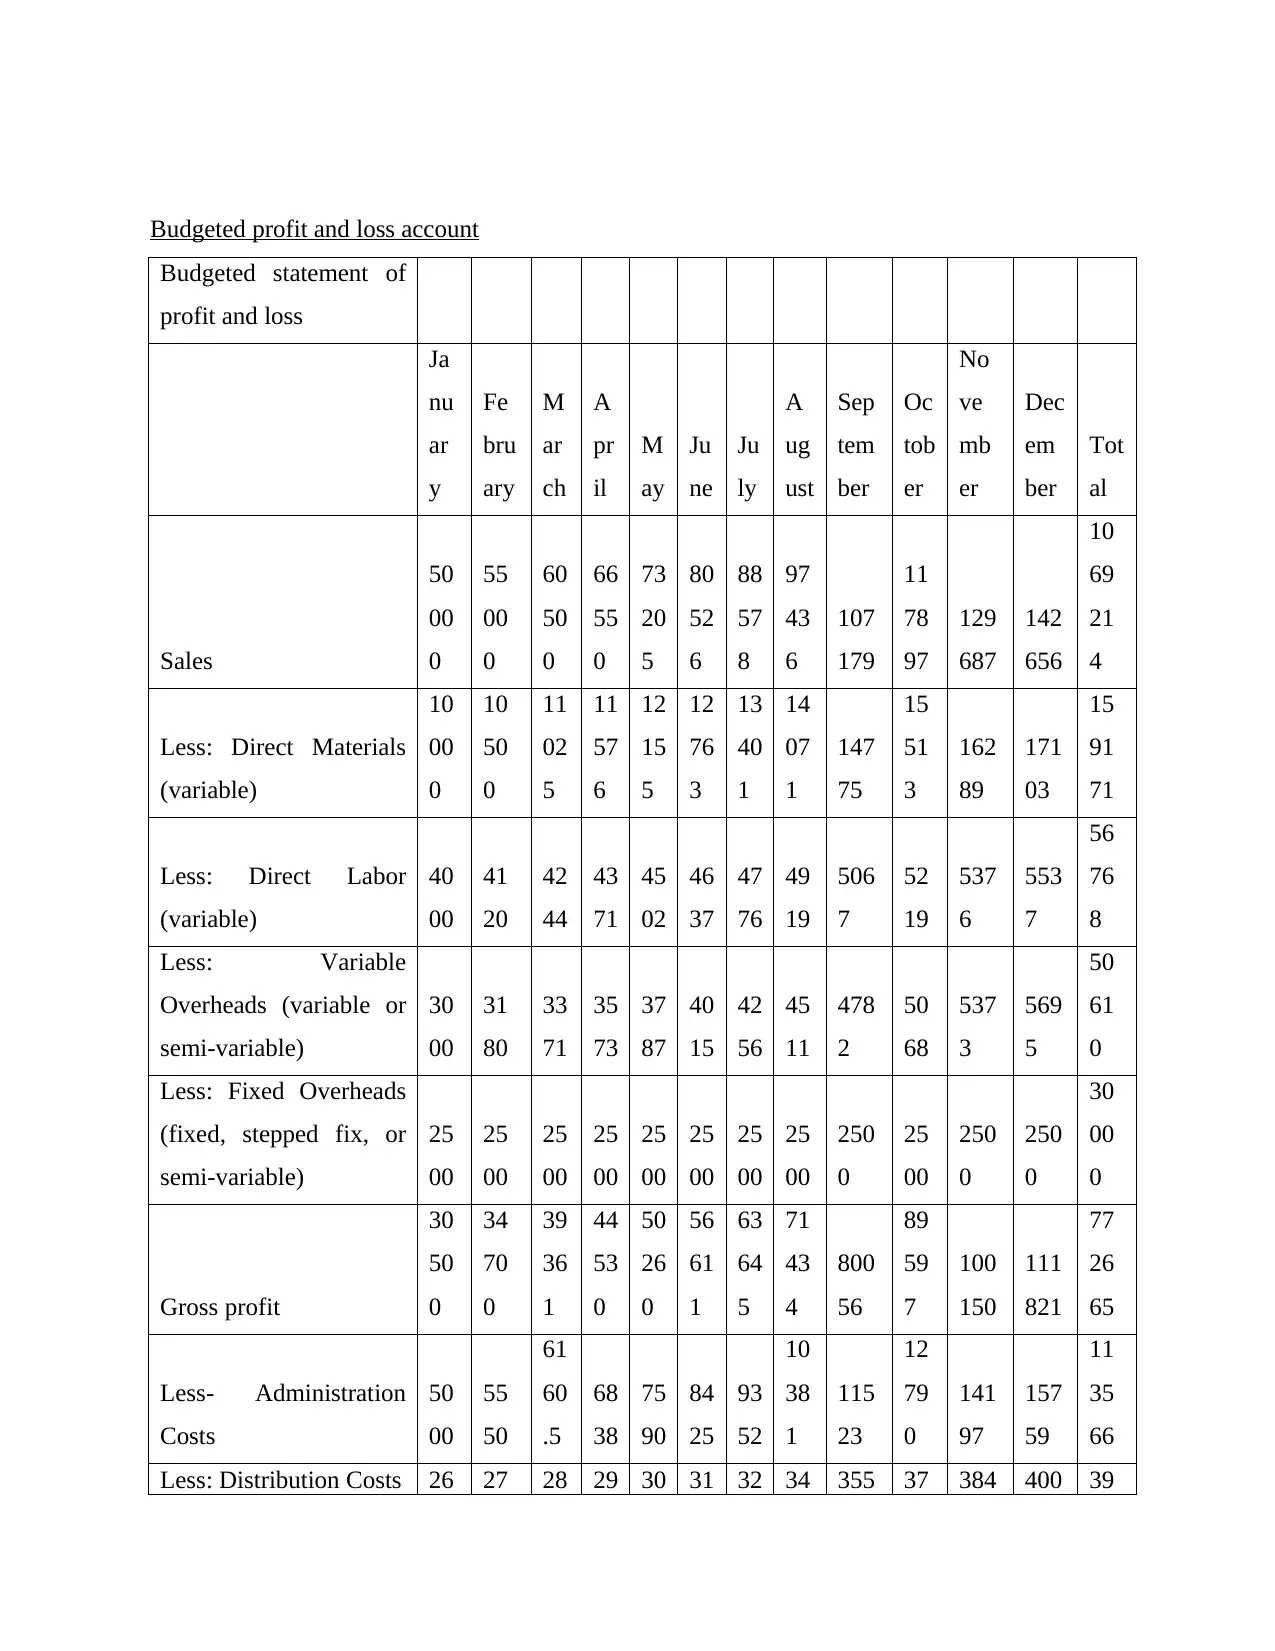
Budgeted statement of
profit and loss
Ja
nu
ar
y
Fe
bru
ary
M
ar
ch
A
pr
il
M
ay
Ju
ne
Ju
ly
A
ug
ust
Sep
tem
ber
Oc
tob
er
No
ve
mb
er
Dec
em
ber
Tot
al
Sales
50
00
0
55
00
0
60
50
0
66
55
0
73
20
5
80
52
6
88
57
8
97
43
6
107
179
11
78
97
129
687
142
656
10
69
21
4
Less: Direct Materials
(variable)
10
00
0
10
50
0
11
02
5
11
57
6
12
15
5
12
76
3
13
40
1
14
07
1
147
75
15
51
3
162
89
171
03
15
91
71
Less: Direct Labor
(variable)
40
00
41
20
42
44
43
71
45
02
46
37
47
76
49
19
506
7
52
19
537
6
553
7
56
76
8
Less: Variable
Overheads (variable or
semi-variable)
30
00
31
80
33
71
35
73
37
87
40
15
42
56
45
11
478
2
50
68
537
3
569
5
50
61
0
Less: Fixed Overheads
(fixed, stepped fix, or
semi-variable)
25
00
25
00
25
00
25
00
25
00
25
00
25
00
25
00
250
0
25
00
250
0
250
0
30
00
0
Gross profit
30
50
0
34
70
0
39
36
1
44
53
0
50
26
0
56
61
1
63
64
5
71
43
4
800
56
89
59
7
100
150
111
821
77
26
65
Less- Administration
Costs
50
00
55
50
61
60
.5
68
38
75
90
84
25
93
52
10
38
1
115
23
12
79
0
141
97
157
59
11
35
66
Less: Distribution Costs 26 27 28 29 30 31 32 34 355 37 384 400 39
Paraphrase This Document
06
7
Less: Selling Costs
10
00
11
00
12
10
13
31
14
64
16
11
17
72
19
49
214
4
23
58
259
4
285
3
21
38
4
Operating Profit
21
90
0
25
34
6
29
17
8
33
43
6
38
16
4
43
41
2
49
23
2
55
68
4
628
32
70
74
8
795
10
892
06
59
86
48
Less: Finance Costs
40
00
40
40
40
80
41
21
41
62
42
04
42
46
42
89
433
1
43
75
441
8
446
3
50
73
0
Profit Before Tax
17
90
0
21
30
6
25
09
8
29
31
5
34
00
2
39
20
8
44
98
6
51
39
5
585
00
66
37
3
750
92
847
43
54
79
18
Less: Tax (10%)
17
90
21
31
25
10
29
31
34
00
39
21
44
99
51
39
585
0
66
37
750
9
847
4
54
79
2
Profit After Tax
16
11
0
19
17
5
22
58
8
26
38
3
30
60
2
35
28
7
40
48
7
46
25
5
526
50
59
73
6
675
83
762
69
49
31
26
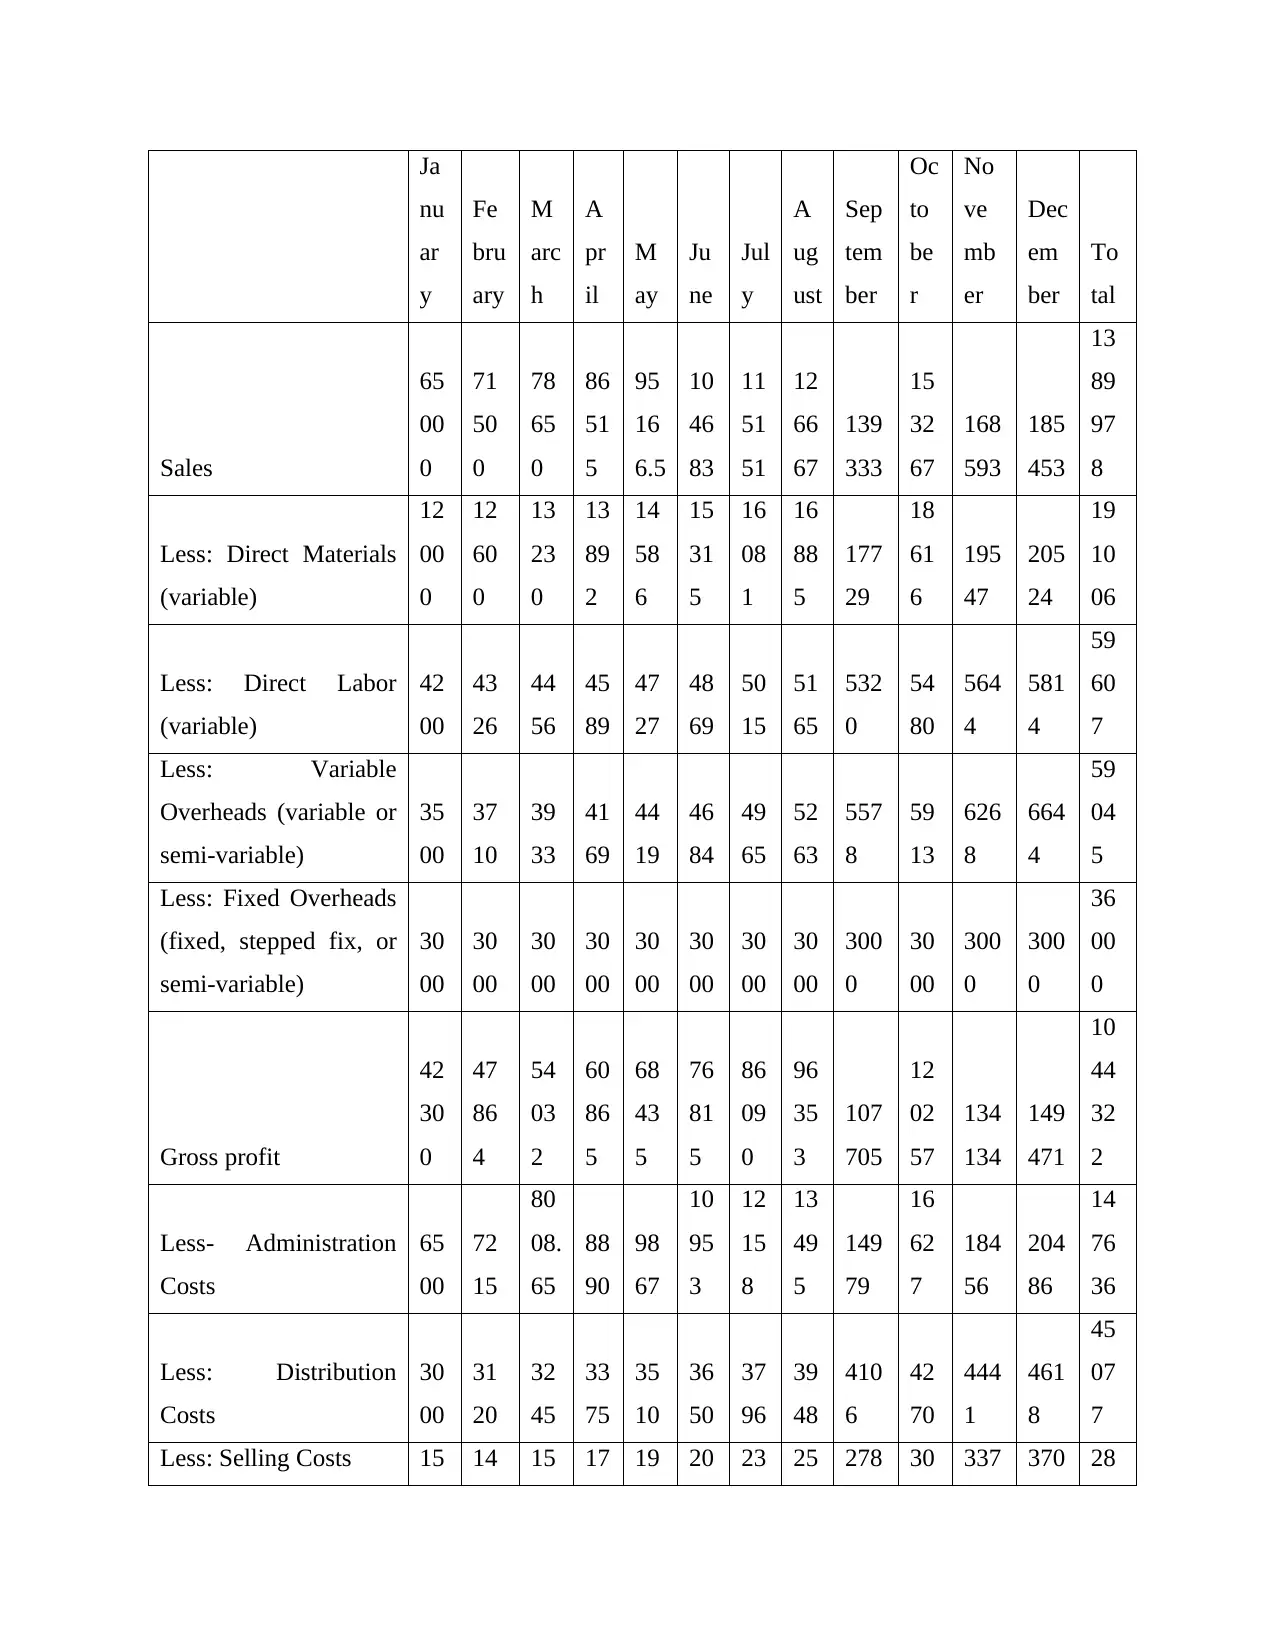
Actual profit and loss account
Actual statement of
profit and loss
nu
ar
y
Fe
bru
ary
M
arc
h
A
pr
il
M
ay
Ju
ne
Jul
y
A
ug
ust
Sep
tem
ber
Oc
to
be
r
No
ve
mb
er
Dec
em
ber
To
tal
Sales
65
00
0
71
50
0
78
65
0
86
51
5
95
16
6.5
10
46
83
11
51
51
12
66
67
139
333
15
32
67
168
593
185
453
13
89
97
8
Less: Direct Materials
(variable)
12
00
0
12
60
0
13
23
0
13
89
2
14
58
6
15
31
5
16
08
1
16
88
5
177
29
18
61
6
195
47
205
24
19
10
06
Less: Direct Labor
(variable)
42
00
43
26
44
56
45
89
47
27
48
69
50
15
51
65
532
0
54
80
564
4
581
4
59
60
7
Less: Variable
Overheads (variable or
semi-variable)
35
00
37
10
39
33
41
69
44
19
46
84
49
65
52
63
557
8
59
13
626
8
664
4
59
04
5
Less: Fixed Overheads
(fixed, stepped fix, or
semi-variable)
30
00
30
00
30
00
30
00
30
00
30
00
30
00
30
00
300
0
30
00
300
0
300
0
36
00
0
Gross profit
42
30
0
47
86
4
54
03
2
60
86
5
68
43
5
76
81
5
86
09
0
96
35
3
107
705
12
02
57
134
134
149
471
10
44
32
2
Less- Administration
Costs
65
00
72
15
80
08.
65
88
90
98
67
10
95
3
12
15
8
13
49
5
149
79
16
62
7
184
56
204
86
14
76
36
Less: Distribution
Costs
30
00
31
20
32
45
33
75
35
10
36
50
37
96
39
48
410
6
42
70
444
1
461
8
45
07
7
Less: Selling Costs 15 14 15 17 19 20 23 25 278 30 337 370 28
⊘ This is a preview!⊘
Do you want full access?
Subscribe today to unlock all pages.
Trusted by 1+ million students worldwide
30
.3 03 94 03 33 7 65 2 9
00
0
Operating Profit
31
30
0
36
09
9
41
20
5
46
87
1
53
15
4
60
11
9
67
83
4
76
37
7
858
33
96
29
5
107
865
120
657
82
36
09
Less: Finance Costs
46
00
46
46
46
92
47
39
47
87
48
35
48
83
49
32
498
1
50
31
508
1
513
2
58
34
0
Profit Before Tax
26
70
0
31
45
3
36
51
3
42
13
2
48
36
7
55
28
4
62
95
1
71
44
5
808
52
91
26
4
102
784
115
525
76
52
69
Less: Tax (10%)
26
70
31
45
36
51
42
13
48
37
55
28
62
95
71
45
808
5
91
26
102
78
115
52
76
52
7
Profit After Tax
24
03
0
28
30
8
32
86
1
37
91
8
43
53
1
49
75
5
56
65
6
64
30
1
727
67
82
13
8
925
06
103
972
68
87
42
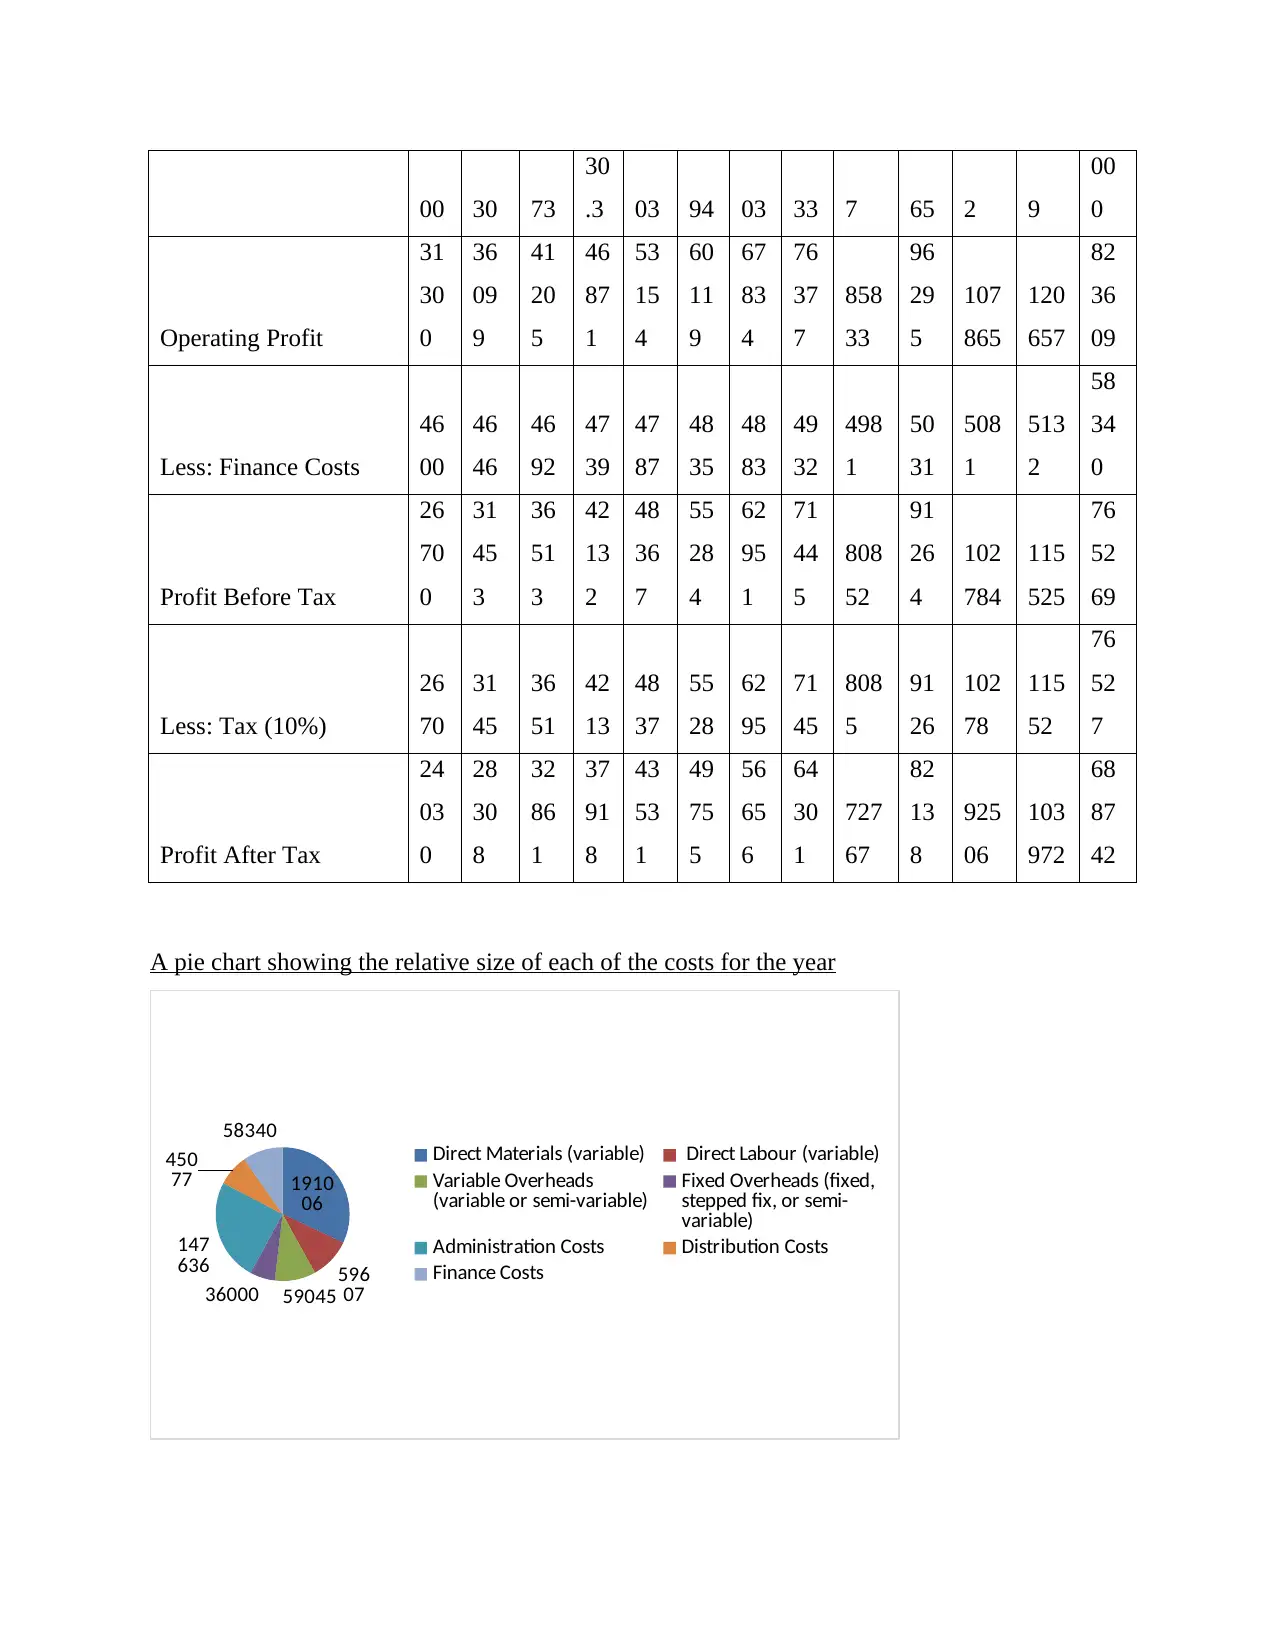
A pie chart showing the relative size of each of the costs for the year
1910
06
596
075904536000
147
636
450
77
58340
Direct Materials (variable) Direct Labour (variable)
Variable Overheads
(variable or semi-variable) Fixed Overheads (fixed,
stepped fix, or semi-
variable)
Administration Costs Distribution Costs
Finance Costs
Paraphrase This Document
higher cost is of direct material that is of 191006 pounds. While lower cost is of 36000 that are
fixed overheads. The pie chart contains information of actual cost that occurred in order to gain
net margin. Each cost volume varies from each other due to different nature and importance.
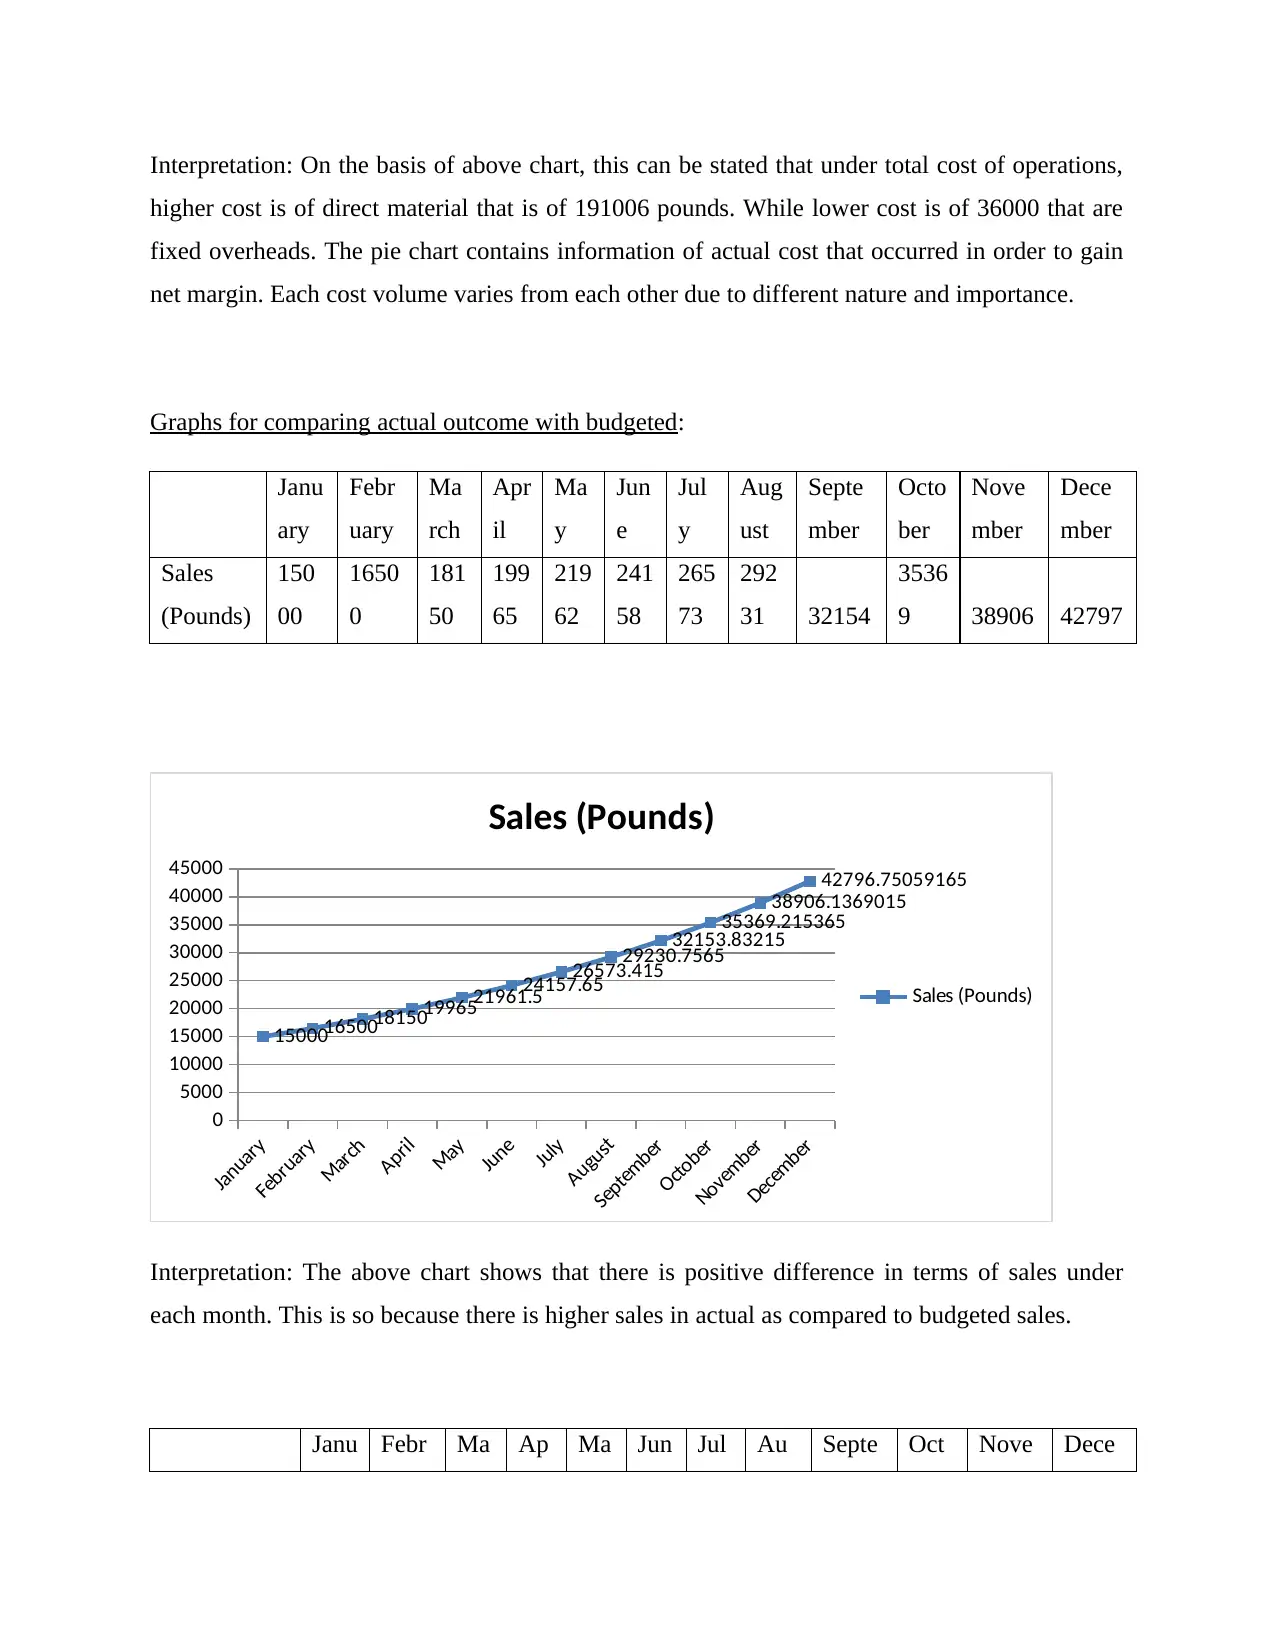
Graphs for comparing actual outcome with budgeted:
Janu
ary
Febr
uary
Ma
rch
Apr
il
Ma
y
Jun
e
Jul
y
Aug
ust
Septe
mber
Octo
ber
Nove
mber
Dece
mber
Sales
(Pounds)
150
00
1650
0
181
50
199
65
219
62
241
58
265
73
292
31 32154
3536
9 38906 42797
January
February
March
April
May
June
July
August
September
October
November
December
0
5000
10000
15000
20000
25000
30000
35000
40000
45000
15000165001815019965
21961.5
24157.65
26573.415
29230.7565
32153.83215
35369.215365
38906.1369015
42796.75059165
Sales (Pounds)
Sales (Pounds)
Interpretation: The above chart shows that there is positive difference in terms of sales under
each month. This is so because there is higher sales in actual as compared to budgeted sales.
Janu Febr Ma Ap Ma Jun Jul Au Septe Oct Nove Dece
Gross profit
(Pounds)
118
00
1316
4
146
71
16
33
6
18
17
4
20
20
4
22
44
5
249
19 27649
306
61 33984
3765
0
January
February
March
April
May
June
July
August
September
October
November
December
0
5000
10000
15000
20000
25000
30000
35000
40000
118001316414671.0216335.6966
18174.147258
20204.11927134
22445.15370331
62
24918.76575210
68
27648.64320887
89
30660.86481677
58
33984.14052380
49
37650.07582210
48
Gross profit (Pounds)
Gross profit (Pounds)
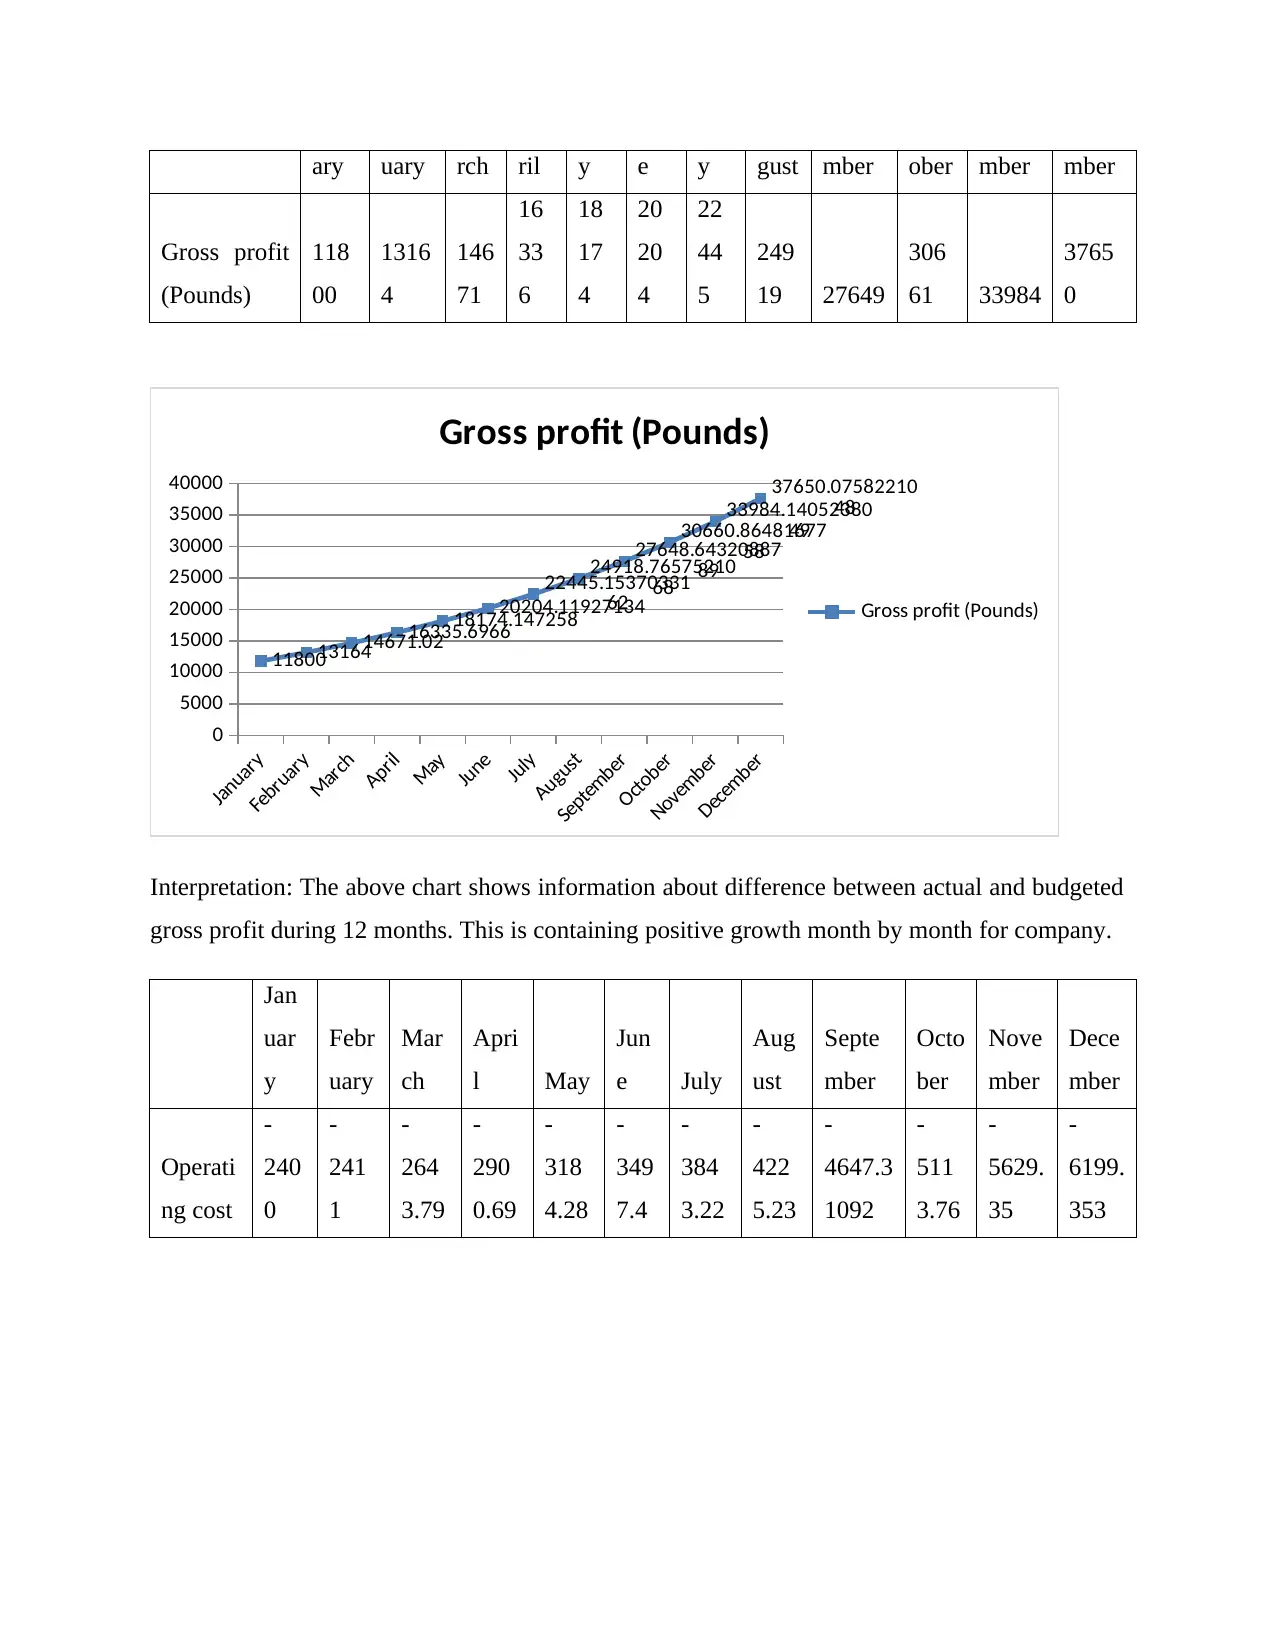
Interpretation: The above chart shows information about difference between actual and budgeted
gross profit during 12 months. This is containing positive growth month by month for company.
Jan
uar
y
Febr
uary
Mar
ch
Apri
l May
Jun
e July
Aug
ust
Septe
mber
Octo
ber
Nove
mber
Dece
mber
Operati
ng cost
-
240
0
-
241
1
-
264
3.79
-
290
0.69
-
318
4.28
-
349
7.4
-
384
3.22
-
422
5.23
-
4647.3
1092
-
511
3.76
-
5629.
35
-
6199.
353
⊘ This is a preview!⊘
Do you want full access?
Subscribe today to unlock all pages.
Trusted by 1+ million students worldwide
February
March
April
May
June
July
August
September
October
November
December
-7000
-6000
-5000
-4000
-3000
-2000
-1000
0
-2400 -2411 -2643.79
-2900.6921
-3184.279039
-3497.40139361
-3843.2177356399
-4225.2280710424
-
4647.31091773846-
5113.76441884835-
5629.35193110086
-
6199.35257616395
Operating cost
Operating cost
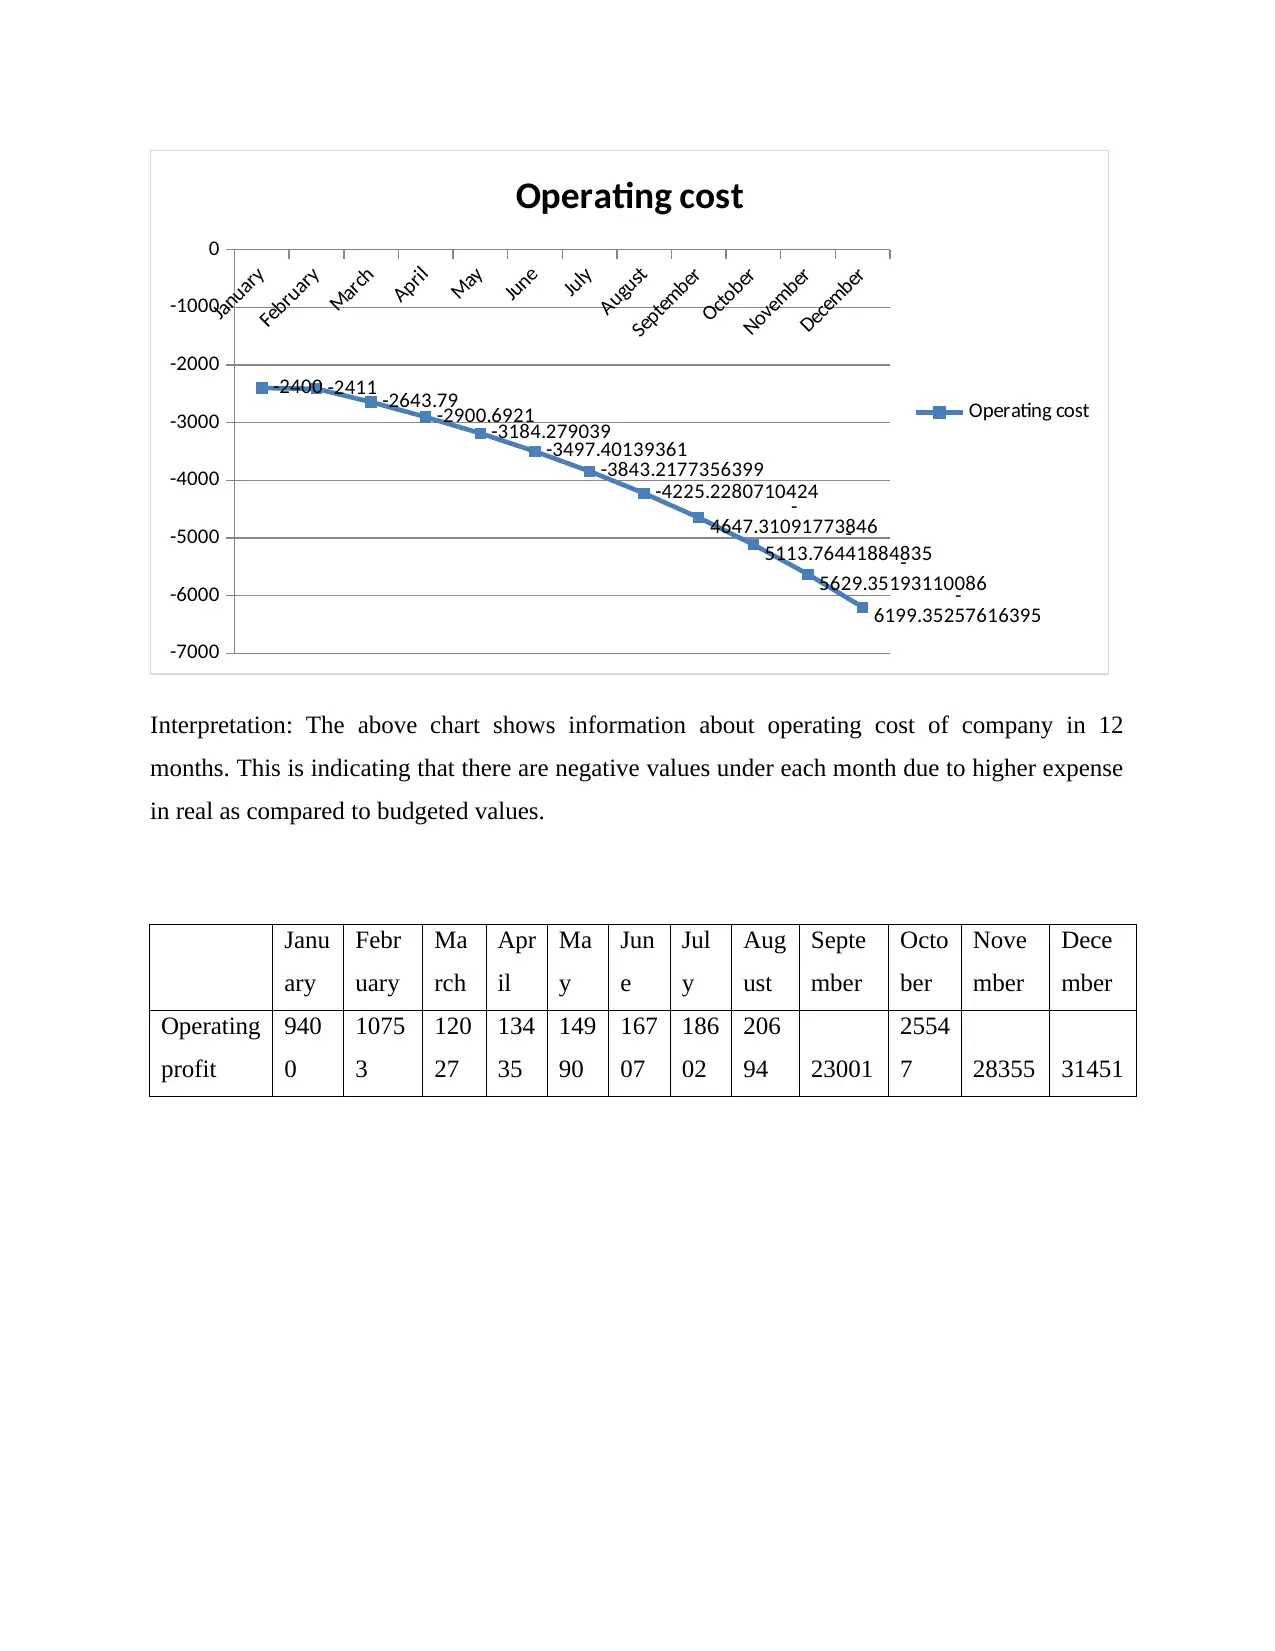
Interpretation: The above chart shows information about operating cost of company in 12
months. This is indicating that there are negative values under each month due to higher expense
in real as compared to budgeted values.
Janu
ary
Febr
uary
Ma
rch
Apr
il
Ma
y
Jun
e
Jul
y
Aug
ust
Septe
mber
Octo
ber
Nove
mber
Dece
mber
Operating
profit
940
0
1075
3
120
27
134
35
149
90
167
07
186
02
206
94 23001
2554
7 28355 31451
Paraphrase This Document
February
March
April
May
June
July
August
September
October
November
December
0
5000
10000
15000
20000
25000
30000
35000
9400 1075312027.2313435.0045
14989.868219
16706.71787773
18601.93596767
63
20693.53768106
44
23001.33229114
04
25547.10039792
74
28354.78859270
4
31450.72324594
08
Operating profit
Operating profit
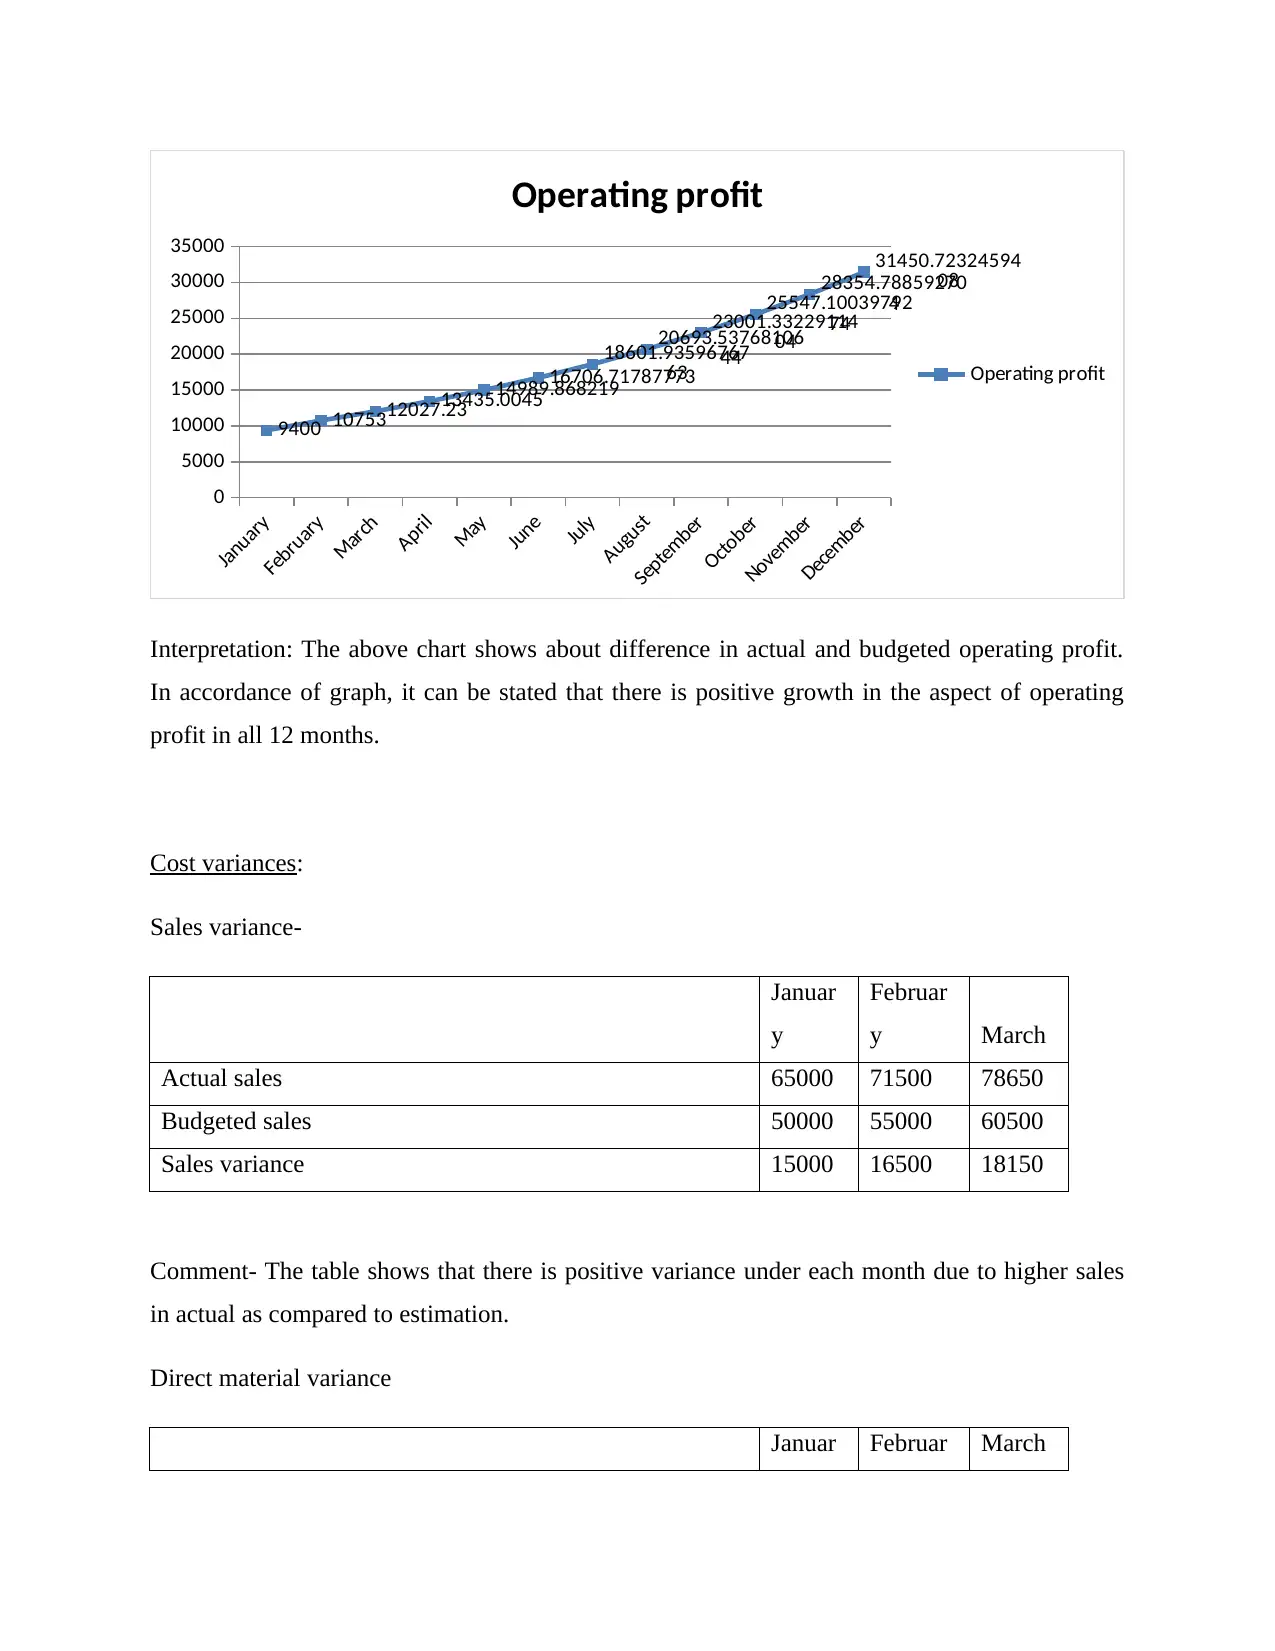
Interpretation: The above chart shows about difference in actual and budgeted operating profit.
In accordance of graph, it can be stated that there is positive growth in the aspect of operating
profit in all 12 months.
Cost variances:
Sales variance-
Januar
y
Februar
y March
Actual sales 65000 71500 78650
Budgeted sales 50000 55000 60500
Sales variance 15000 16500 18150
Comment- The table shows that there is positive variance under each month due to higher sales
in actual as compared to estimation.
Direct material variance
Januar Februar March
Actual direct material cost 12000 12600 13230
Budgeted direct material cost 10000 10500 11025
Direct material variance -2000 -2100 -2205
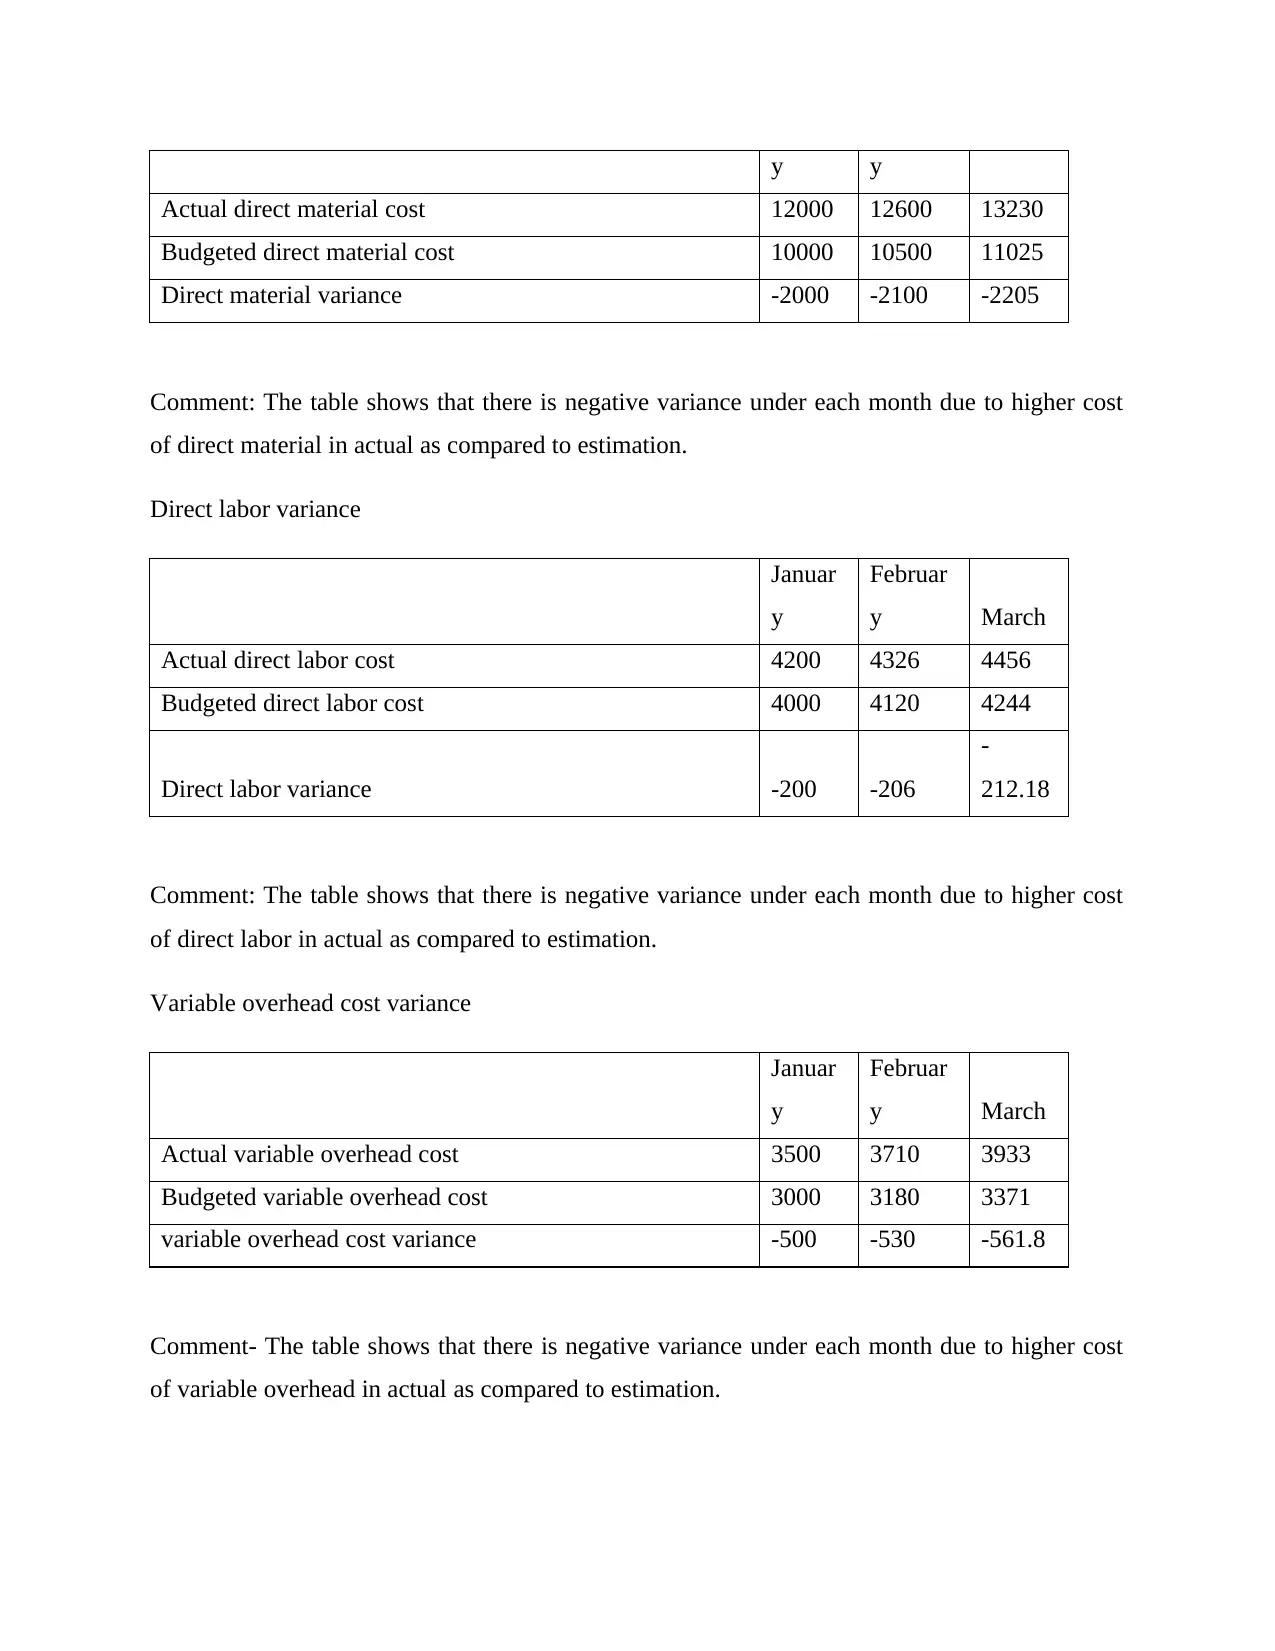
Comment: The table shows that there is negative variance under each month due to higher cost
of direct material in actual as compared to estimation.
Direct labor variance
Januar
y
Februar
y March
Actual direct labor cost 4200 4326 4456
Budgeted direct labor cost 4000 4120 4244
Direct labor variance -200 -206
-
212.18
Comment: The table shows that there is negative variance under each month due to higher cost
of direct labor in actual as compared to estimation.
Variable overhead cost variance
Januar
y
Februar
y March
Actual variable overhead cost 3500 3710 3933
Budgeted variable overhead cost 3000 3180 3371
variable overhead cost variance -500 -530 -561.8
Comment- The table shows that there is negative variance under each month due to higher cost
of variable overhead in actual as compared to estimation.
⊘ This is a preview!⊘
Do you want full access?
Subscribe today to unlock all pages.
Trusted by 1+ million students worldwide
Januar
y
Februar
y March
Actual fixed overhead 3000 3000 3000
Budgeted fixed overhead 2500 2500 2500
fixed overhead variance -500 -500 -500
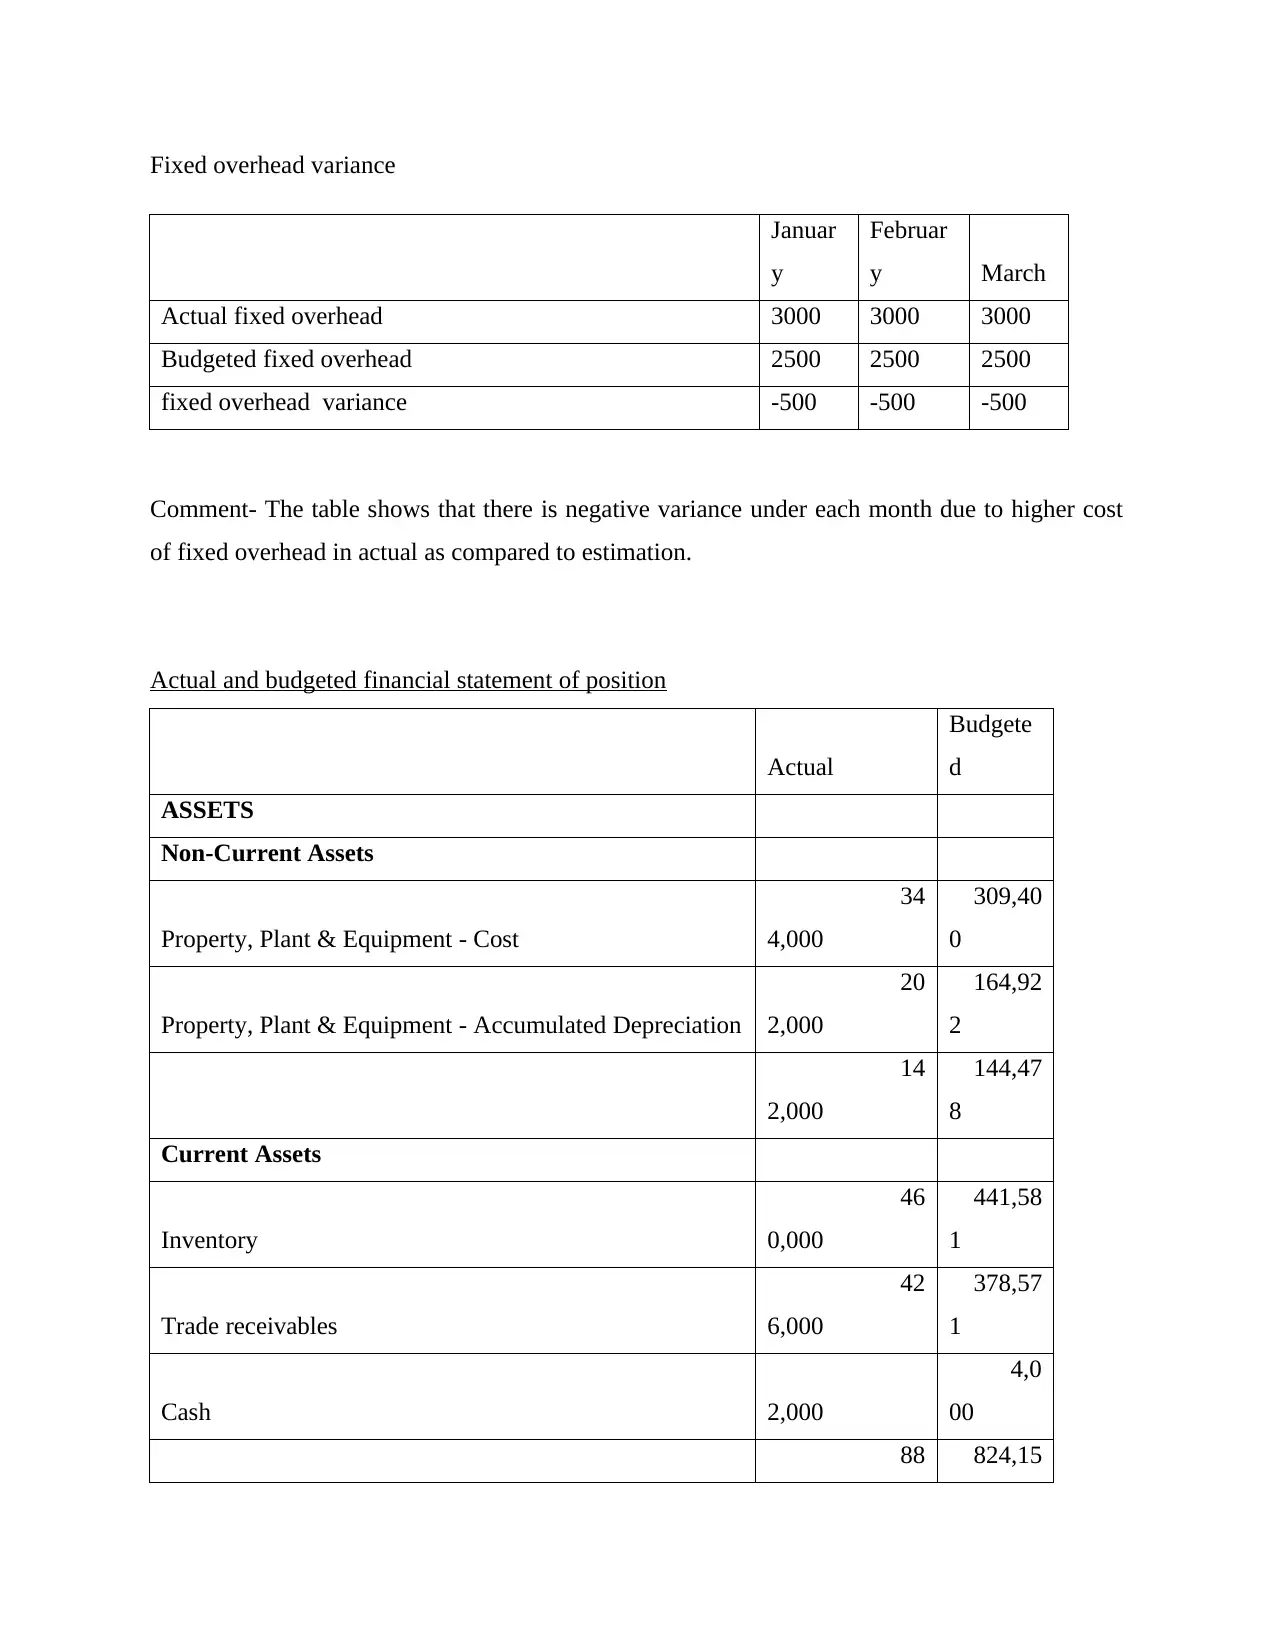
Comment- The table shows that there is negative variance under each month due to higher cost
of fixed overhead in actual as compared to estimation.
Actual and budgeted financial statement of position
Actual
Budgete
d
ASSETS
Non-Current Assets
Property, Plant & Equipment - Cost
34
4,000
309,40
0
Property, Plant & Equipment - Accumulated Depreciation
20
2,000
164,92
2
14
2,000
144,47
8
Current Assets
Inventory
46
0,000
441,58
1
Trade receivables
42
6,000
378,57
1
Cash 2,000
4,0
00
88 824,15
Paraphrase This Document
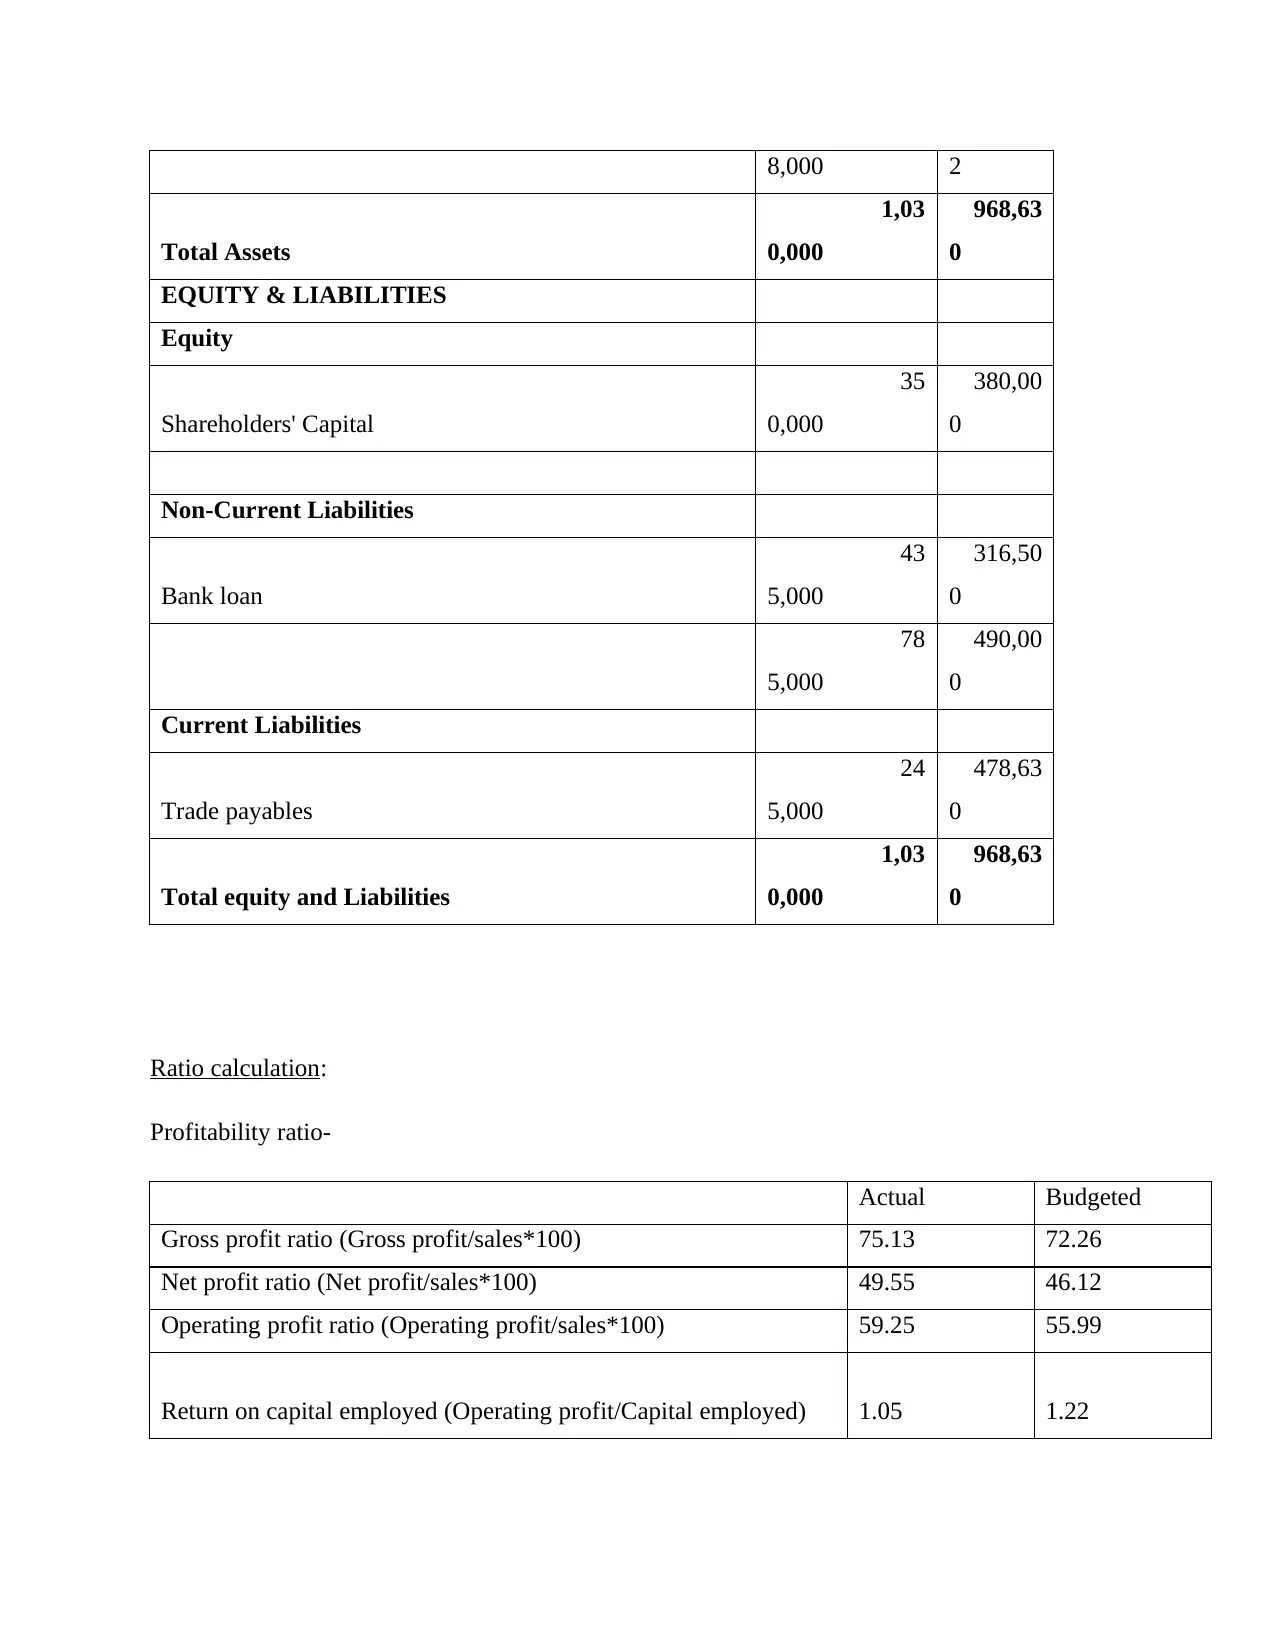
Total Assets
1,03
0,000
968,63
0
EQUITY & LIABILITIES
Equity
Shareholders' Capital
35
0,000
380,00
0
Non-Current Liabilities
Bank loan
43
5,000
316,50
0
78
5,000
490,00
0
Current Liabilities
Trade payables
24
5,000
478,63
0
Total equity and Liabilities
1,03
0,000
968,63
0
Ratio calculation:
Profitability ratio-
Actual Budgeted
Gross profit ratio (Gross profit/sales*100) 75.13 72.26
Net profit ratio (Net profit/sales*100) 49.55 46.12
Operating profit ratio (Operating profit/sales*100) 59.25 55.99
Return on capital employed (Operating profit/Capital employed) 1.05 1.22
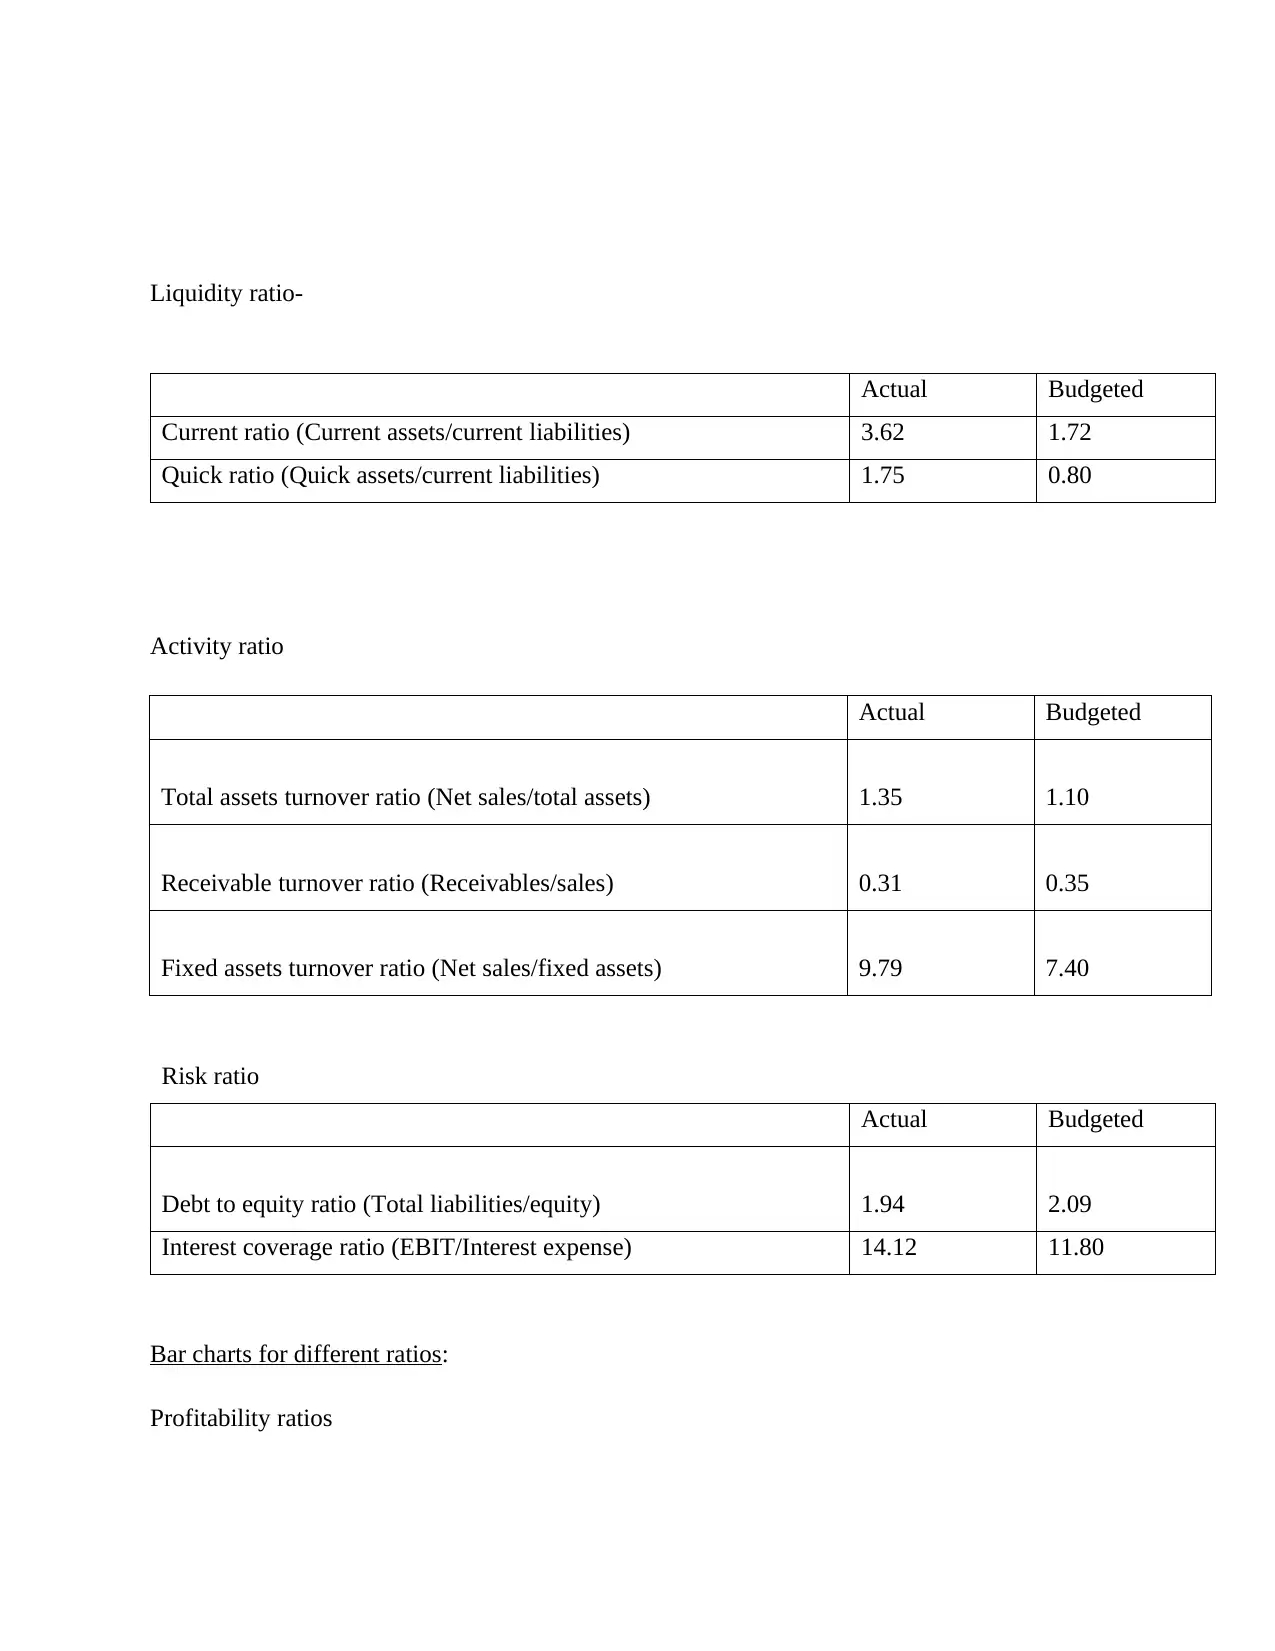
Actual Budgeted
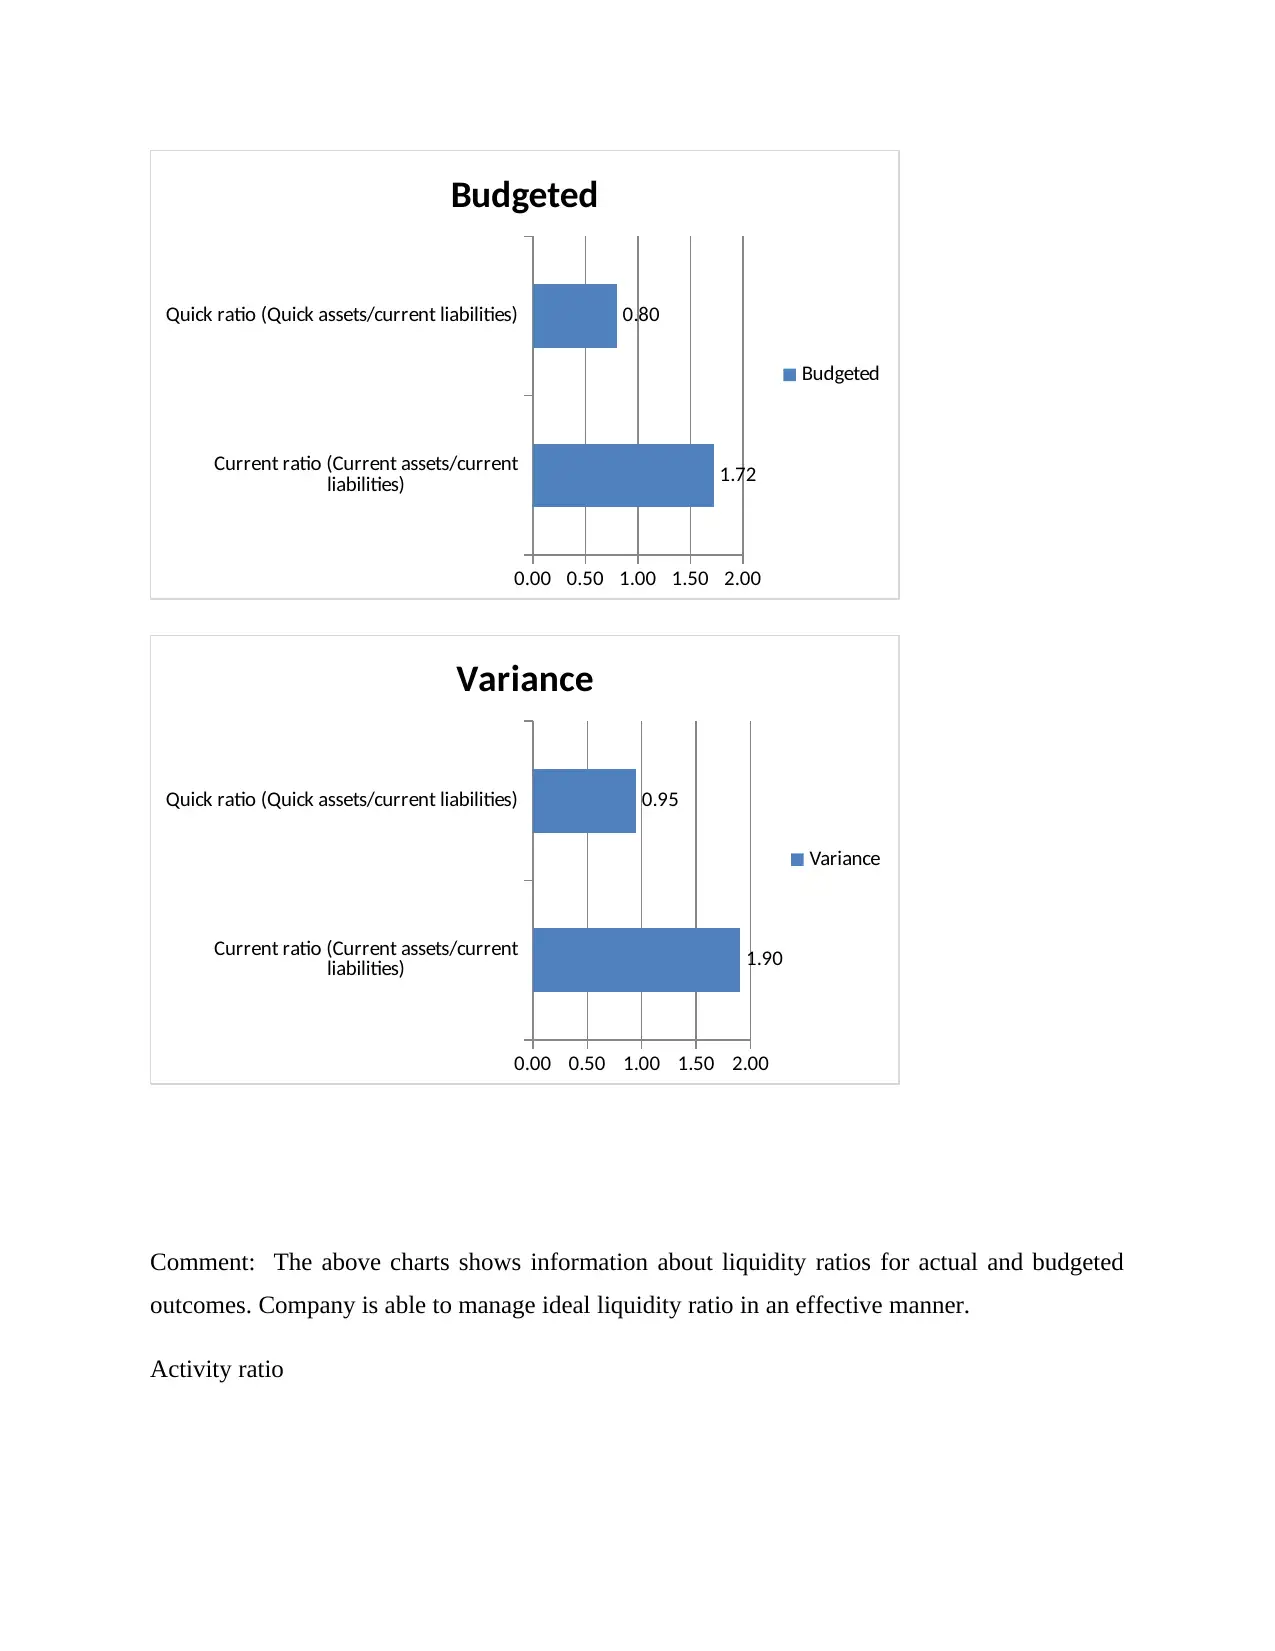
Current ratio (Current assets/current liabilities) 3.62 1.72
Quick ratio (Quick assets/current liabilities) 1.75 0.80
Activity ratio
Actual Budgeted
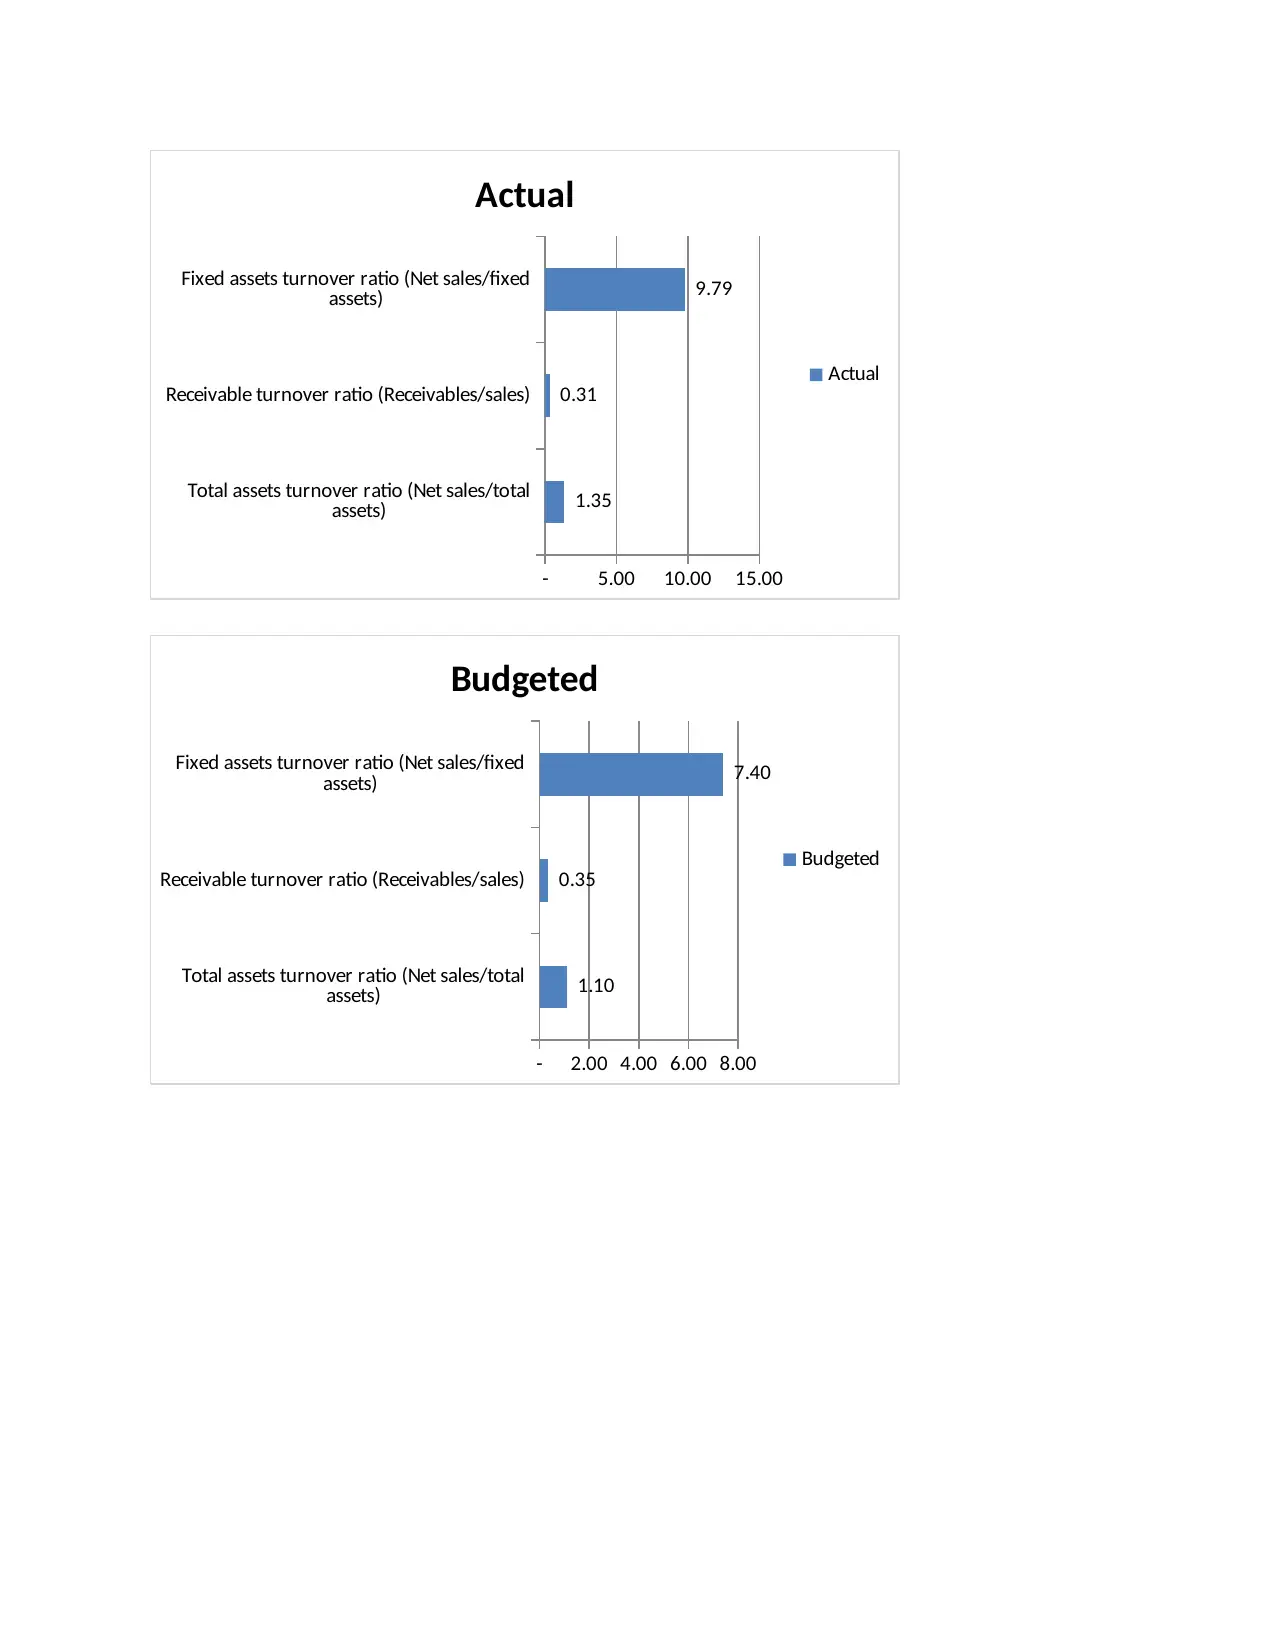
Total assets turnover ratio (Net sales/total assets) 1.35 1.10
Receivable turnover ratio (Receivables/sales) 0.31 0.35
Fixed assets turnover ratio (Net sales/fixed assets) 9.79 7.40
Risk ratio
Actual Budgeted
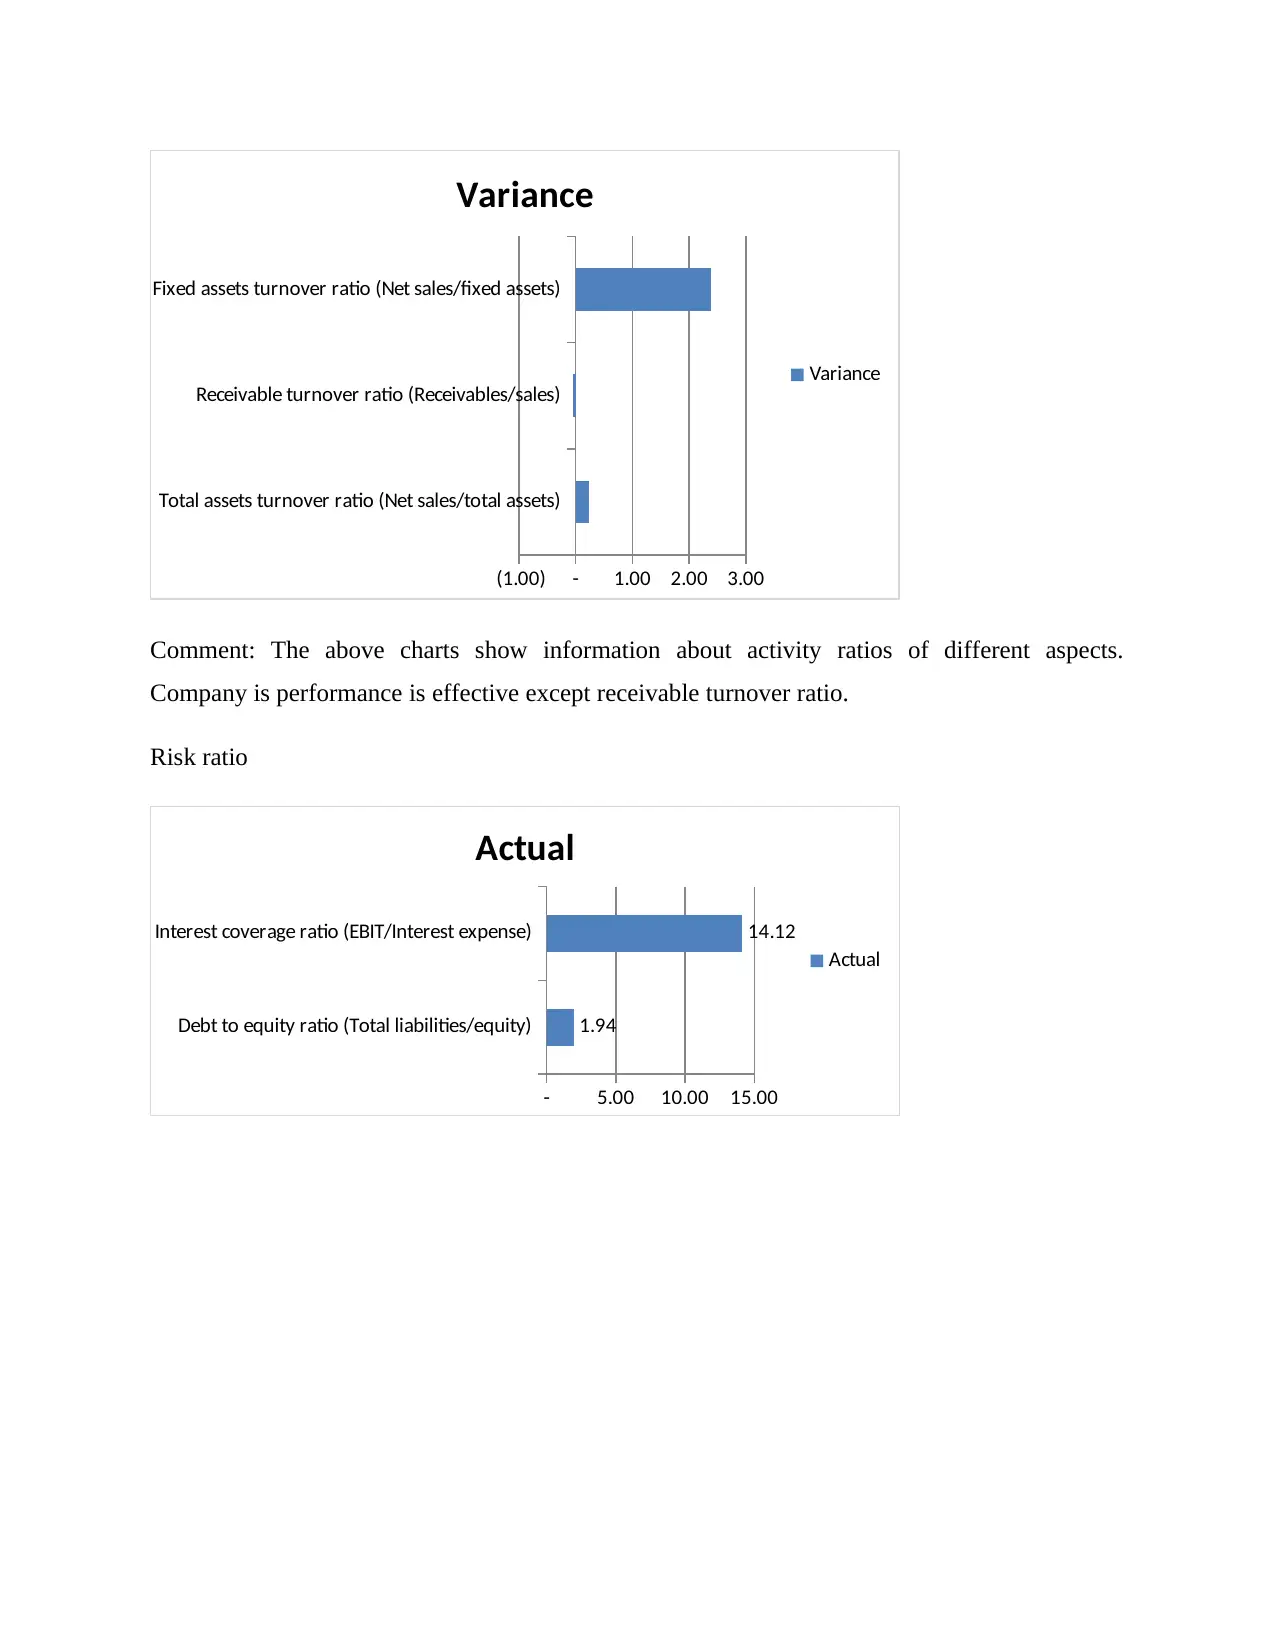
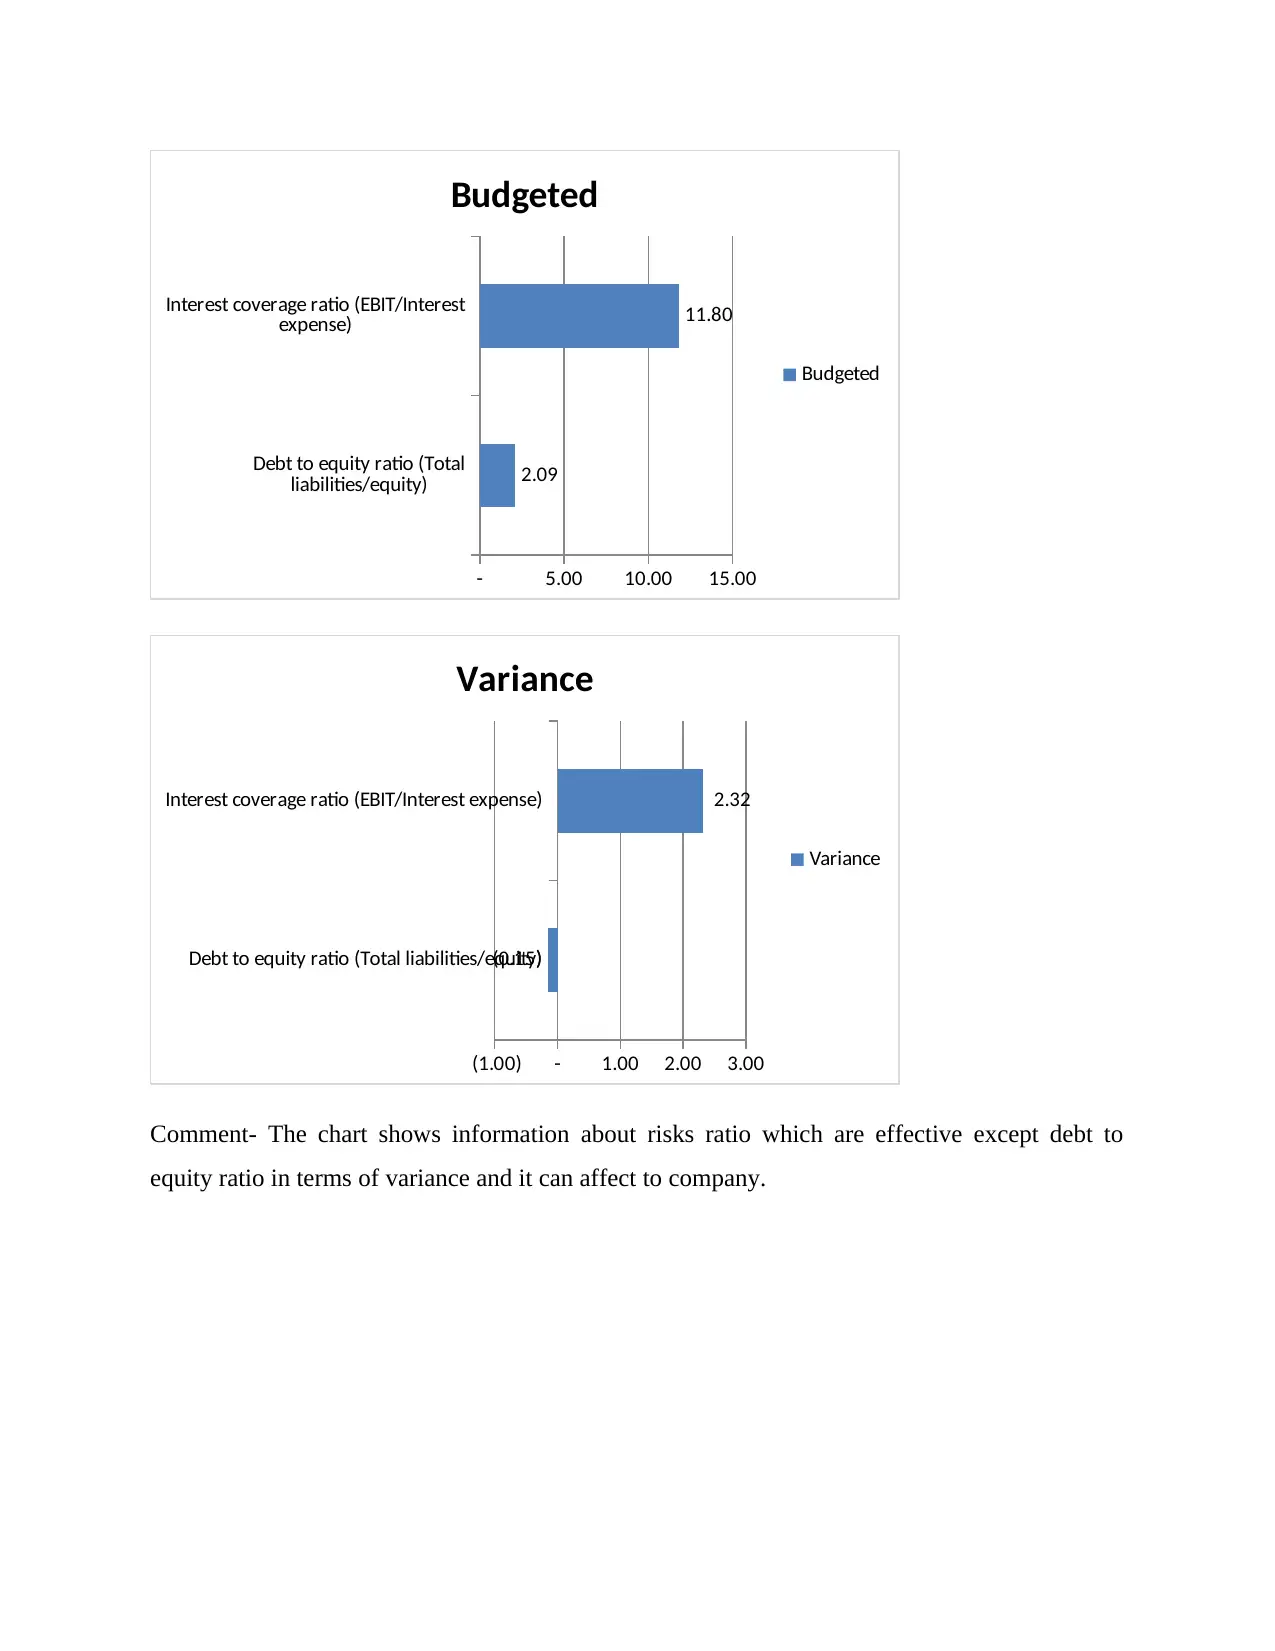
Debt to equity ratio (Total liabilities/equity) 1.94 2.09
Interest coverage ratio (EBIT/Interest expense) 14.12 11.80
Bar charts for different ratios:
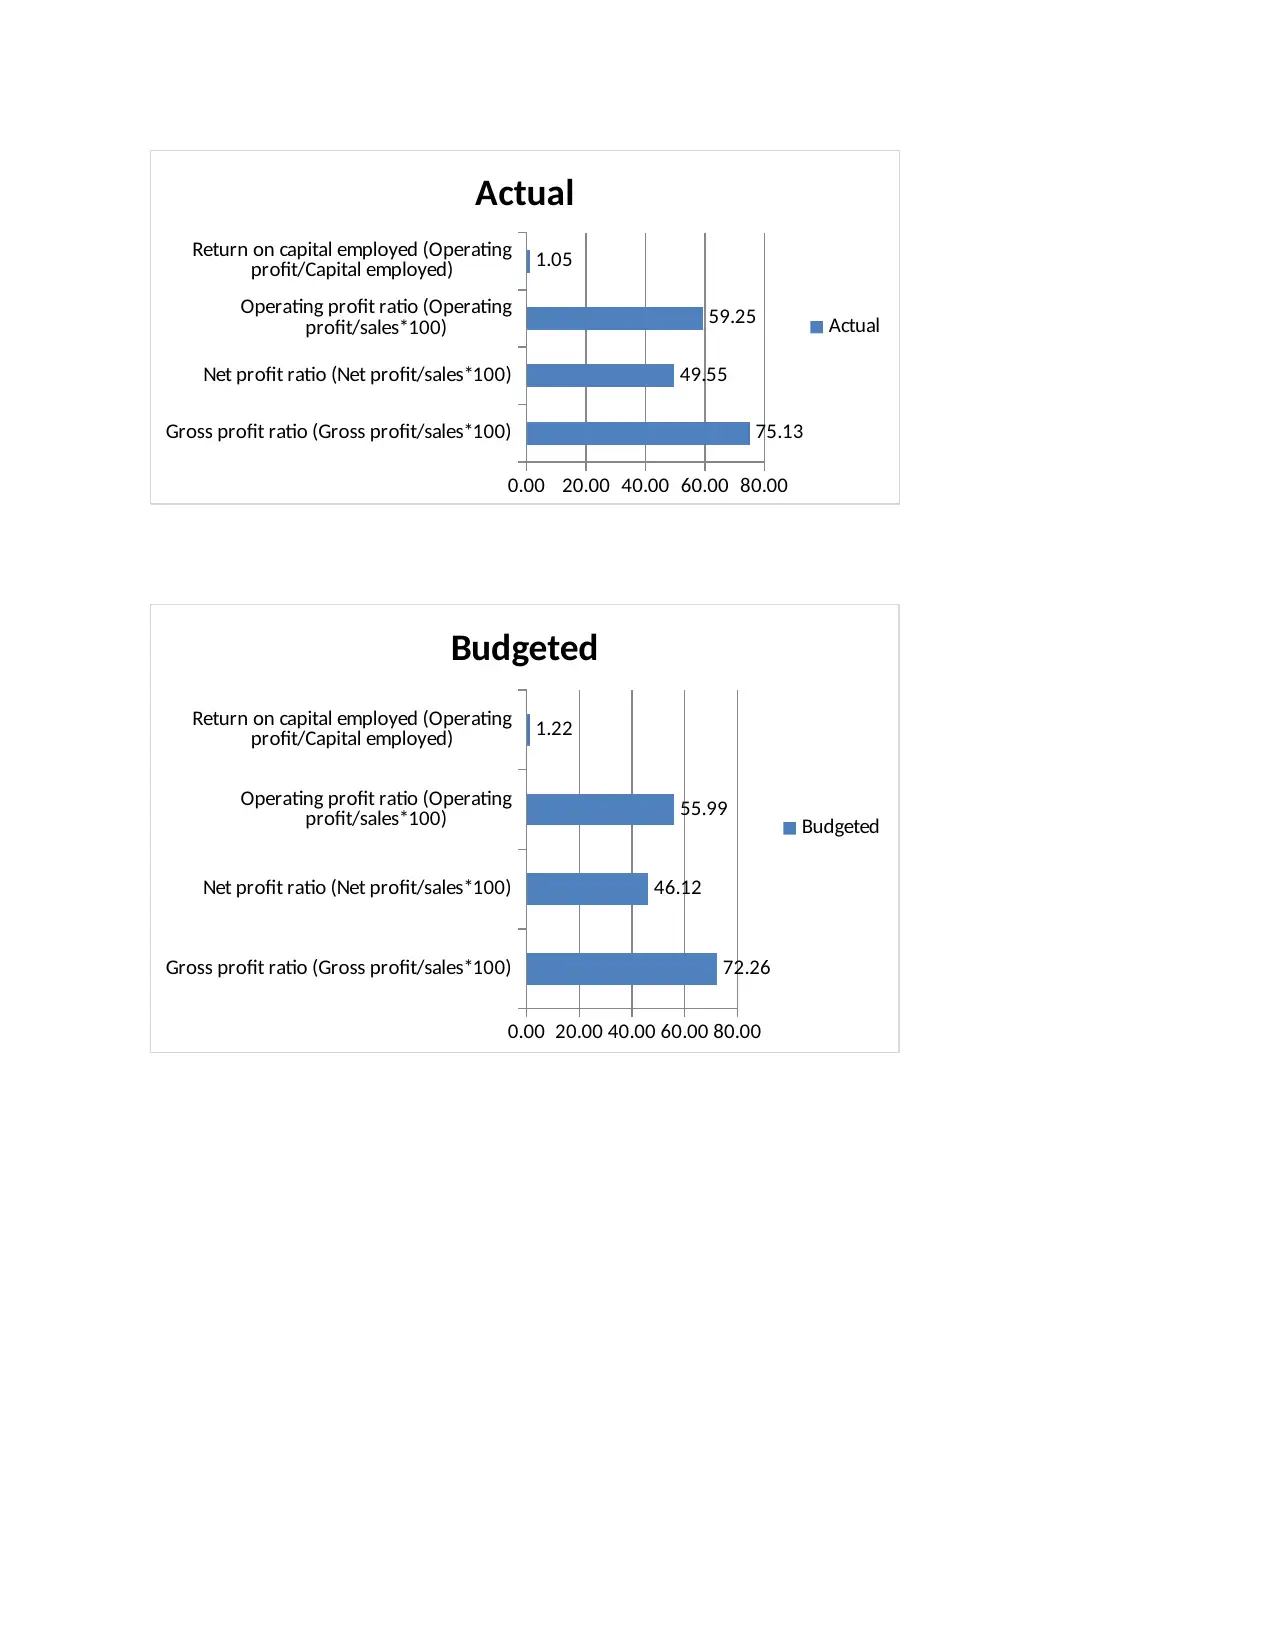
Profitability ratios
⊘ This is a preview!⊘
Do you want full access?
Subscribe today to unlock all pages.
Trusted by 1+ million students worldwide
Net profit ratio (Net profit/sales*100)
Operating profit ratio (Operating
profit/sales*100)
Return on capital employed (Operating
profit/Capital employed)
0.00 20.00 40.00 60.00 80.00
75.13
49.55
59.25
1.05
Actual
Actual
Gross profit ratio (Gross profit/sales*100)
Net profit ratio (Net profit/sales*100)
Operating profit ratio (Operating
profit/sales*100)
Return on capital employed (Operating
profit/Capital employed)
0.00 20.00 40.00 60.00 80.00
72.26
46.12
55.99
1.22
Budgeted
Budgeted
Paraphrase This Document
Net profit ratio (Net profit/sales*100)
Operating profit ratio (Operating profit/sales*100)
Return on capital employed (Operating profit/Capital
employed)
-2.00 0.00 2.00 4.00
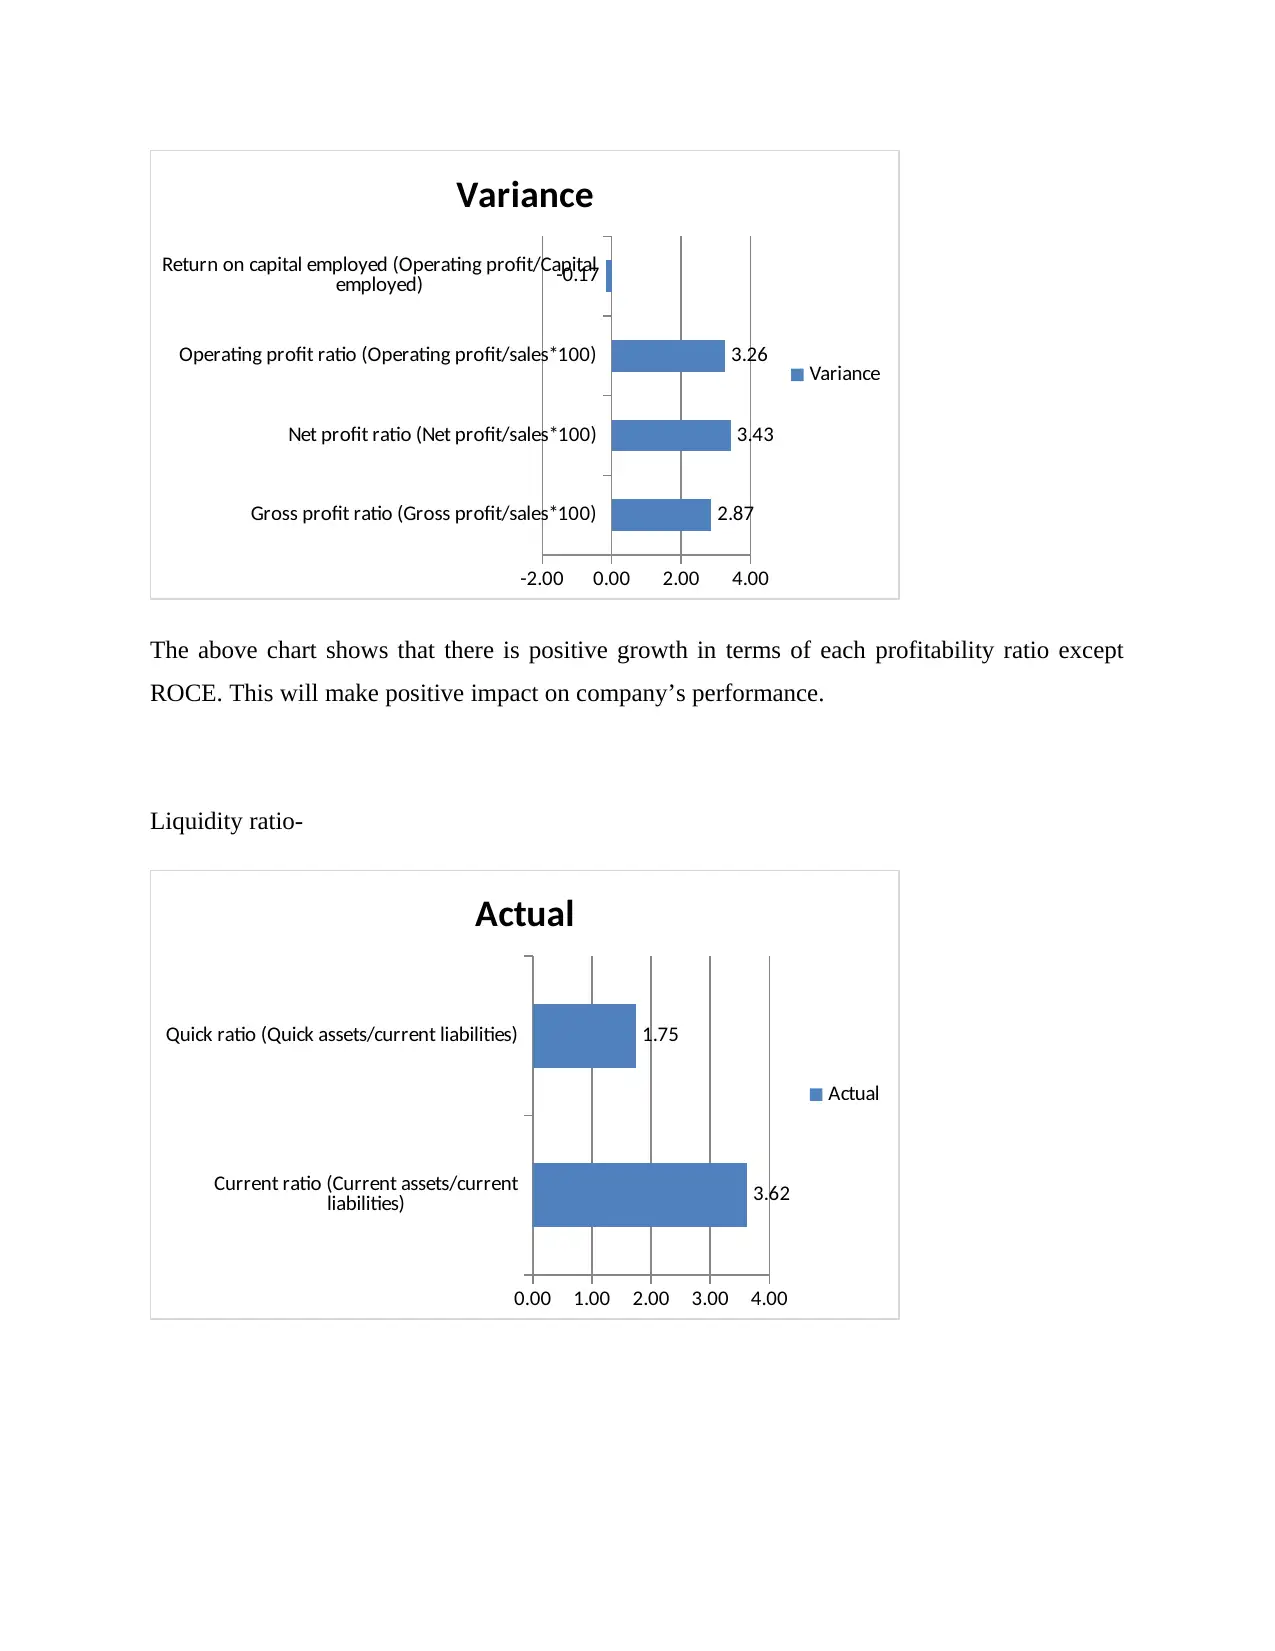
2.87
3.43
3.26
-0.17
Variance
Variance
The above chart shows that there is positive growth in terms of each profitability ratio except
ROCE. This will make positive impact on company’s performance.
Liquidity ratio-
Current ratio (Current assets/current
liabilities)
Quick ratio (Quick assets/current liabilities)
0.00 1.00 2.00 3.00 4.00
3.62
1.75
Actual
Actual
liabilities)
Quick ratio (Quick assets/current liabilities)
0.00 0.50 1.00 1.50 2.00
1.72
0.80
Budgeted
Budgeted
Current ratio (Current assets/current
liabilities)
Quick ratio (Quick assets/current liabilities)
0.00 0.50 1.00 1.50 2.00
1.90
0.95
Variance
Variance
Comment: The above charts shows information about liquidity ratios for actual and budgeted
outcomes. Company is able to manage ideal liquidity ratio in an effective manner.
Activity ratio
⊘ This is a preview!⊘
Do you want full access?
Subscribe today to unlock all pages.
Trusted by 1+ million students worldwide
assets)
Receivable turnover ratio (Receivables/sales)
Fixed assets turnover ratio (Net sales/fixed
assets)
- 5.00 10.00 15.00
1.35
0.31
9.79
Actual
Actual
Total assets turnover ratio (Net sales/total
assets)
Receivable turnover ratio (Receivables/sales)
Fixed assets turnover ratio (Net sales/fixed
assets)
- 2.00 4.00 6.00 8.00
1.10
0.35
7.40
Budgeted
Budgeted
Paraphrase This Document
Receivable turnover ratio (Receivables/sales)
Fixed assets turnover ratio (Net sales/fixed assets)
(1.00) - 1.00 2.00 3.00
Variance
Variance
Comment: The above charts show information about activity ratios of different aspects.
Company is performance is effective except receivable turnover ratio.
Risk ratio
Debt to equity ratio (Total liabilities/equity)
Interest coverage ratio (EBIT/Interest expense)
- 5.00 10.00 15.00
1.94
14.12
Actual
Actual
liabilities/equity)
Interest coverage ratio (EBIT/Interest
expense)
- 5.00 10.00 15.00
2.09
11.80
Budgeted
Budgeted
Debt to equity ratio (Total liabilities/equity)
Interest coverage ratio (EBIT/Interest expense)
(1.00) - 1.00 2.00 3.00
(0.15)
2.32
Variance
Variance
Comment- The chart shows information about risks ratio which are effective except debt to
equity ratio in terms of variance and it can affect to company.
⊘ This is a preview!⊘
Do you want full access?
Subscribe today to unlock all pages.
Trusted by 1+ million students worldwide
Related Documents


Your All-in-One AI-Powered Toolkit for Academic Success.
+13062052269
info@desklib.com
Available 24*7 on WhatsApp / Email
![[object Object]](/_next/static/media/star-bottom.7253800d.svg)
© 2024 | Zucol Services PVT LTD | All rights reserved.