Business Report and Ministerial Brief: ECON 1030, Semester 2, Analysis
VerifiedAdded on 2022/11/28
|12
|2319
|91
Report
AI Summary
This business report, prepared for ECON 1030, analyzes the investment potential of Bitcoin using statistical methods and financial data from the Australian market. The report examines the closing price trends, rates of return, and summary statistics of Bitcoin and compares them to other securities including NAB, Woodside, and West Farmers. The analysis includes the calculation of empirical probabilities, confidence intervals, and t-tests to evaluate the viability of Bitcoin as an investment. The findings suggest that Bitcoin has a positive rate of return, making it a potentially viable investment option compared to the other securities. The report also includes a ministerial brief summarizing the key findings and recommendations for investment strategies. The analysis covers the period from 2014 and includes a detailed statistical analysis of the data.
Running head: ECON 1030 BUSINESS REPORT 1
Business Report and Brief
Student’s Name
Institutional Affiliation
Business Report and Brief
Student’s Name
Institutional Affiliation
Paraphrase This Document
Need a fresh take? Get an instant paraphrase of this document with our AI Paraphraser
BUSINESS REPORT AND BRIEF 2
Business Report and Brief
Executive Summary
Bitcoin is a type of payment network using block technology. Statistical analysis was
employed in this study to give a scientific recommendation on whether to invest in Bitcoin. This
was done through using recent prices and past data to advise investors on whether there is
sufficient confidence to invest in this technology. In this study, four securities in the Australian
market were picked and their trend and rate of returns evaluated for conclusions to be made.
Bitcoin was found to have a positive rate of return of between 0.05% and 3.12% which was the
highest hence can be recommended for investment.
Introduction
Cryptocurrencies are an application of the recent blockchain technology which is become
popular in most parts of the word. It uses the encryption technique to ensure security is
guaranteed in regulating of the financial transactions. An example of cryptocurrency
technologies is Bitcoin. This a kind of payment network that utilizes technology to control
tractions without any bank intervention. Over the recent few years, its growth has been catalyzed
by a stable market, adoption and favoring policies. Considering the many uncertainties that
encompass cryptocurrency, there is a need to investigate its viability and predict its future. Using
past data analysis was done to allow giving viable advice to investors on whether to invest in
Bitcoin.
Question 1
3/9/2014
5/25/2014
8/10/2014
10/26/2014
1/11/2015
3/29/2015
6/14/2015
8/30/2015
11/15/2015
1/31/2016
4/17/2016
7/3/2016
9/18/2016
12/4/2016
2/19/2017
5/7/2017
7/23/2017
10/8/2017
12/24/2017
3/11/2018
5/27/2018
8/12/2018
10/28/2018
1/13/2019
$-
$5,000.00
$10,000.00
$15,000.00
$20,000.00
$25,000.00
$30,000.00
Weekly Closing Prices of BIT
Date
Closing Price
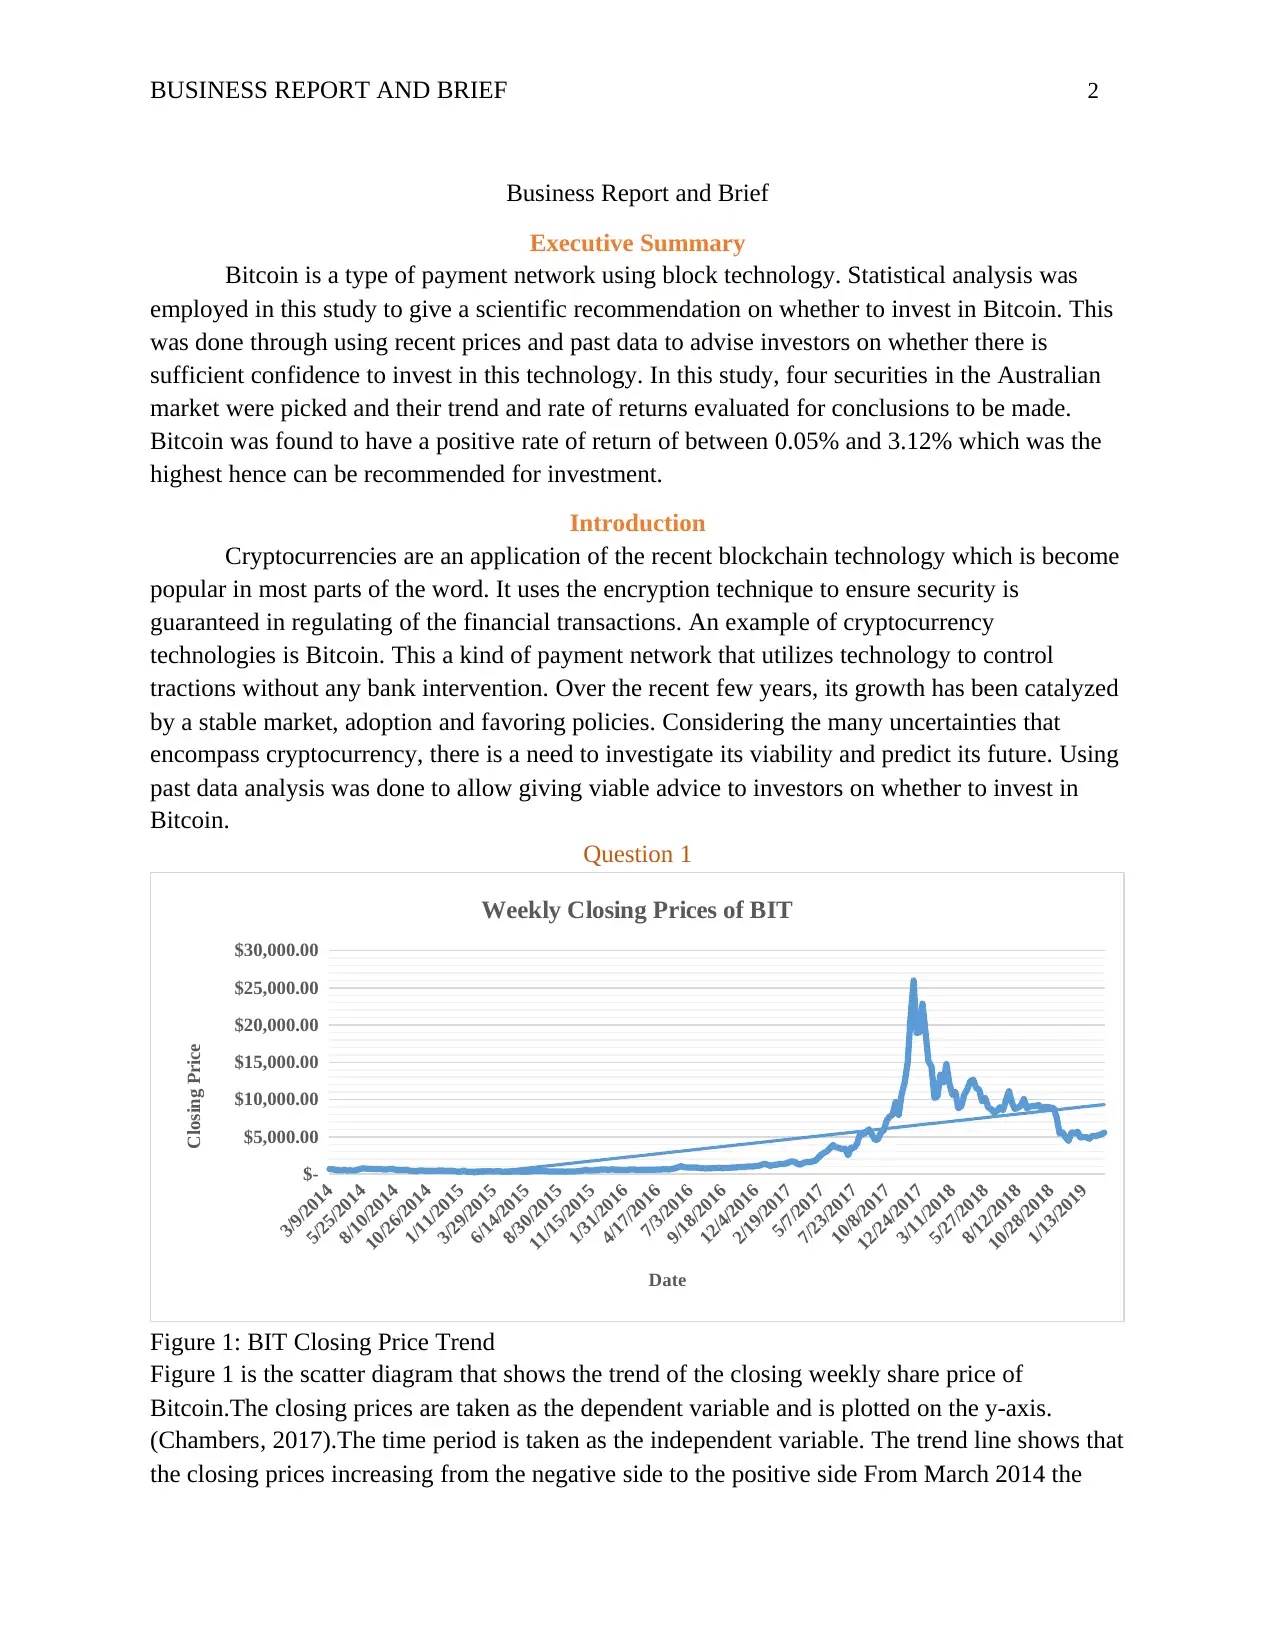
Figure 1: BIT Closing Price Trend
Figure 1 is the scatter diagram that shows the trend of the closing weekly share price of
Bitcoin.The closing prices are taken as the dependent variable and is plotted on the y-axis.
(Chambers, 2017).The time period is taken as the independent variable. The trend line shows that
the closing prices increasing from the negative side to the positive side From March 2014 the
Business Report and Brief
Executive Summary
Bitcoin is a type of payment network using block technology. Statistical analysis was
employed in this study to give a scientific recommendation on whether to invest in Bitcoin. This
was done through using recent prices and past data to advise investors on whether there is
sufficient confidence to invest in this technology. In this study, four securities in the Australian
market were picked and their trend and rate of returns evaluated for conclusions to be made.
Bitcoin was found to have a positive rate of return of between 0.05% and 3.12% which was the
highest hence can be recommended for investment.
Introduction
Cryptocurrencies are an application of the recent blockchain technology which is become
popular in most parts of the word. It uses the encryption technique to ensure security is
guaranteed in regulating of the financial transactions. An example of cryptocurrency
technologies is Bitcoin. This a kind of payment network that utilizes technology to control
tractions without any bank intervention. Over the recent few years, its growth has been catalyzed
by a stable market, adoption and favoring policies. Considering the many uncertainties that
encompass cryptocurrency, there is a need to investigate its viability and predict its future. Using
past data analysis was done to allow giving viable advice to investors on whether to invest in
Bitcoin.
Question 1
3/9/2014
5/25/2014
8/10/2014
10/26/2014
1/11/2015
3/29/2015
6/14/2015
8/30/2015
11/15/2015
1/31/2016
4/17/2016
7/3/2016
9/18/2016
12/4/2016
2/19/2017
5/7/2017
7/23/2017
10/8/2017
12/24/2017
3/11/2018
5/27/2018
8/12/2018
10/28/2018
1/13/2019
$-
$5,000.00
$10,000.00
$15,000.00
$20,000.00
$25,000.00
$30,000.00
Weekly Closing Prices of BIT
Date
Closing Price
Figure 1: BIT Closing Price Trend
Figure 1 is the scatter diagram that shows the trend of the closing weekly share price of
Bitcoin.The closing prices are taken as the dependent variable and is plotted on the y-axis.
(Chambers, 2017).The time period is taken as the independent variable. The trend line shows that
the closing prices increasing from the negative side to the positive side From March 2014 the
BUSINESS REPORT AND BRIEF 3
BIT prices were found to increase steadily over the world period. The closing prices averaged at
AU$ 572 from 2014 to 2016.An upward trend was observed from2017 to mid-2018 when the
share prices started declining. Since then they were found to fluctuate In 10th December 2017, the
highest closing price was recorded at AU$.25, 986.55
Question II
-39.755--29.755
-29.755--19.755
-19.755--9.755
-9.755-0.244999999999997
0.245-10.245
10.245-20.245
20.245-30.245
30.245-40.245
40.245-50.245
0
20
40
60
80
100
Bitcoin Weekly Rate of Return
Rate Class Limits
Frequency
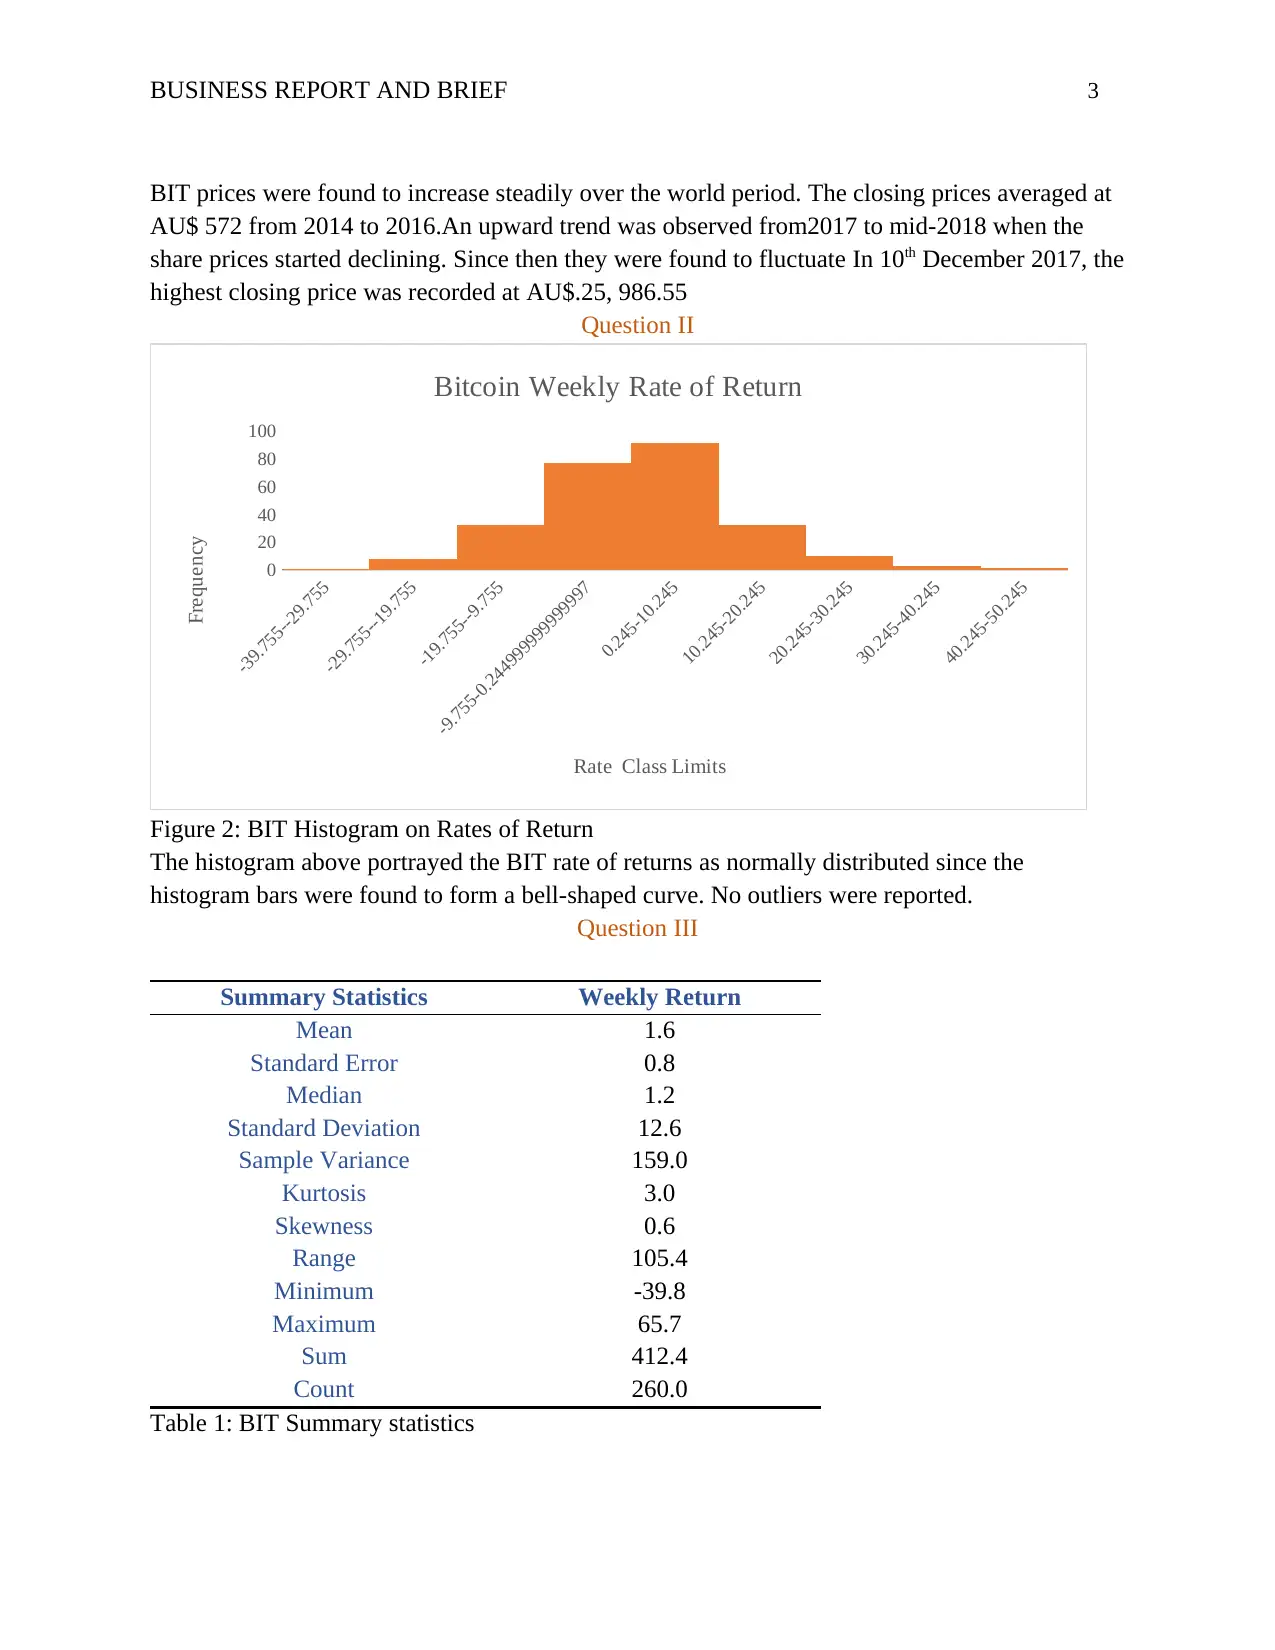
Figure 2: BIT Histogram on Rates of Return
The histogram above portrayed the BIT rate of returns as normally distributed since the
histogram bars were found to form a bell-shaped curve. No outliers were reported.
Question III
Summary Statistics Weekly Return
Mean 1.6
Standard Error 0.8
Median 1.2
Standard Deviation 12.6
Sample Variance 159.0
Kurtosis 3.0
Skewness 0.6
Range 105.4
Minimum -39.8
Maximum 65.7
Sum 412.4
Count 260.0
Table 1: BIT Summary statistics
BIT prices were found to increase steadily over the world period. The closing prices averaged at
AU$ 572 from 2014 to 2016.An upward trend was observed from2017 to mid-2018 when the
share prices started declining. Since then they were found to fluctuate In 10th December 2017, the
highest closing price was recorded at AU$.25, 986.55
Question II
-39.755--29.755
-29.755--19.755
-19.755--9.755
-9.755-0.244999999999997
0.245-10.245
10.245-20.245
20.245-30.245
30.245-40.245
40.245-50.245
0
20
40
60
80
100
Bitcoin Weekly Rate of Return
Rate Class Limits
Frequency
Figure 2: BIT Histogram on Rates of Return
The histogram above portrayed the BIT rate of returns as normally distributed since the
histogram bars were found to form a bell-shaped curve. No outliers were reported.
Question III
Summary Statistics Weekly Return
Mean 1.6
Standard Error 0.8
Median 1.2
Standard Deviation 12.6
Sample Variance 159.0
Kurtosis 3.0
Skewness 0.6
Range 105.4
Minimum -39.8
Maximum 65.7
Sum 412.4
Count 260.0
Table 1: BIT Summary statistics
⊘ This is a preview!⊘
Do you want full access?
Subscribe today to unlock all pages.
Trusted by 1+ million students worldwide
BUSINESS REPORT AND BRIEF 4
According to the instructions, three points descriptive analysis of the BIT rate of return was to be
analyzed.This involves location, shape, and spread. From the above table, the average rate of
return for this share was 1.6%. The mean of 1.6% represents the location of the distribution. The
shape of the distribution was measured by the values of Skewness and kurtosis. The distribution
was found to have a positive kurtosis and Skewness figures of 3.0 and 0.6 respectively. This is a
suggestion that the distribution of BIT is spread more on the positive side of the distribution
(most are in the right side of the median value). The standard deviation of BIT 12.6.The
maximum recorded rate of return was 65.7% and a minimum of -39.8%. This creates a range of
105.4. The values show the spread of this distribution. Lastly, the distribution of BIT rate of
return can be said to be multimodal since it had no specific value of mode.
.
Question IV
Empirical probability can be expressed as the number of times that a given even was
registered divided by the total possible events in the experiment.
Therefore the probability of BIT making a loss= Number of times a loss was registered / Total
Outcomes
P=114/260=0.44.
There is thus a 44% likelihood of getting a loss from BIT
Question V
3/9/2014
6/1/2014
8/24/2014
11/16/2014
2/8/2015
5/3/2015
7/26/2015
10/18/2015
1/10/2016
4/3/2016
6/26/2016
9/18/2016
12/11/2016
3/5/2017
5/28/2017
8/20/2017
11/12/2017
2/4/2018
4/29/2018
7/22/2018
10/14/2018
1/6/2019
$-
$5.00
$10.00
$15.00
$20.00
$25.00
$30.00
$35.00
$40.00
Weekly Closing Prices of NAB
Date
Closing Price
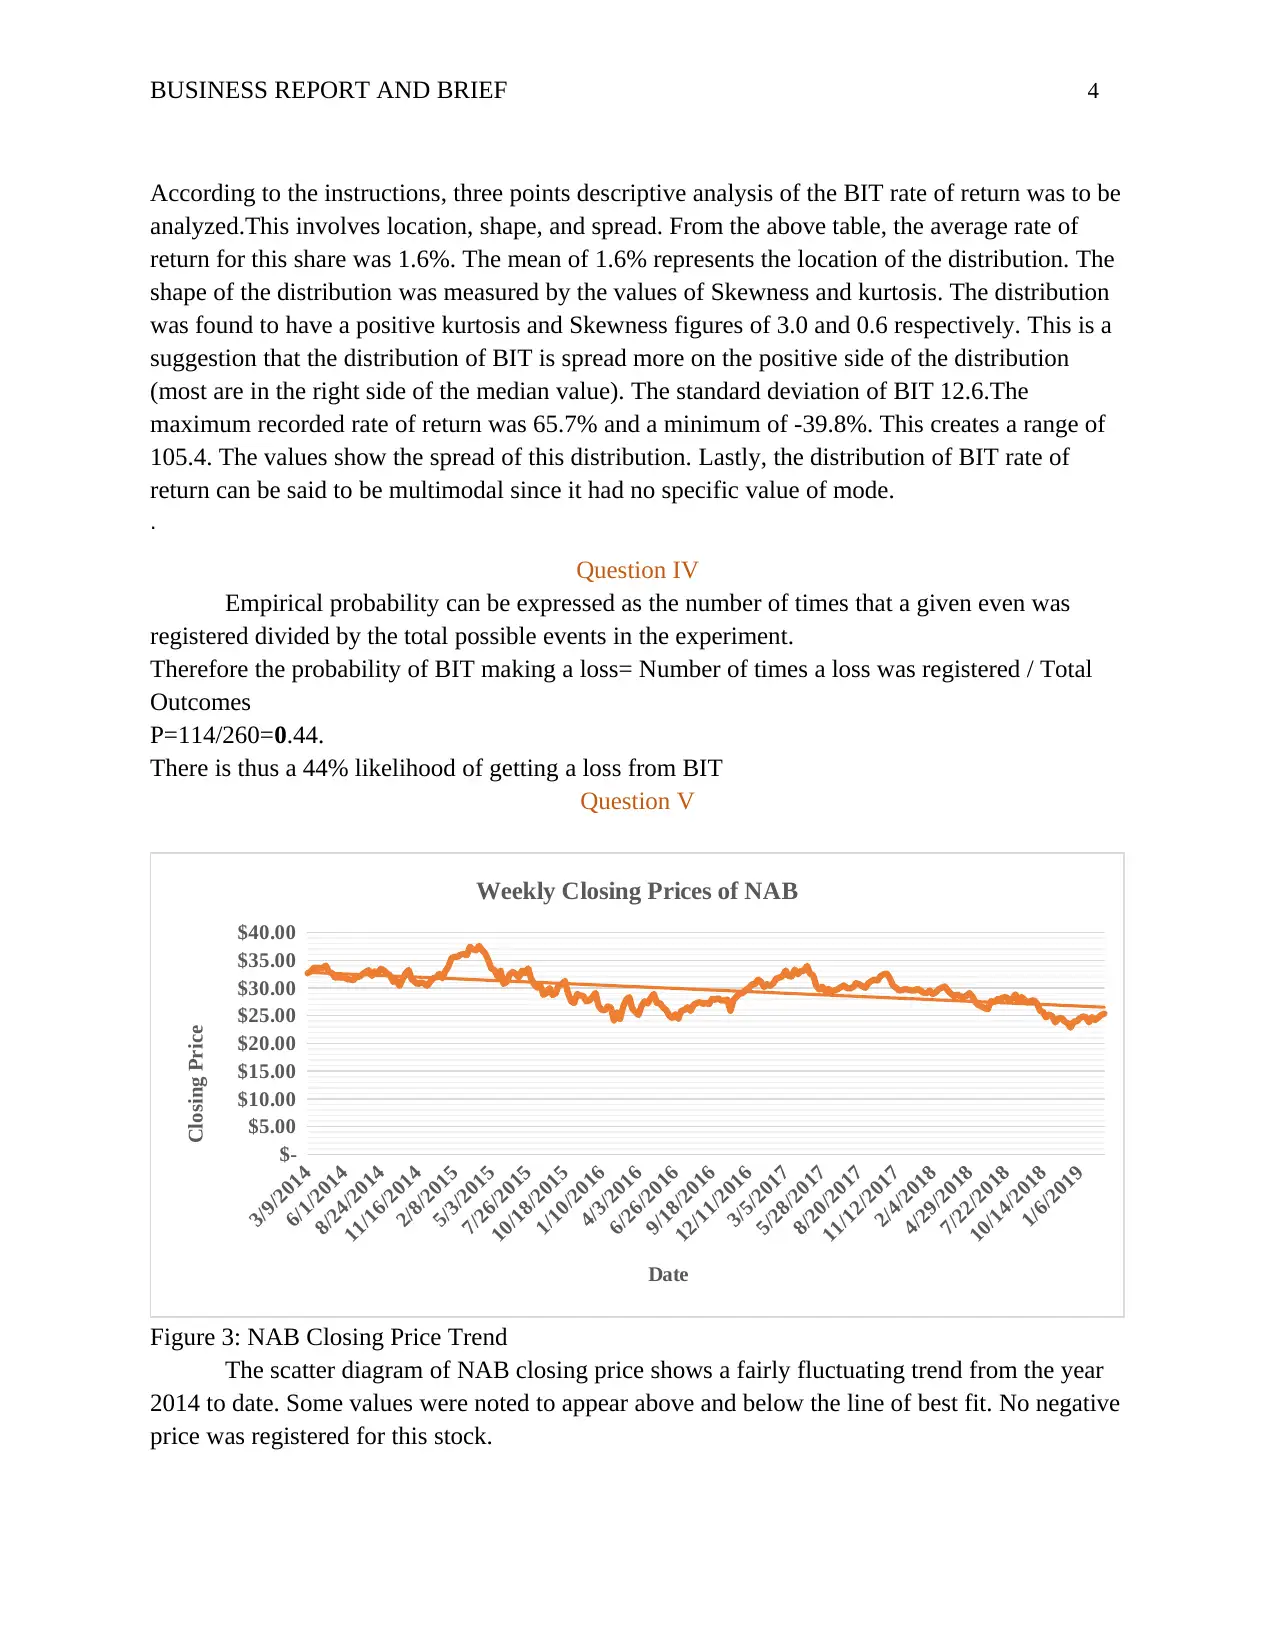
Figure 3: NAB Closing Price Trend
The scatter diagram of NAB closing price shows a fairly fluctuating trend from the year
2014 to date. Some values were noted to appear above and below the line of best fit. No negative
price was registered for this stock.
According to the instructions, three points descriptive analysis of the BIT rate of return was to be
analyzed.This involves location, shape, and spread. From the above table, the average rate of
return for this share was 1.6%. The mean of 1.6% represents the location of the distribution. The
shape of the distribution was measured by the values of Skewness and kurtosis. The distribution
was found to have a positive kurtosis and Skewness figures of 3.0 and 0.6 respectively. This is a
suggestion that the distribution of BIT is spread more on the positive side of the distribution
(most are in the right side of the median value). The standard deviation of BIT 12.6.The
maximum recorded rate of return was 65.7% and a minimum of -39.8%. This creates a range of
105.4. The values show the spread of this distribution. Lastly, the distribution of BIT rate of
return can be said to be multimodal since it had no specific value of mode.
.
Question IV
Empirical probability can be expressed as the number of times that a given even was
registered divided by the total possible events in the experiment.
Therefore the probability of BIT making a loss= Number of times a loss was registered / Total
Outcomes
P=114/260=0.44.
There is thus a 44% likelihood of getting a loss from BIT
Question V
3/9/2014
6/1/2014
8/24/2014
11/16/2014
2/8/2015
5/3/2015
7/26/2015
10/18/2015
1/10/2016
4/3/2016
6/26/2016
9/18/2016
12/11/2016
3/5/2017
5/28/2017
8/20/2017
11/12/2017
2/4/2018
4/29/2018
7/22/2018
10/14/2018
1/6/2019
$-
$5.00
$10.00
$15.00
$20.00
$25.00
$30.00
$35.00
$40.00
Weekly Closing Prices of NAB
Date
Closing Price
Figure 3: NAB Closing Price Trend
The scatter diagram of NAB closing price shows a fairly fluctuating trend from the year
2014 to date. Some values were noted to appear above and below the line of best fit. No negative
price was registered for this stock.
Paraphrase This Document
Need a fresh take? Get an instant paraphrase of this document with our AI Paraphraser
BUSINESS REPORT AND BRIEF 5
-8.767--6.767
-6.767--4.767
-4.767--2.767
-2.767--0.766999999999999
-0.766999999999999-1.233
1.233-3.233
3.233-5.233
5.233-7.233
7.233-9.233
0
20
40
60
80
NABWeekly Rate of Return
NAB Class Limit
Frequency
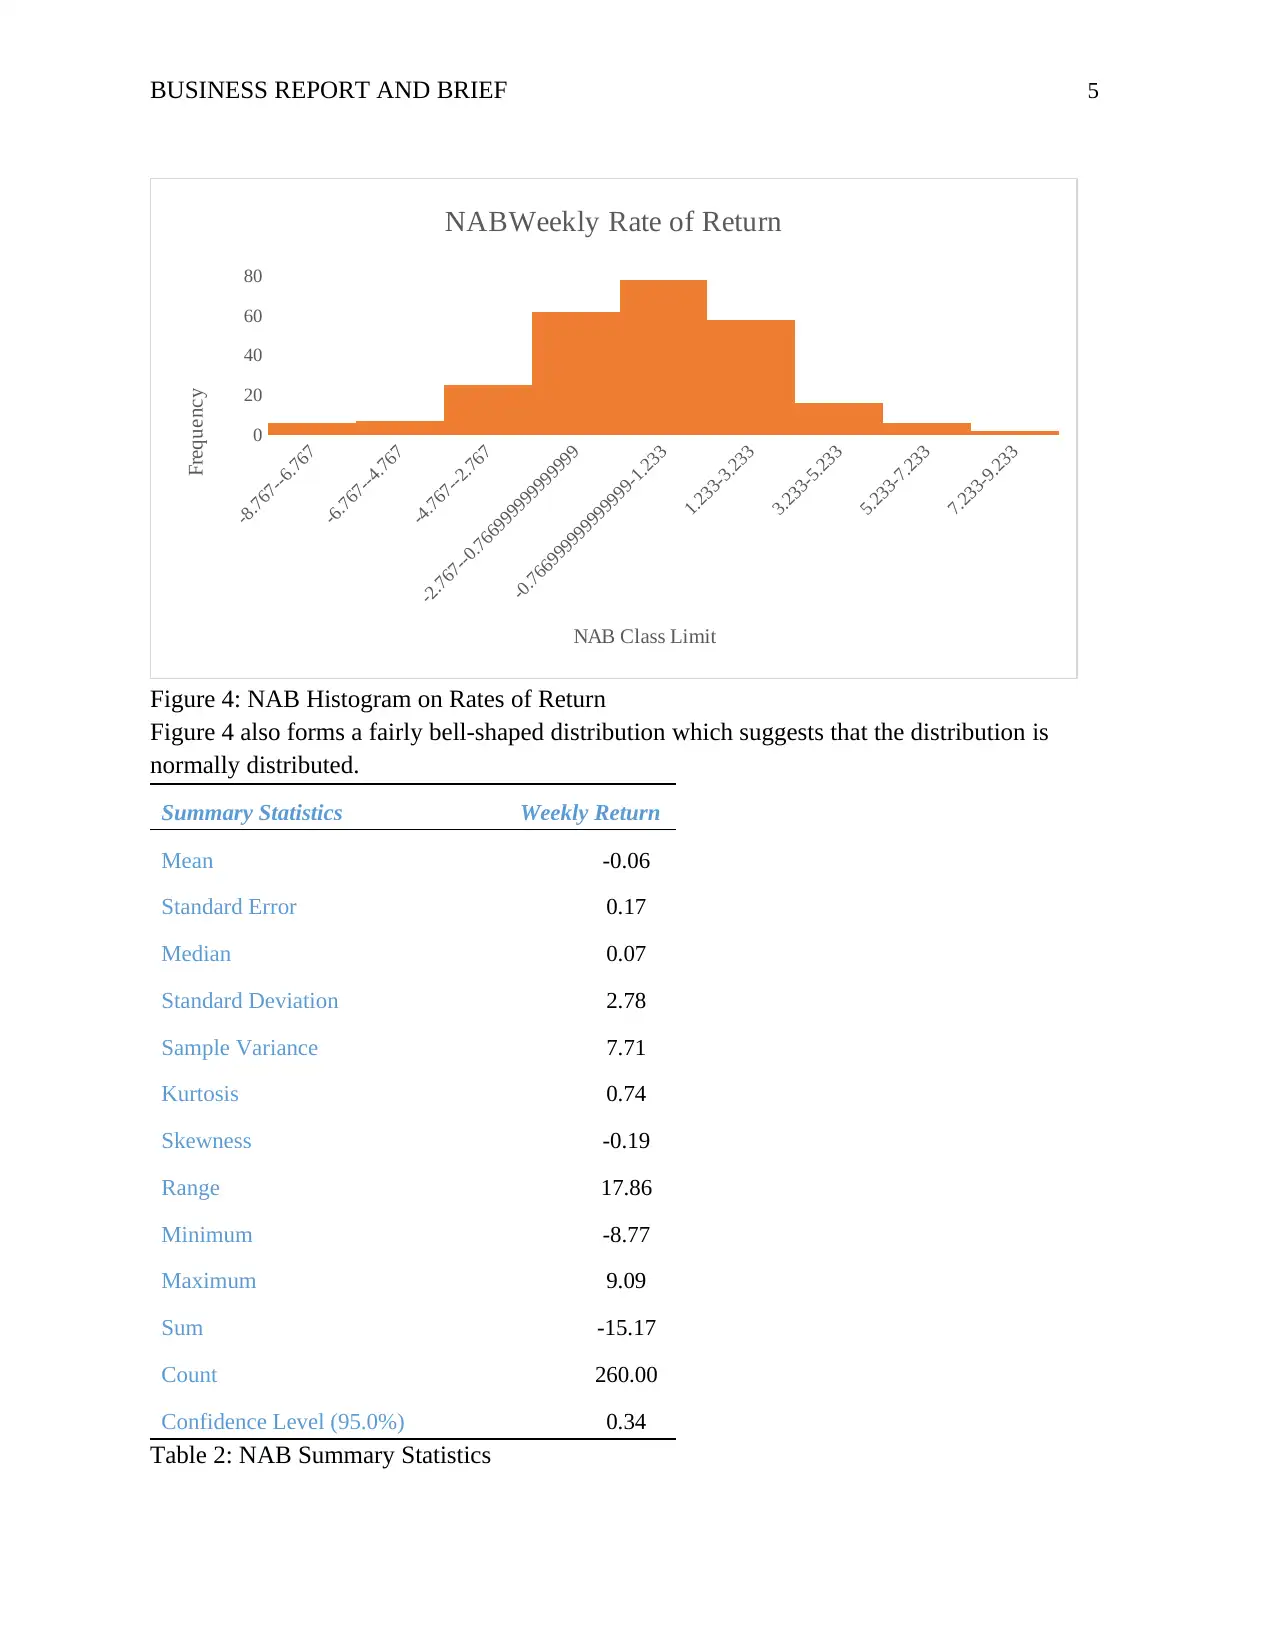
Figure 4: NAB Histogram on Rates of Return
Figure 4 also forms a fairly bell-shaped distribution which suggests that the distribution is
normally distributed.
Summary Statistics Weekly Return
Mean -0.06
Standard Error 0.17
Median 0.07
Standard Deviation 2.78
Sample Variance 7.71
Kurtosis 0.74
Skewness -0.19
Range 17.86
Minimum -8.77
Maximum 9.09
Sum -15.17
Count 260.00
Confidence Level (95.0%) 0.34
Table 2: NAB Summary Statistics
-8.767--6.767
-6.767--4.767
-4.767--2.767
-2.767--0.766999999999999
-0.766999999999999-1.233
1.233-3.233
3.233-5.233
5.233-7.233
7.233-9.233
0
20
40
60
80
NABWeekly Rate of Return
NAB Class Limit
Frequency
Figure 4: NAB Histogram on Rates of Return
Figure 4 also forms a fairly bell-shaped distribution which suggests that the distribution is
normally distributed.
Summary Statistics Weekly Return
Mean -0.06
Standard Error 0.17
Median 0.07
Standard Deviation 2.78
Sample Variance 7.71
Kurtosis 0.74
Skewness -0.19
Range 17.86
Minimum -8.77
Maximum 9.09
Sum -15.17
Count 260.00
Confidence Level (95.0%) 0.34
Table 2: NAB Summary Statistics
BUSINESS REPORT AND BRIEF 6
From the results above, the mean rate of return for National Australia Bank (NAB) is -
0.06%. This describes the location of the distribution. The maximum amounts of the rate of
return were found to be 9.09% and a minimum of -8.77%. From the two statistics, a range of
17.86 was computed. The distribution has a positive kurtosis of 0.74 and a negative Skewness of
-0.19. These 3 statistics show how the spread in distribution is.The spread was therefore found to
be more on the negative side of the distribution. A standard deviation of 2.78% was computed.
Probability of incurring a loss =126/260=0.48 or 48%
3/9/2014
6/1/2014
8/24/2014
11/16/2014
2/8/2015
5/3/2015
7/26/2015
10/18/2015
1/10/2016
4/3/2016
6/26/2016
9/18/2016
12/11/2016
3/5/2017
5/28/2017
8/20/2017
11/12/2017
2/4/2018
4/29/2018
7/22/2018
10/14/2018
1/6/2019
$-
$10.00
$20.00
$30.00
$40.00
$50.00
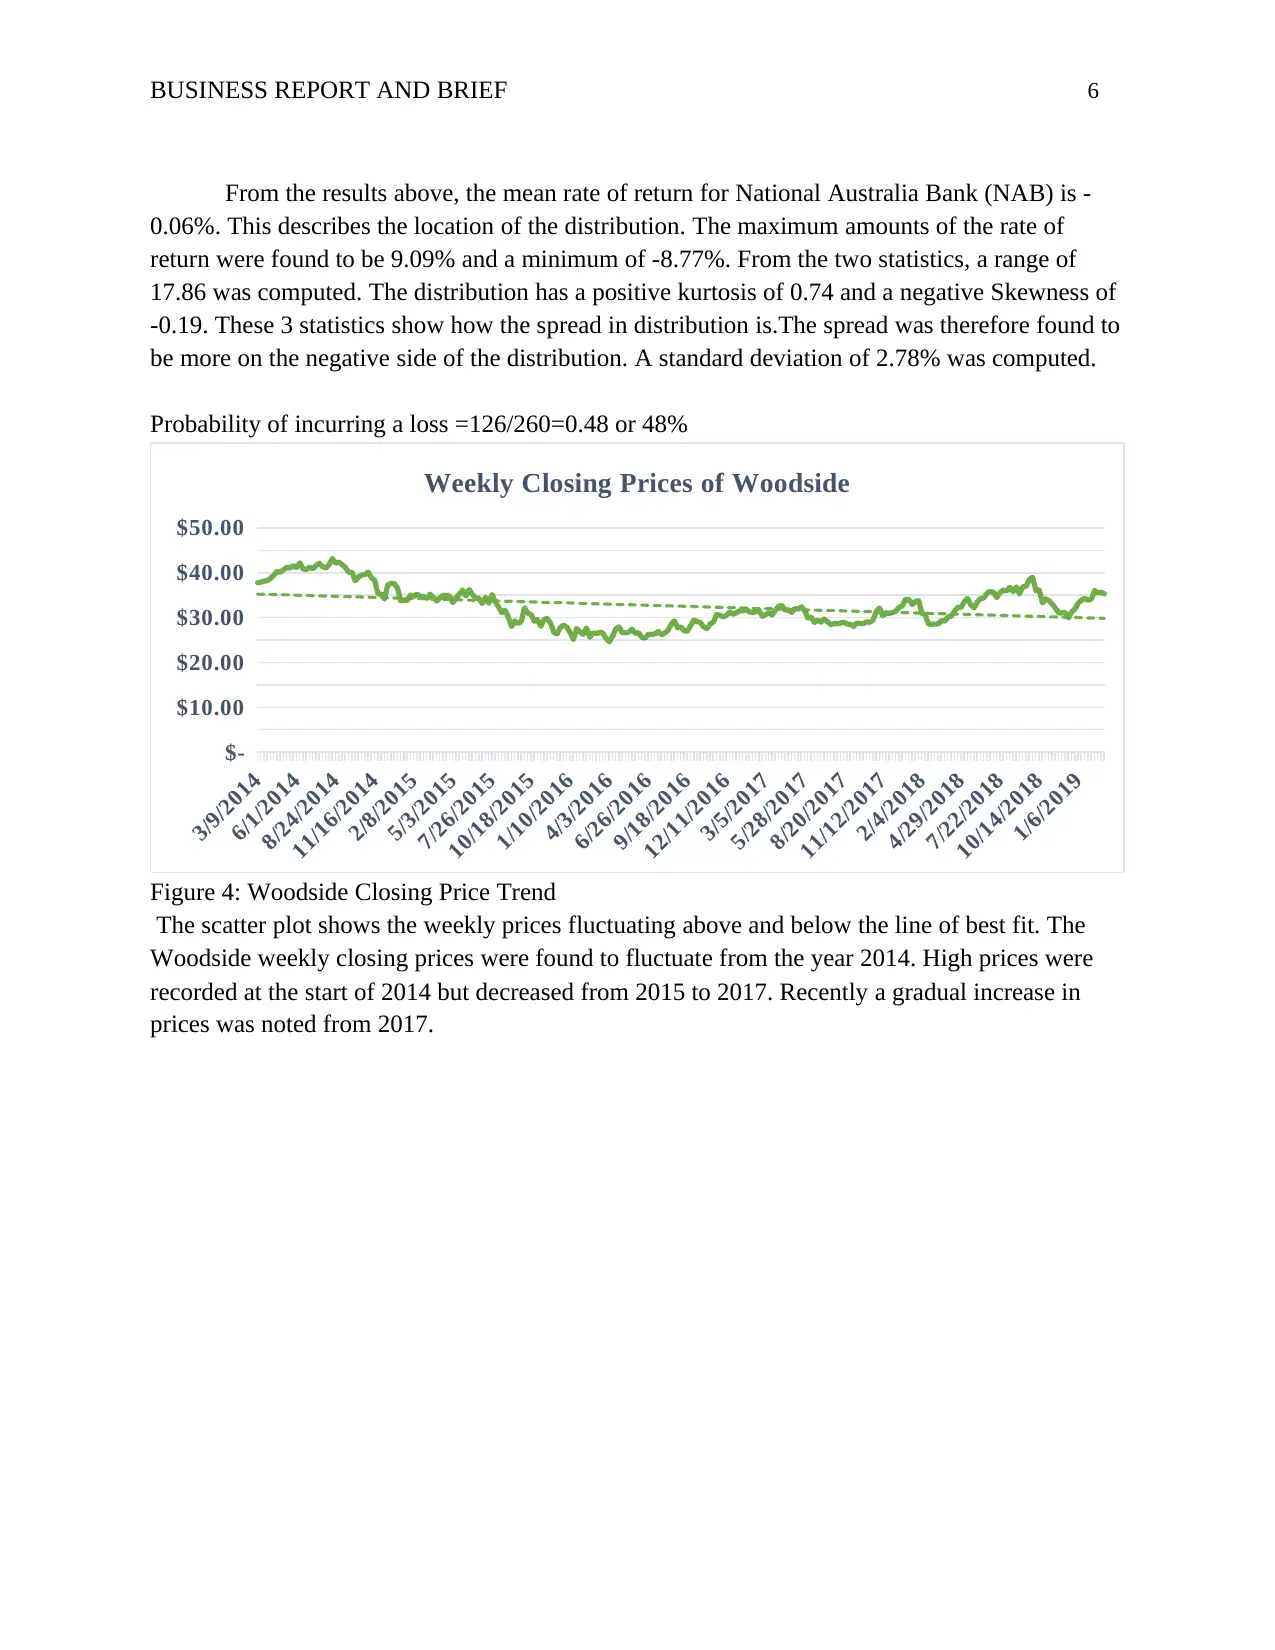
Weekly Closing Prices of Woodside
Figure 4: Woodside Closing Price Trend
The scatter plot shows the weekly prices fluctuating above and below the line of best fit. The
Woodside weekly closing prices were found to fluctuate from the year 2014. High prices were
recorded at the start of 2014 but decreased from 2015 to 2017. Recently a gradual increase in
prices was noted from 2017.
From the results above, the mean rate of return for National Australia Bank (NAB) is -
0.06%. This describes the location of the distribution. The maximum amounts of the rate of
return were found to be 9.09% and a minimum of -8.77%. From the two statistics, a range of
17.86 was computed. The distribution has a positive kurtosis of 0.74 and a negative Skewness of
-0.19. These 3 statistics show how the spread in distribution is.The spread was therefore found to
be more on the negative side of the distribution. A standard deviation of 2.78% was computed.
Probability of incurring a loss =126/260=0.48 or 48%
3/9/2014
6/1/2014
8/24/2014
11/16/2014
2/8/2015
5/3/2015
7/26/2015
10/18/2015
1/10/2016
4/3/2016
6/26/2016
9/18/2016
12/11/2016
3/5/2017
5/28/2017
8/20/2017
11/12/2017
2/4/2018
4/29/2018
7/22/2018
10/14/2018
1/6/2019
$-
$10.00
$20.00
$30.00
$40.00
$50.00
Weekly Closing Prices of Woodside
Figure 4: Woodside Closing Price Trend
The scatter plot shows the weekly prices fluctuating above and below the line of best fit. The
Woodside weekly closing prices were found to fluctuate from the year 2014. High prices were
recorded at the start of 2014 but decreased from 2015 to 2017. Recently a gradual increase in
prices was noted from 2017.
⊘ This is a preview!⊘
Do you want full access?
Subscribe today to unlock all pages.
Trusted by 1+ million students worldwide
BUSINESS REPORT AND BRIEF 7
-8.294--
6.294
-6.294--
4.294
-4.294--
2.294
-2.294--
0.294
-0.294-
1.706
1.706-
3.706
3.706-
5.706
5.706-
7.706
7.706-
9.706
0
10
20
30
40
50
60
70
80
90
Woodside Weekly Rate of Return
Rate Groupings
Frequency
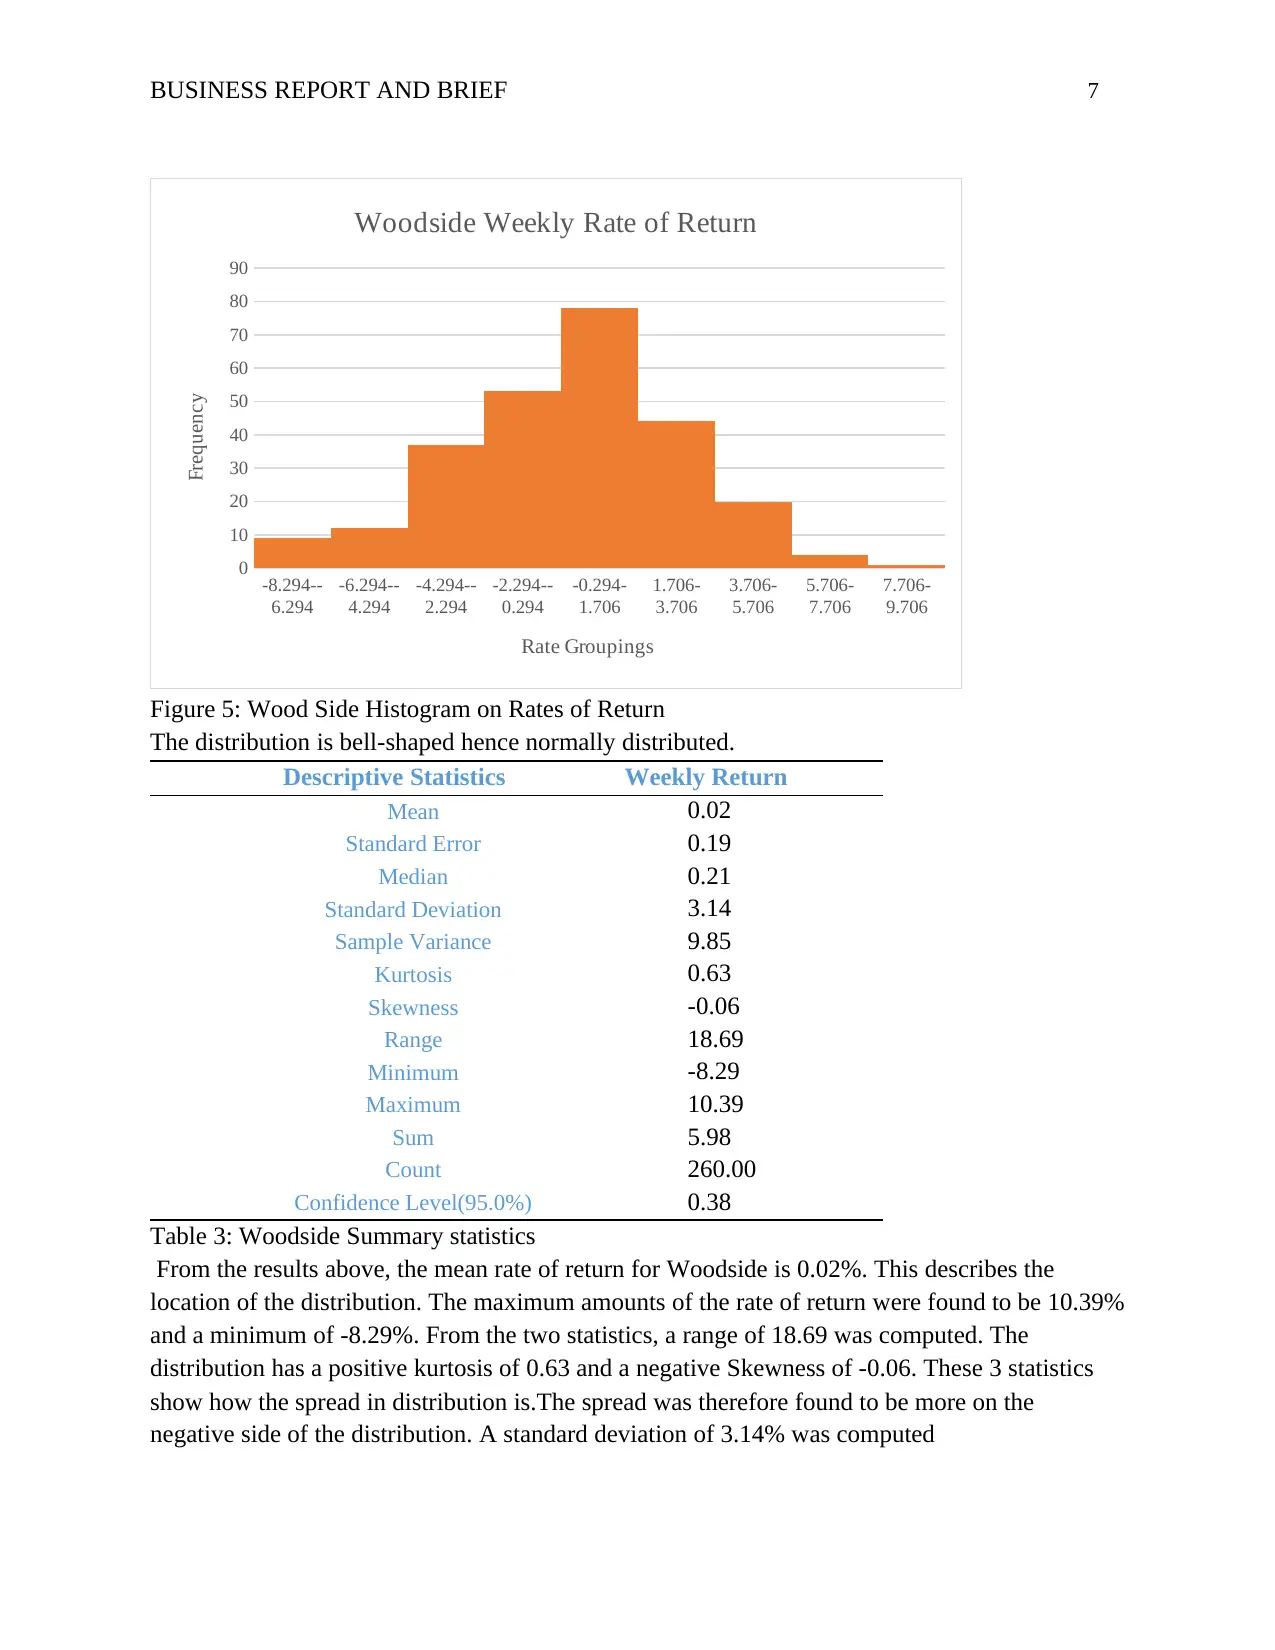
Figure 5: Wood Side Histogram on Rates of Return
The distribution is bell-shaped hence normally distributed.
Descriptive Statistics Weekly Return
Mean 0.02
Standard Error 0.19
Median 0.21
Standard Deviation 3.14
Sample Variance 9.85
Kurtosis 0.63
Skewness -0.06
Range 18.69
Minimum -8.29
Maximum 10.39
Sum 5.98
Count 260.00
Confidence Level(95.0%) 0.38
Table 3: Woodside Summary statistics
From the results above, the mean rate of return for Woodside is 0.02%. This describes the
location of the distribution. The maximum amounts of the rate of return were found to be 10.39%
and a minimum of -8.29%. From the two statistics, a range of 18.69 was computed. The
distribution has a positive kurtosis of 0.63 and a negative Skewness of -0.06. These 3 statistics
show how the spread in distribution is.The spread was therefore found to be more on the
negative side of the distribution. A standard deviation of 3.14% was computed
-8.294--
6.294
-6.294--
4.294
-4.294--
2.294
-2.294--
0.294
-0.294-
1.706
1.706-
3.706
3.706-
5.706
5.706-
7.706
7.706-
9.706
0
10
20
30
40
50
60
70
80
90
Woodside Weekly Rate of Return
Rate Groupings
Frequency
Figure 5: Wood Side Histogram on Rates of Return
The distribution is bell-shaped hence normally distributed.
Descriptive Statistics Weekly Return
Mean 0.02
Standard Error 0.19
Median 0.21
Standard Deviation 3.14
Sample Variance 9.85
Kurtosis 0.63
Skewness -0.06
Range 18.69
Minimum -8.29
Maximum 10.39
Sum 5.98
Count 260.00
Confidence Level(95.0%) 0.38
Table 3: Woodside Summary statistics
From the results above, the mean rate of return for Woodside is 0.02%. This describes the
location of the distribution. The maximum amounts of the rate of return were found to be 10.39%
and a minimum of -8.29%. From the two statistics, a range of 18.69 was computed. The
distribution has a positive kurtosis of 0.63 and a negative Skewness of -0.06. These 3 statistics
show how the spread in distribution is.The spread was therefore found to be more on the
negative side of the distribution. A standard deviation of 3.14% was computed
Paraphrase This Document
Need a fresh take? Get an instant paraphrase of this document with our AI Paraphraser

BUSINESS REPORT AND BRIEF 8
E.Probability of incurring a loss =124/260=0.48 or 48%
3/9/2014
6/8/2014
9/7/2014
12/7/2014
3/8/2015
6/7/2015
9/6/2015
12/6/2015
3/6/2016
6/5/2016
9/4/2016
12/4/2016
3/5/2017
6/4/2017
9/3/2017
12/3/2017
3/4/2018
6/3/2018
9/2/2018
12/2/2018
3/3/2019
$-
$5.00
$10.00
$15.00
$20.00
$25.00
$30.00
$35.00
$40.00
Weekly Closing Prices of Wesfarmers
Date
Closing Price
Figu
re 5: West Farmers Closing Price Trend
The above trend on West farmer’s weekly closing prices reveals a fluctuating trend from 2014 to
date. In the mid-2018, the highest prices were recorded
-8.612--
6.612
-6.612--
4.612
-4.612--
2.612
-2.612--
0.612
-0.612-
1.388
1.388-
3.388
3.388-
5.388
5.388-
7.388
0
20
40
60
80
100
120
West Framers Weekly Rate of Return
Rate Class Limit
Frequency
Figure 6: West Farmer Rate of Return Histogram
This shows that the above histogram is normally distributed.
Descriptive Statistics Weekly Return
0.08
Standard Error 0.15
BUSINESS REPORT AND BRIEF 9
Median 0.16
Standard Deviation 2.43
Sample Variance 5.89
Kurtosis 0.91
Skewness -0.44
Range 15.65
Minimum -8.61
Maximum 7.04
Sum 20.61
Count 260.00
Confidence Level (95.0%) 0.30
Table 4: West Framers Summary statistics
From the results above, the mean rate of return for West Farmers Limited is 0.08%. This
describes the location of the distribution. The maximum amounts of the rate of return were found
to be 7.04% and a minimum of -8.61%. From the two statistics, a range of 15.65 was computed.
The distribution has a positive kurtosis of 0.91 and a negative Skewness of -0.44. These 3
statistics show how the spread in distribution is.The spread was therefore found to be more on
the negative side of the distribution. A standard deviation of 2.43% was computed.
Probability of incurring a loss =119/260=0.46 or 46%
Question 6
The Confidence interval of distribution is given by ∓ z where
- mean, z- z score and is the standard error.
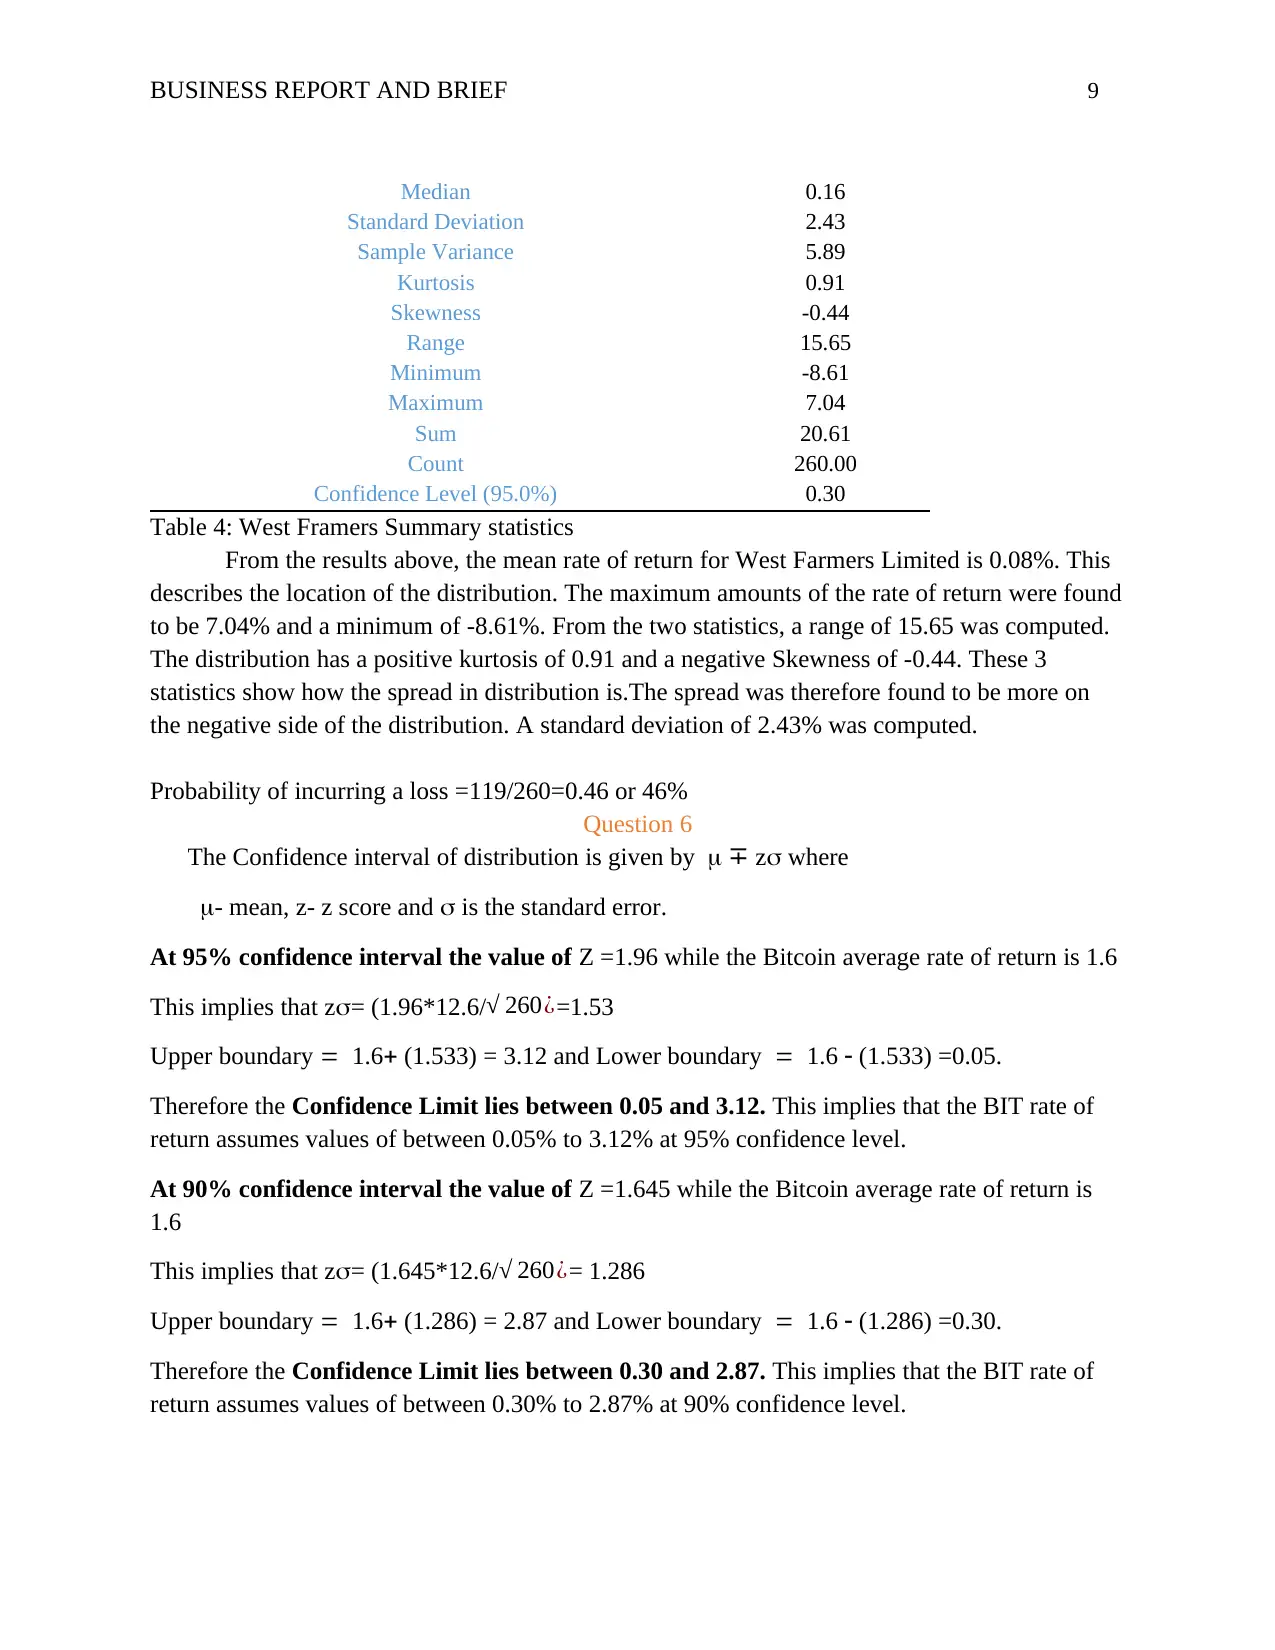
At 95% confidence interval the value of Z =1.96 while the Bitcoin average rate of return is 1.6
This implies that z= (1.96*12.6/√ 260¿=1.53
Upper boundary 1.6 (1.533) = 3.12 and Lower boundary 1.6 (1.533) =0.05.
Therefore the Confidence Limit lies between 0.05 and 3.12. This implies that the BIT rate of
return assumes values of between 0.05% to 3.12% at 95% confidence level.
At 90% confidence interval the value of Z =1.645 while the Bitcoin average rate of return is
1.6
This implies that z= (1.645*12.6/√ 260¿= 1.286
Upper boundary 1.6 (1.286) = 2.87 and Lower boundary 1.6 (1.286) =0.30.
Therefore the Confidence Limit lies between 0.30 and 2.87. This implies that the BIT rate of
return assumes values of between 0.30% to 2.87% at 90% confidence level.
Median 0.16
Standard Deviation 2.43
Sample Variance 5.89
Kurtosis 0.91
Skewness -0.44
Range 15.65
Minimum -8.61
Maximum 7.04
Sum 20.61
Count 260.00
Confidence Level (95.0%) 0.30
Table 4: West Framers Summary statistics
From the results above, the mean rate of return for West Farmers Limited is 0.08%. This
describes the location of the distribution. The maximum amounts of the rate of return were found
to be 7.04% and a minimum of -8.61%. From the two statistics, a range of 15.65 was computed.
The distribution has a positive kurtosis of 0.91 and a negative Skewness of -0.44. These 3
statistics show how the spread in distribution is.The spread was therefore found to be more on
the negative side of the distribution. A standard deviation of 2.43% was computed.
Probability of incurring a loss =119/260=0.46 or 46%
Question 6
The Confidence interval of distribution is given by ∓ z where
- mean, z- z score and is the standard error.
At 95% confidence interval the value of Z =1.96 while the Bitcoin average rate of return is 1.6
This implies that z= (1.96*12.6/√ 260¿=1.53
Upper boundary 1.6 (1.533) = 3.12 and Lower boundary 1.6 (1.533) =0.05.
Therefore the Confidence Limit lies between 0.05 and 3.12. This implies that the BIT rate of
return assumes values of between 0.05% to 3.12% at 95% confidence level.
At 90% confidence interval the value of Z =1.645 while the Bitcoin average rate of return is
1.6
This implies that z= (1.645*12.6/√ 260¿= 1.286
Upper boundary 1.6 (1.286) = 2.87 and Lower boundary 1.6 (1.286) =0.30.
Therefore the Confidence Limit lies between 0.30 and 2.87. This implies that the BIT rate of
return assumes values of between 0.30% to 2.87% at 90% confidence level.
⊘ This is a preview!⊘
Do you want full access?
Subscribe today to unlock all pages.
Trusted by 1+ million students worldwide
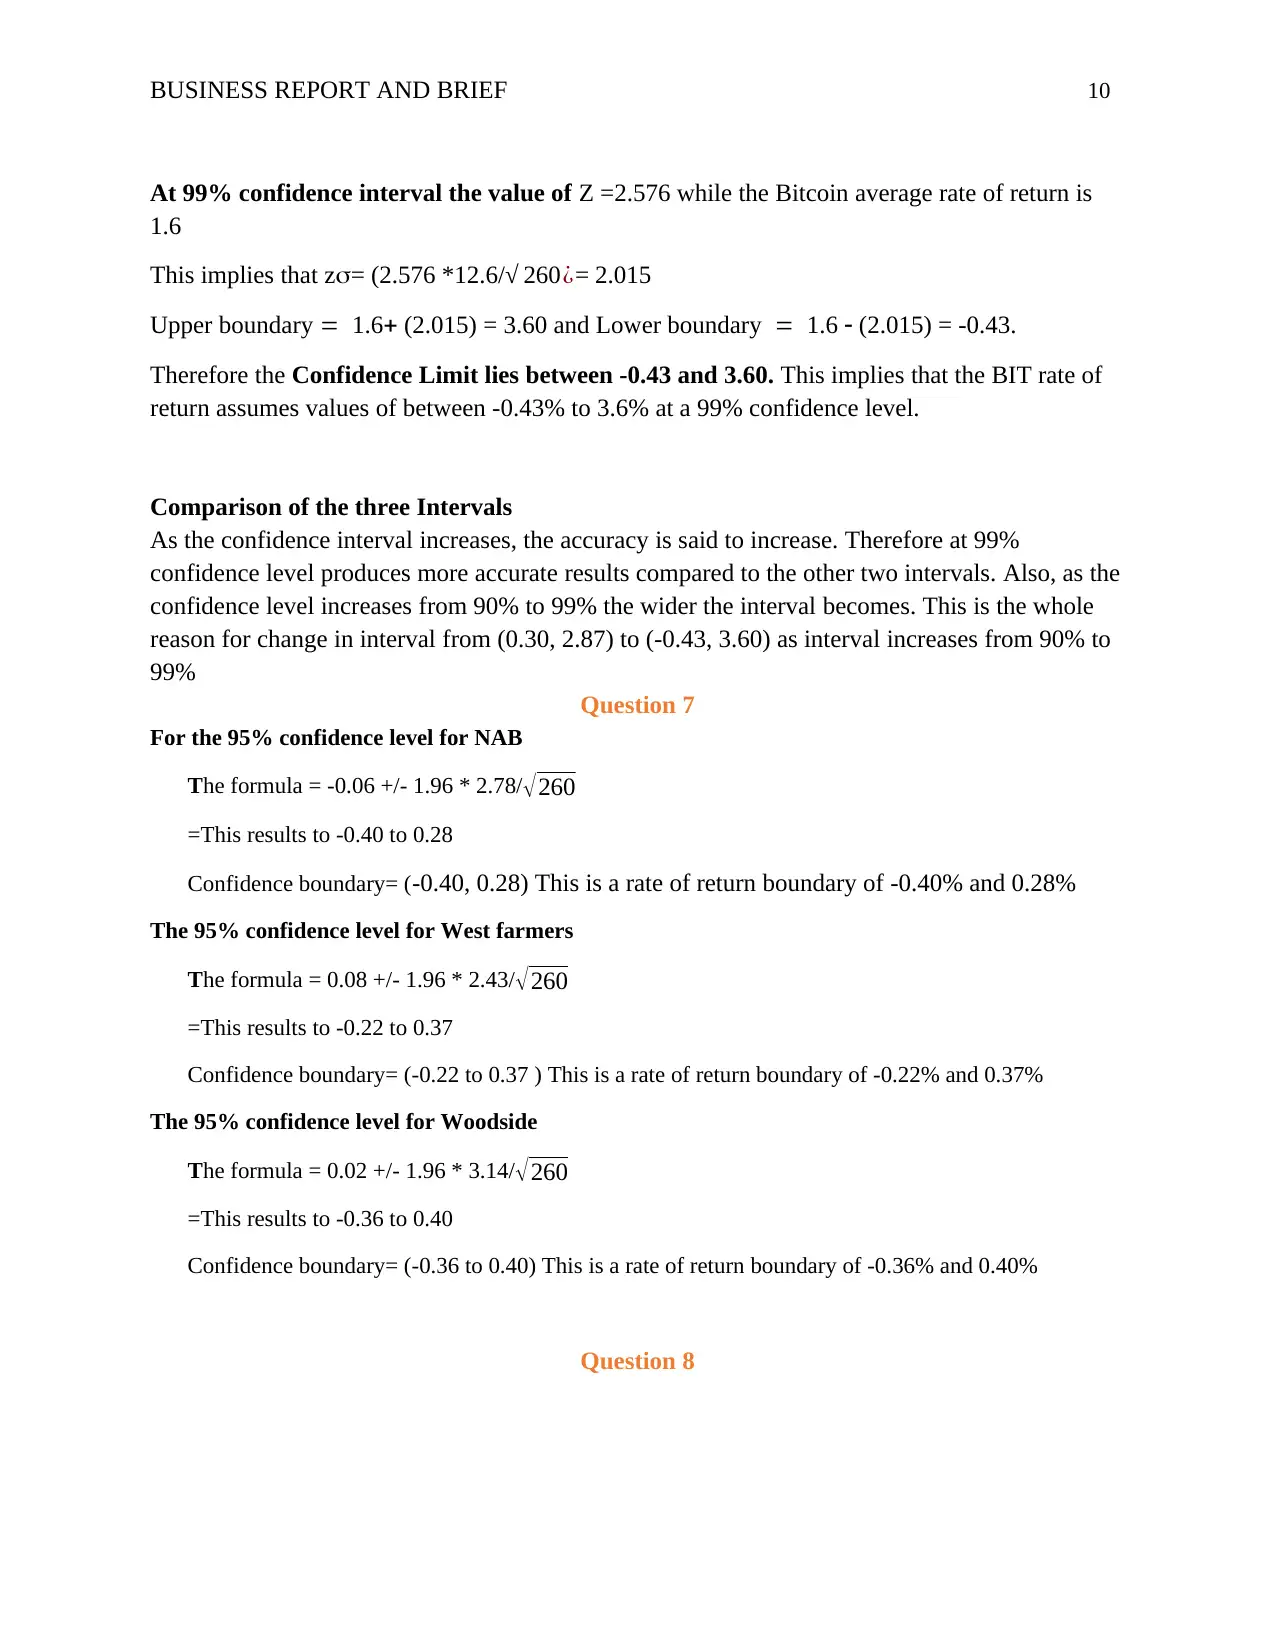
BUSINESS REPORT AND BRIEF 10
At 99% confidence interval the value of Z =2.576 while the Bitcoin average rate of return is
1.6
This implies that z= (2.576 *12.6/√ 260¿= 2.015
Upper boundary 1.6 (2.015) = 3.60 and Lower boundary 1.6 (2.015) = -0.43.
Therefore the Confidence Limit lies between -0.43 and 3.60. This implies that the BIT rate of
return assumes values of between -0.43% to 3.6% at a 99% confidence level.
Comparison of the three Intervals
As the confidence interval increases, the accuracy is said to increase. Therefore at 99%
confidence level produces more accurate results compared to the other two intervals. Also, as the
confidence level increases from 90% to 99% the wider the interval becomes. This is the whole
reason for change in interval from (0.30, 2.87) to (-0.43, 3.60) as interval increases from 90% to
99%
Question 7
For the 95% confidence level for NAB
The formula = -0.06 +/- 1.96 * 2.78/ √260
=This results to -0.40 to 0.28
Confidence boundary= (-0.40, 0.28) This is a rate of return boundary of -0.40% and 0.28%
The 95% confidence level for West farmers
The formula = 0.08 +/- 1.96 * 2.43/ √260
=This results to -0.22 to 0.37
Confidence boundary= (-0.22 to 0.37 ) This is a rate of return boundary of -0.22% and 0.37%
The 95% confidence level for Woodside
The formula = 0.02 +/- 1.96 * 3.14/ √260
=This results to -0.36 to 0.40
Confidence boundary= (-0.36 to 0.40) This is a rate of return boundary of -0.36% and 0.40%
Question 8
Paraphrase This Document
Need a fresh take? Get an instant paraphrase of this document with our AI Paraphraser
BUSINESS REPORT AND BRIEF 11
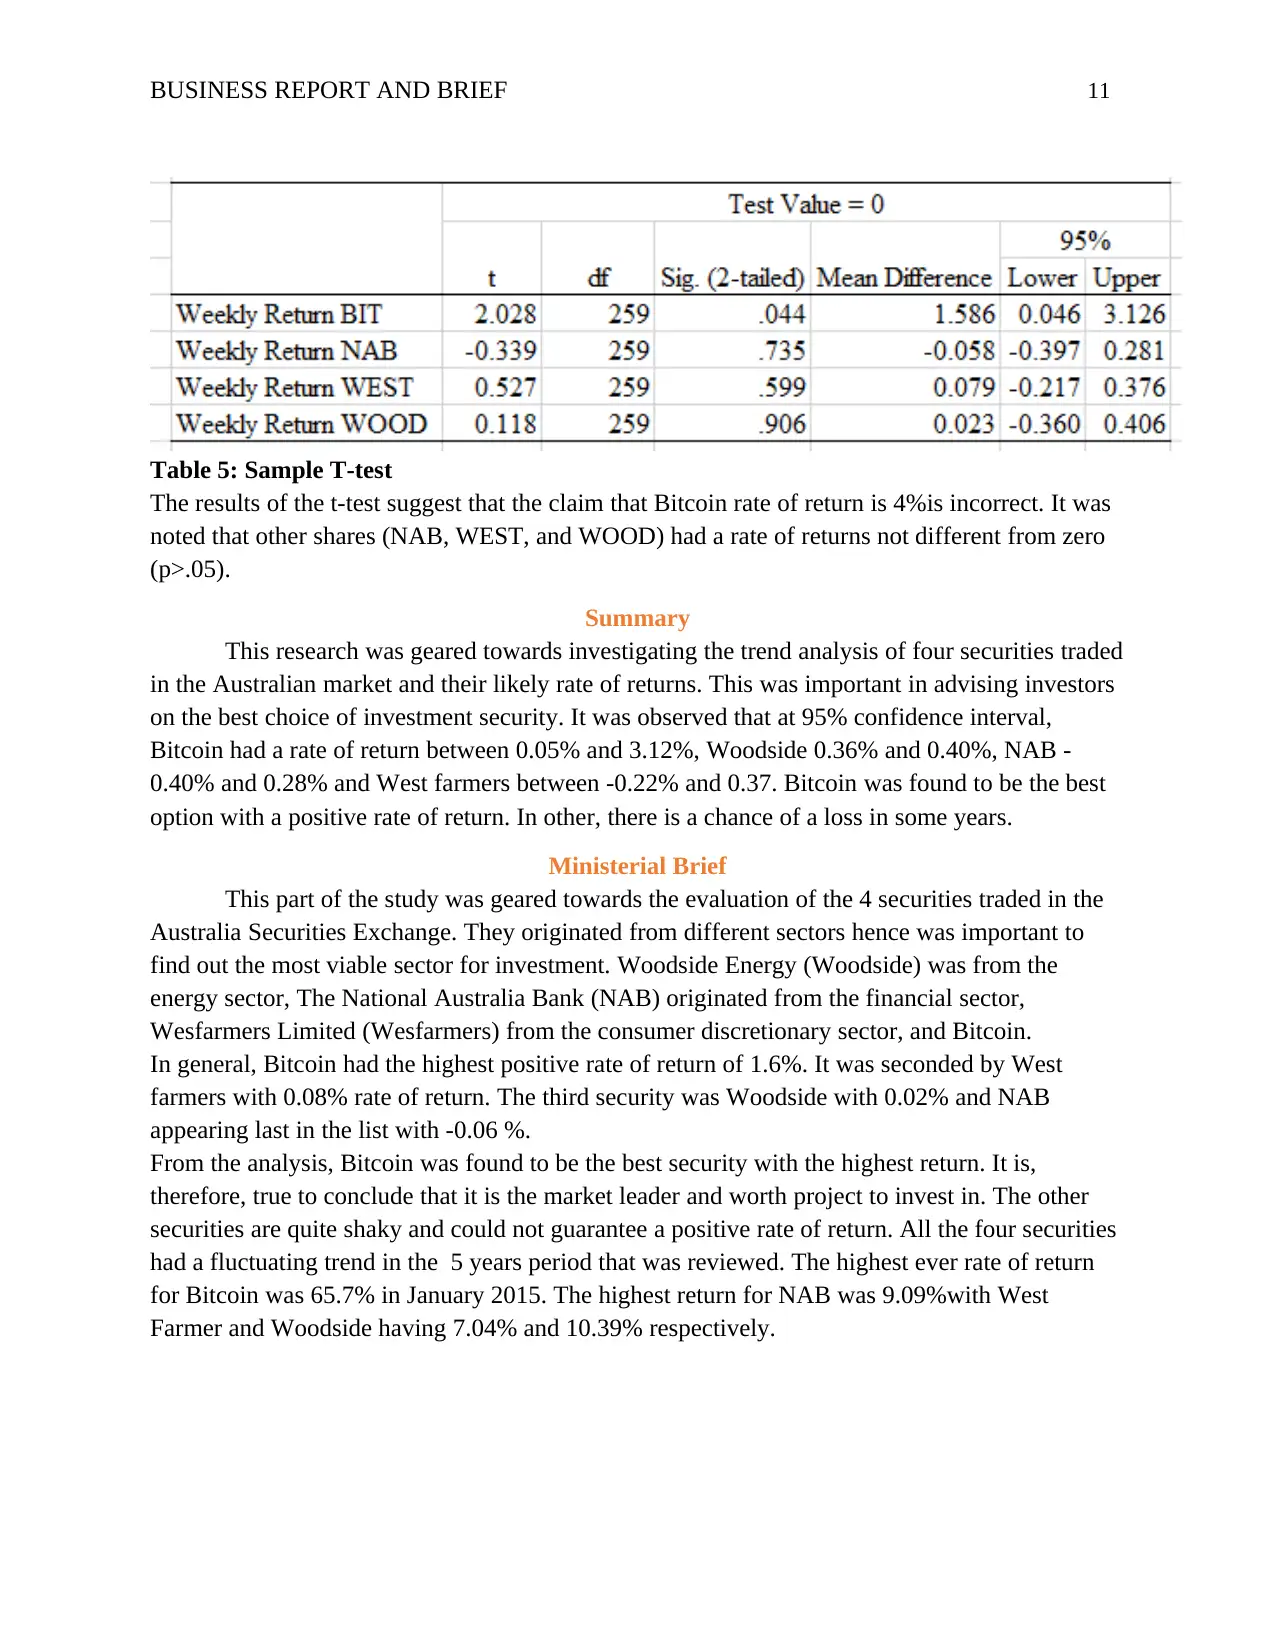
Table 5: Sample T-test
The results of the t-test suggest that the claim that Bitcoin rate of return is 4%is incorrect. It was
noted that other shares (NAB, WEST, and WOOD) had a rate of returns not different from zero
(p>.05).
Summary
This research was geared towards investigating the trend analysis of four securities traded
in the Australian market and their likely rate of returns. This was important in advising investors
on the best choice of investment security. It was observed that at 95% confidence interval,
Bitcoin had a rate of return between 0.05% and 3.12%, Woodside 0.36% and 0.40%, NAB -
0.40% and 0.28% and West farmers between -0.22% and 0.37. Bitcoin was found to be the best
option with a positive rate of return. In other, there is a chance of a loss in some years.
Ministerial Brief
This part of the study was geared towards the evaluation of the 4 securities traded in the
Australia Securities Exchange. They originated from different sectors hence was important to
find out the most viable sector for investment. Woodside Energy (Woodside) was from the
energy sector, The National Australia Bank (NAB) originated from the financial sector,
Wesfarmers Limited (Wesfarmers) from the consumer discretionary sector, and Bitcoin.
In general, Bitcoin had the highest positive rate of return of 1.6%. It was seconded by West
farmers with 0.08% rate of return. The third security was Woodside with 0.02% and NAB
appearing last in the list with -0.06 %.
From the analysis, Bitcoin was found to be the best security with the highest return. It is,
therefore, true to conclude that it is the market leader and worth project to invest in. The other
securities are quite shaky and could not guarantee a positive rate of return. All the four securities
had a fluctuating trend in the 5 years period that was reviewed. The highest ever rate of return
for Bitcoin was 65.7% in January 2015. The highest return for NAB was 9.09%with West
Farmer and Woodside having 7.04% and 10.39% respectively.
BUSINESS REPORT AND BRIEF 12
References
Chambers, J.M. (2017). Graphical Methods for Data Analysis: 0. Chapman and Hall/CRC.
References
Chambers, J.M. (2017). Graphical Methods for Data Analysis: 0. Chapman and Hall/CRC.
⊘ This is a preview!⊘
Do you want full access?
Subscribe today to unlock all pages.
Trusted by 1+ million students worldwide
1 out of 12
Related Documents


Your All-in-One AI-Powered Toolkit for Academic Success.
+13062052269
info@desklib.com
Available 24*7 on WhatsApp / Email
![[object Object]](/_next/static/media/star-bottom.7253800d.svg)
Unlock your academic potential
© 2024 | Zucol Services PVT LTD | All rights reserved.