Comparative Financial Analysis of Tesco and Marks & Spencer
VerifiedAdded on 2020/06/06
|9
|2237
|37
Report
AI Summary
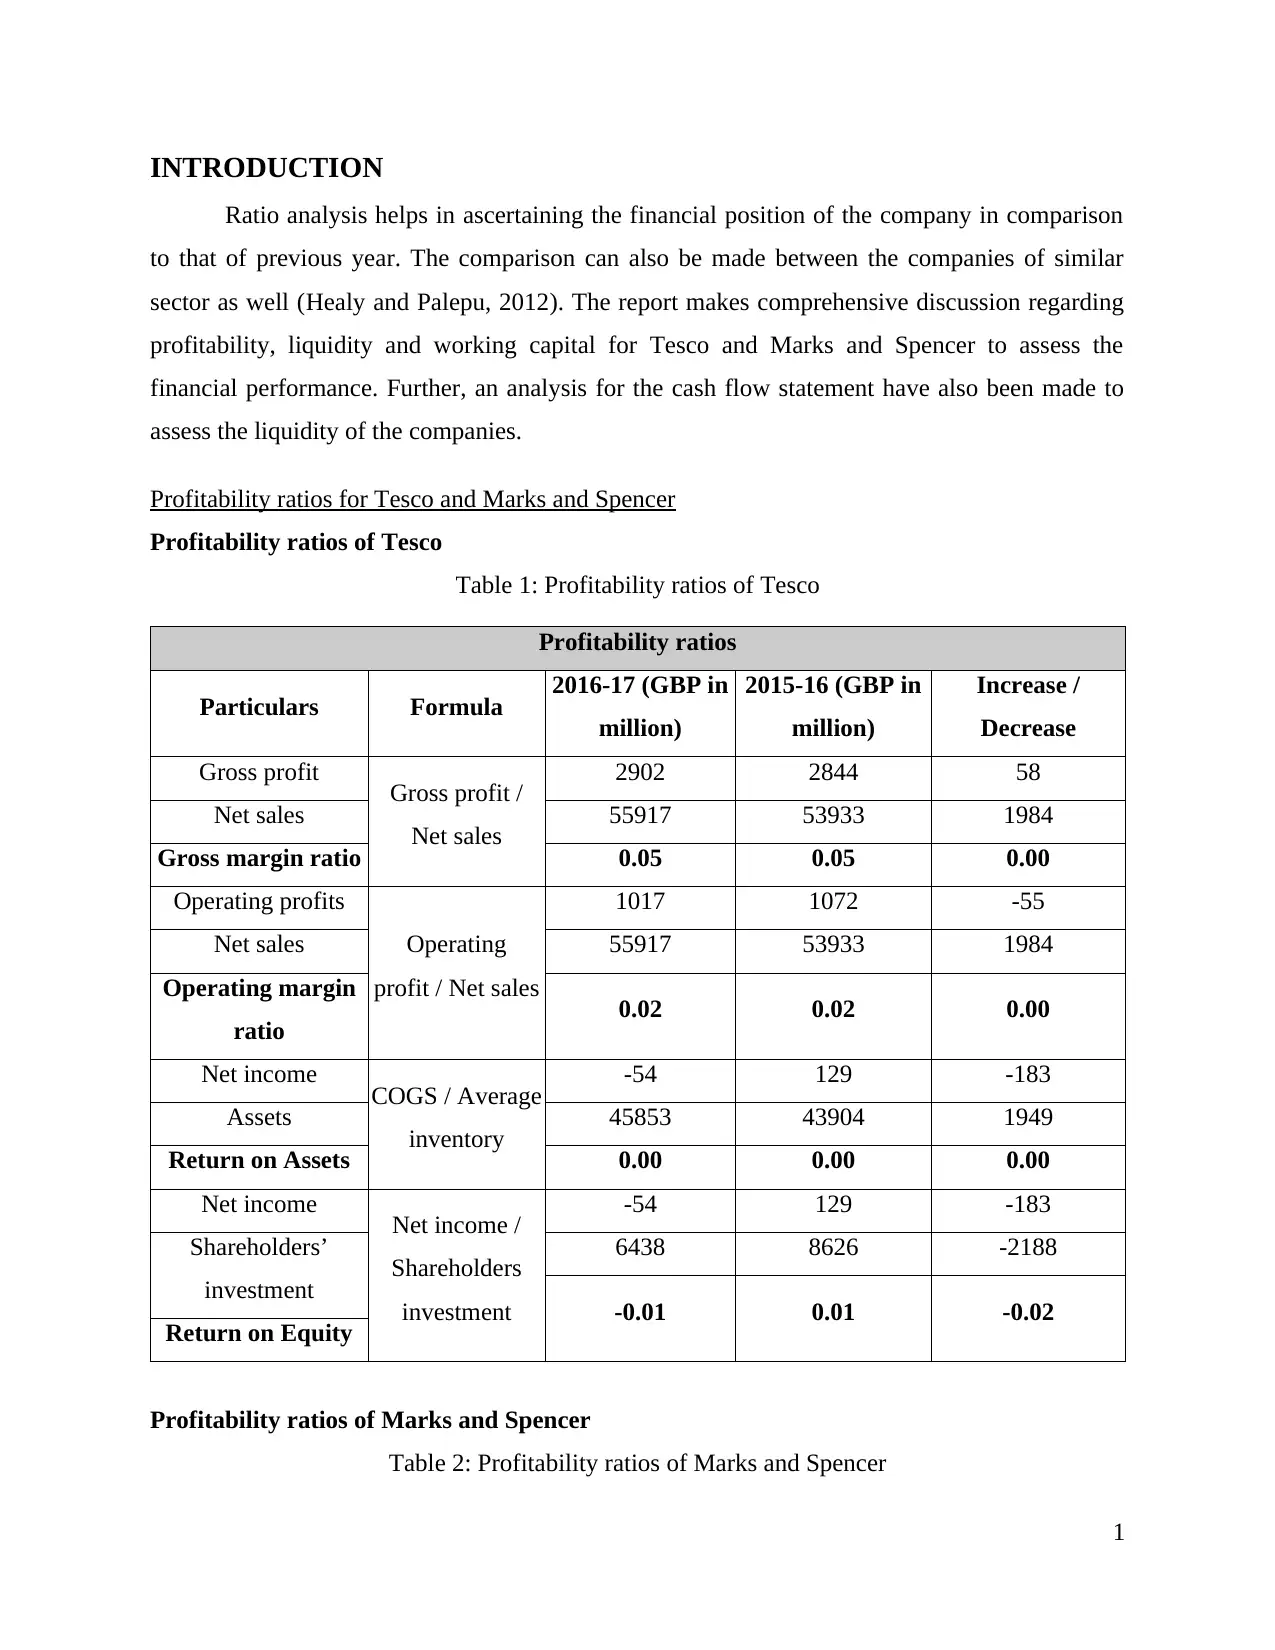
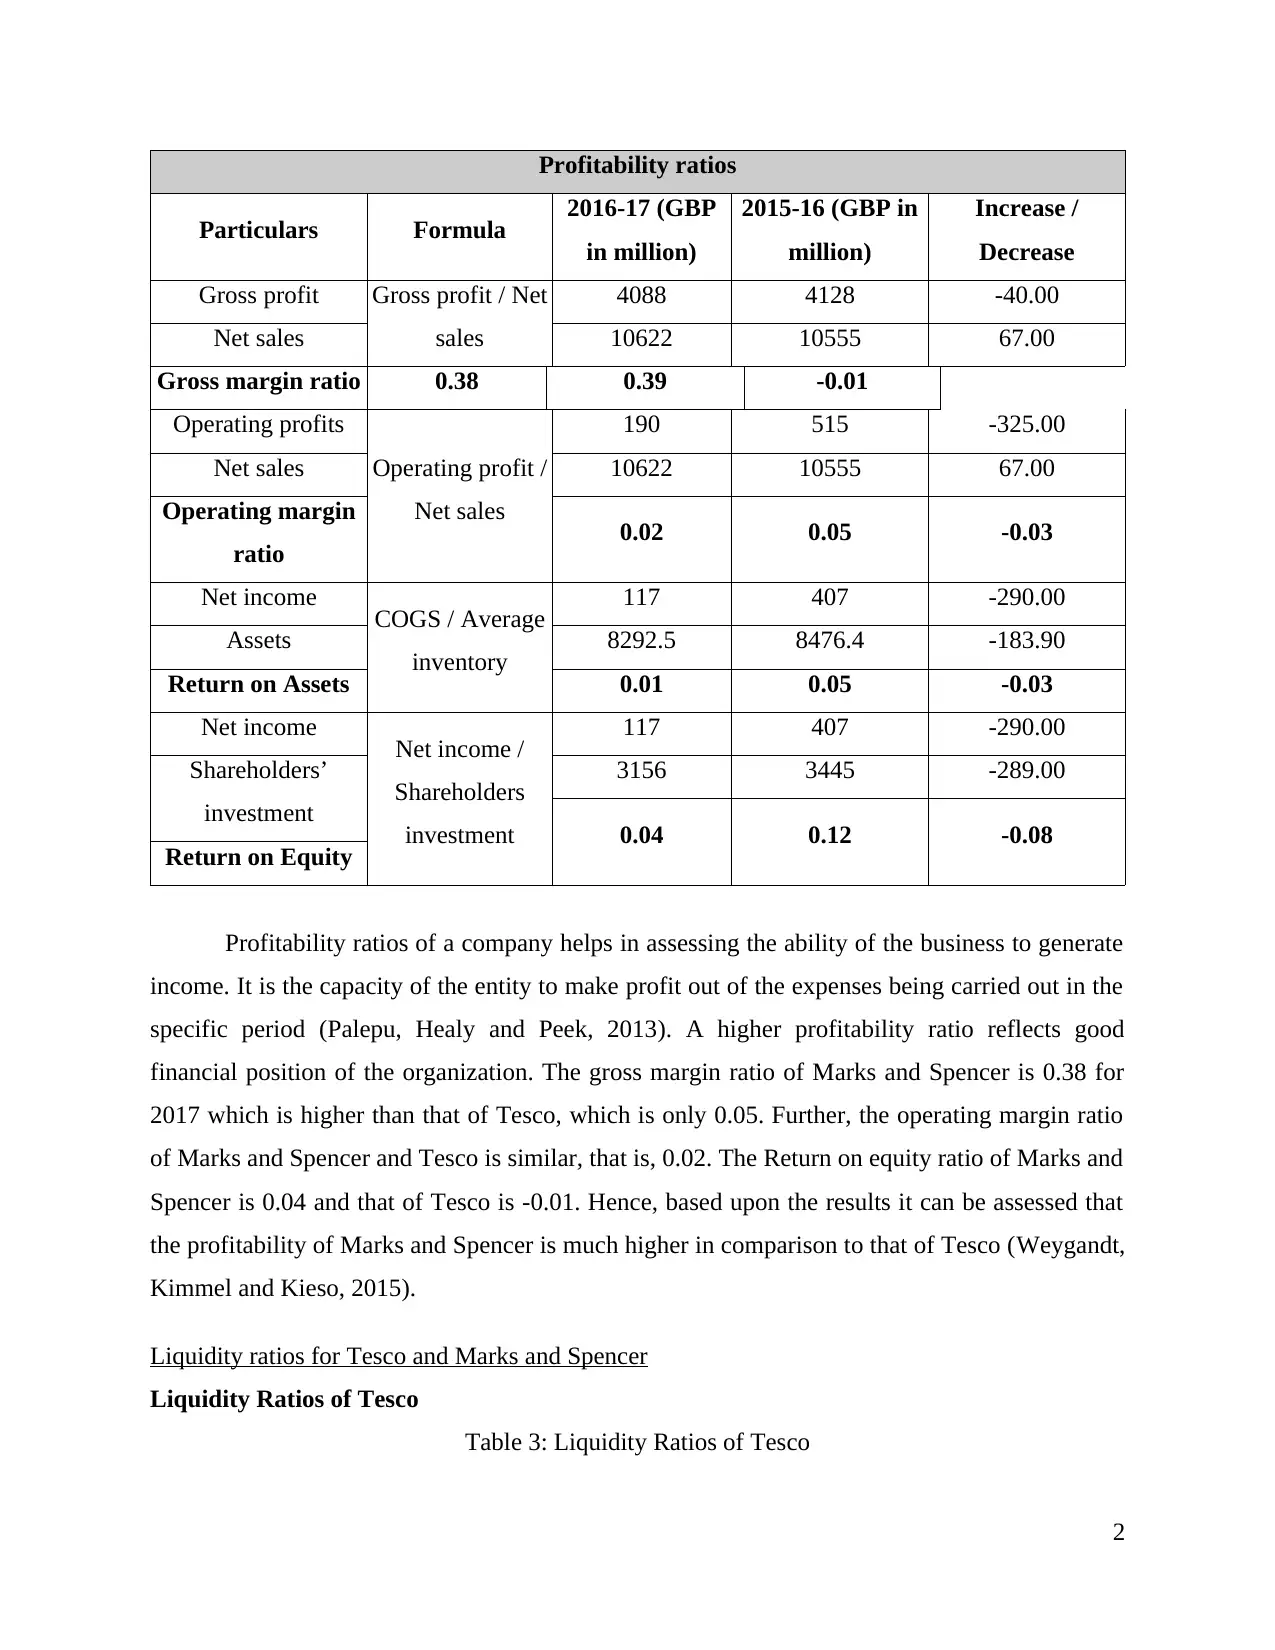
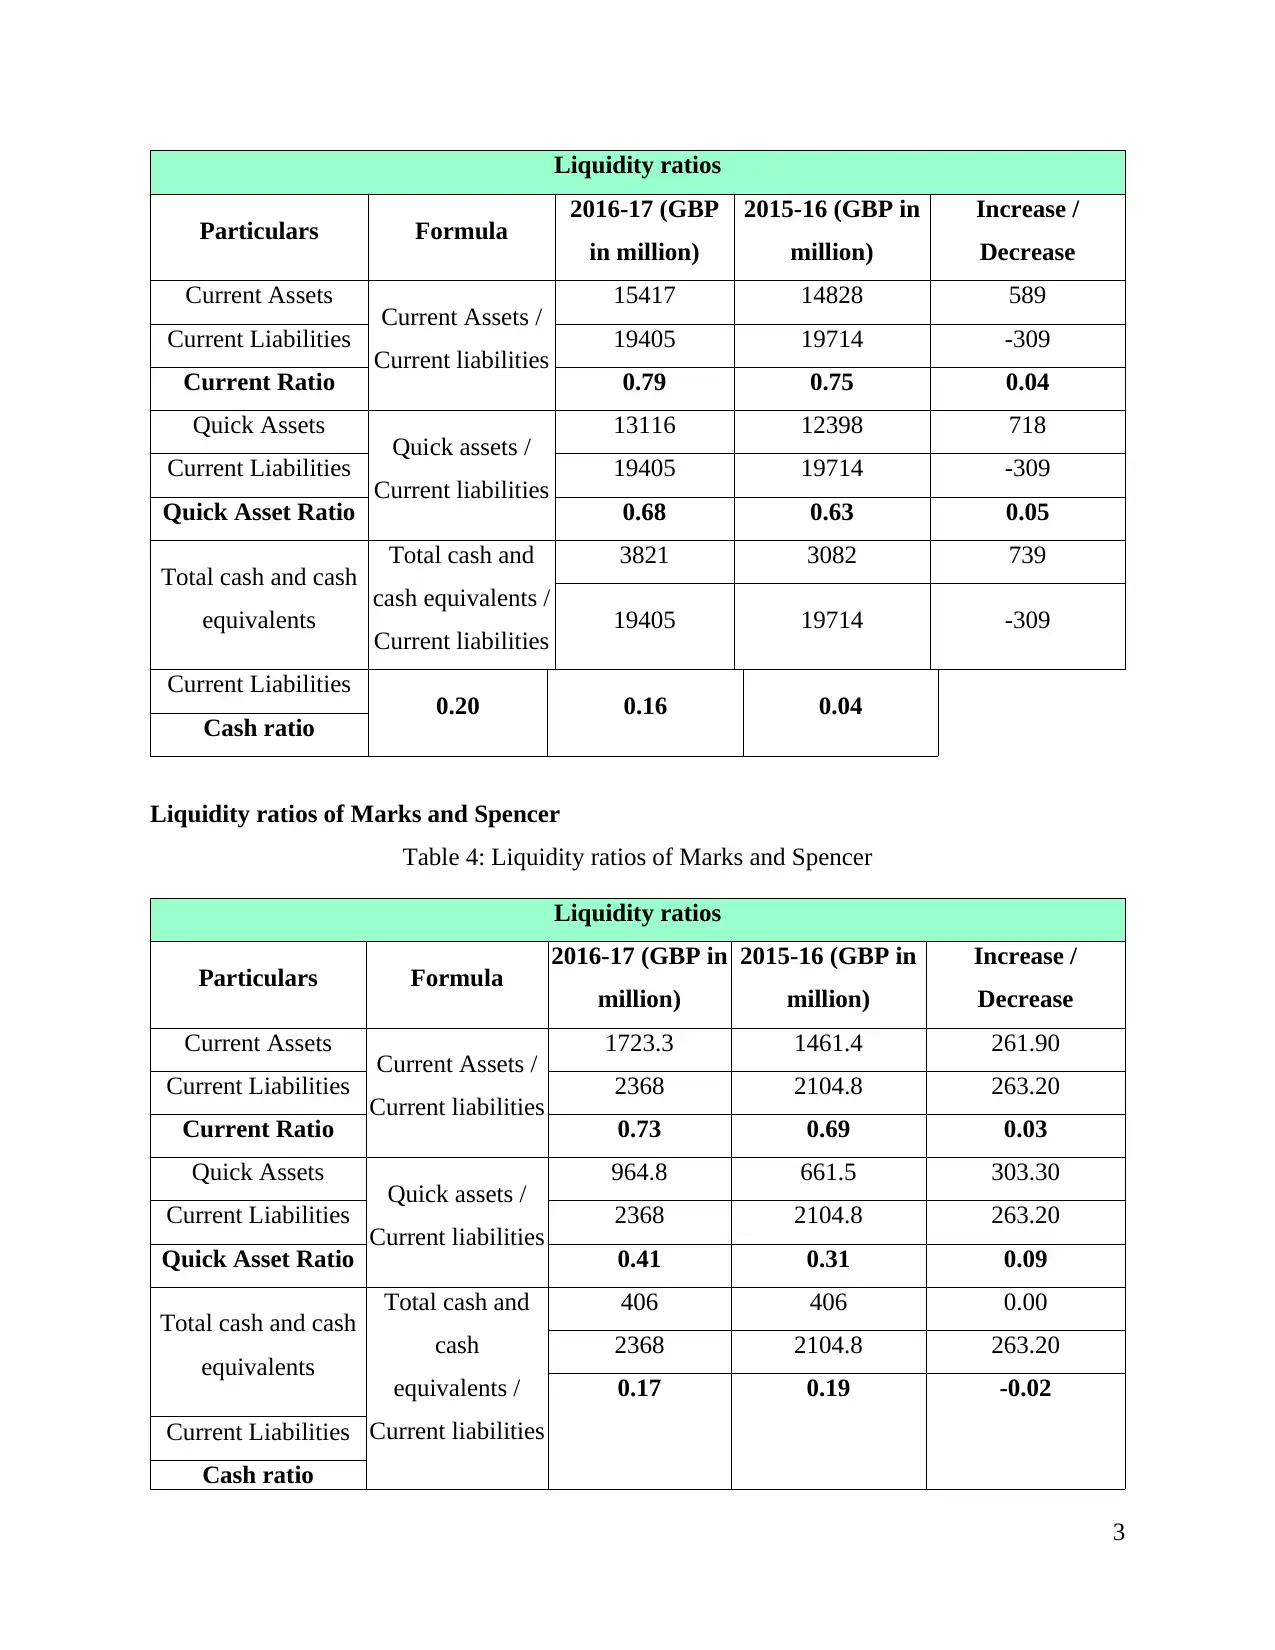
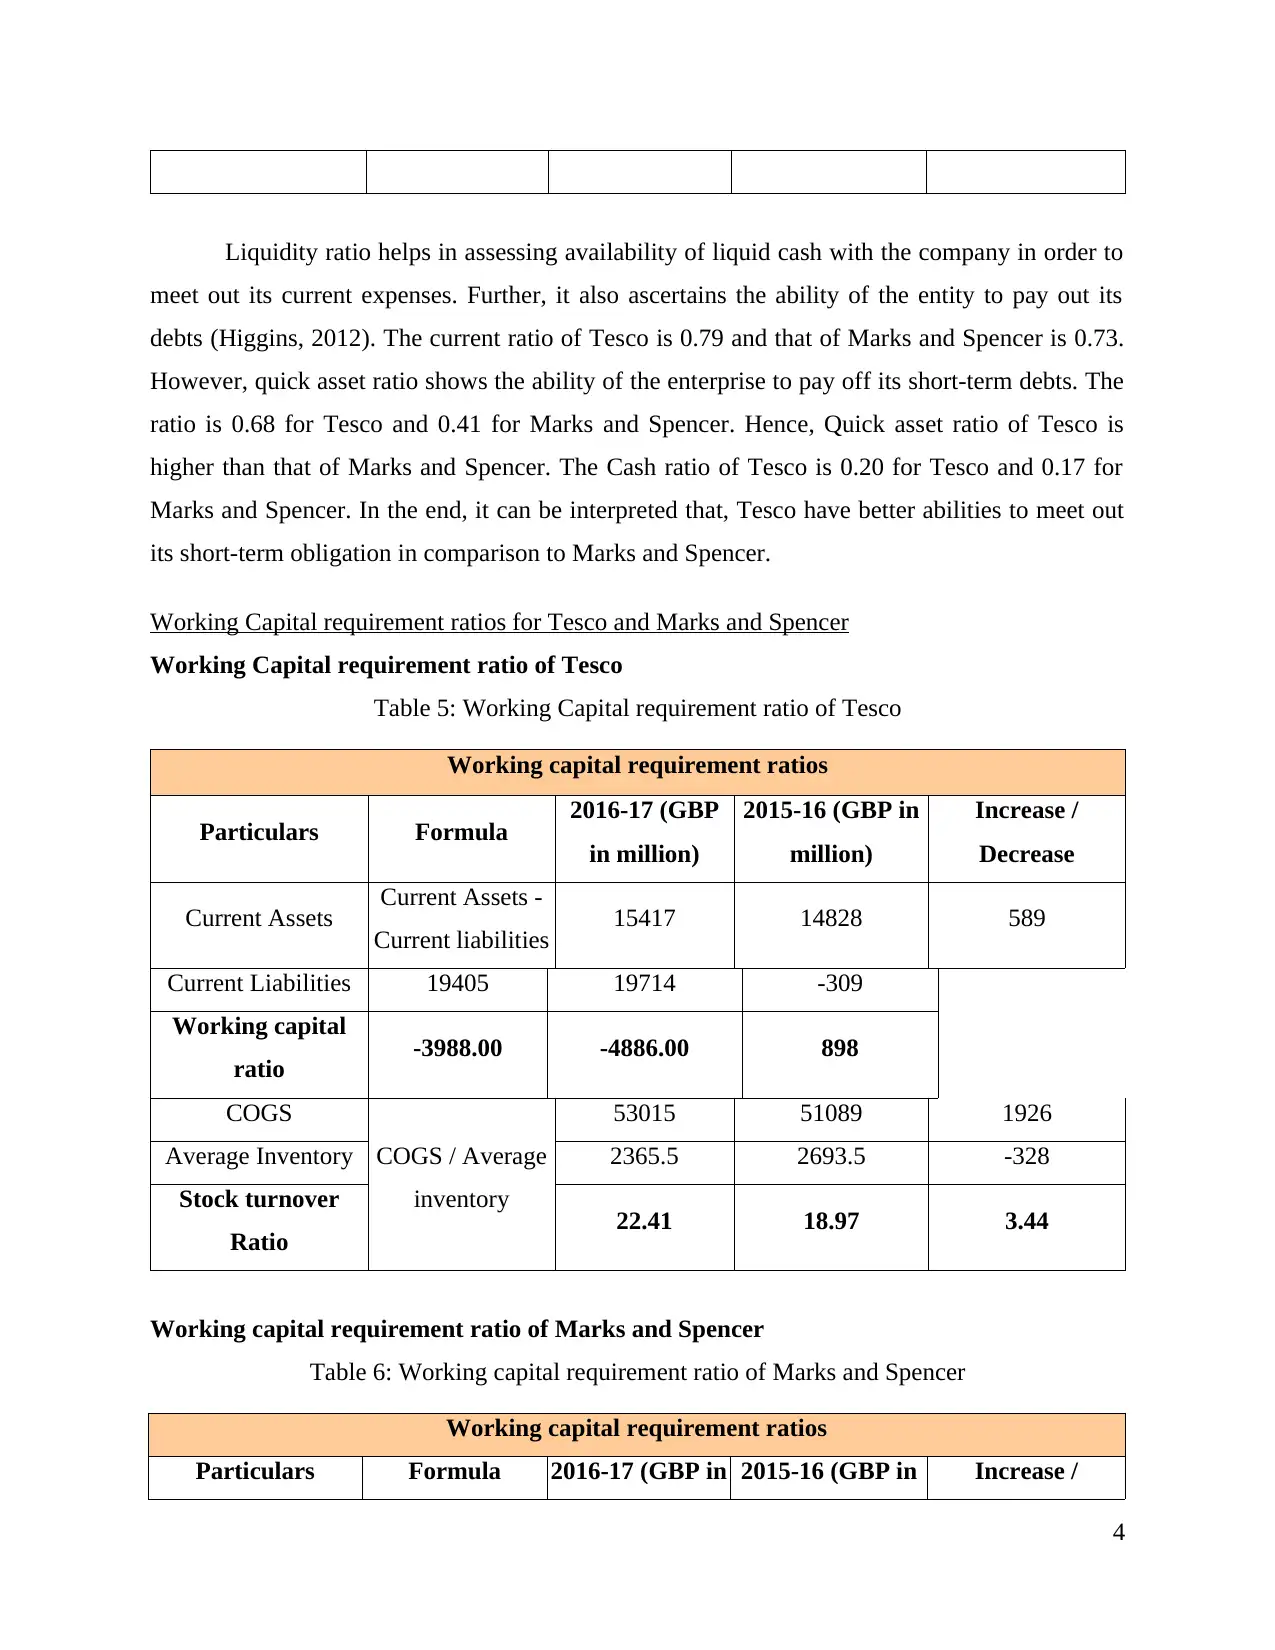
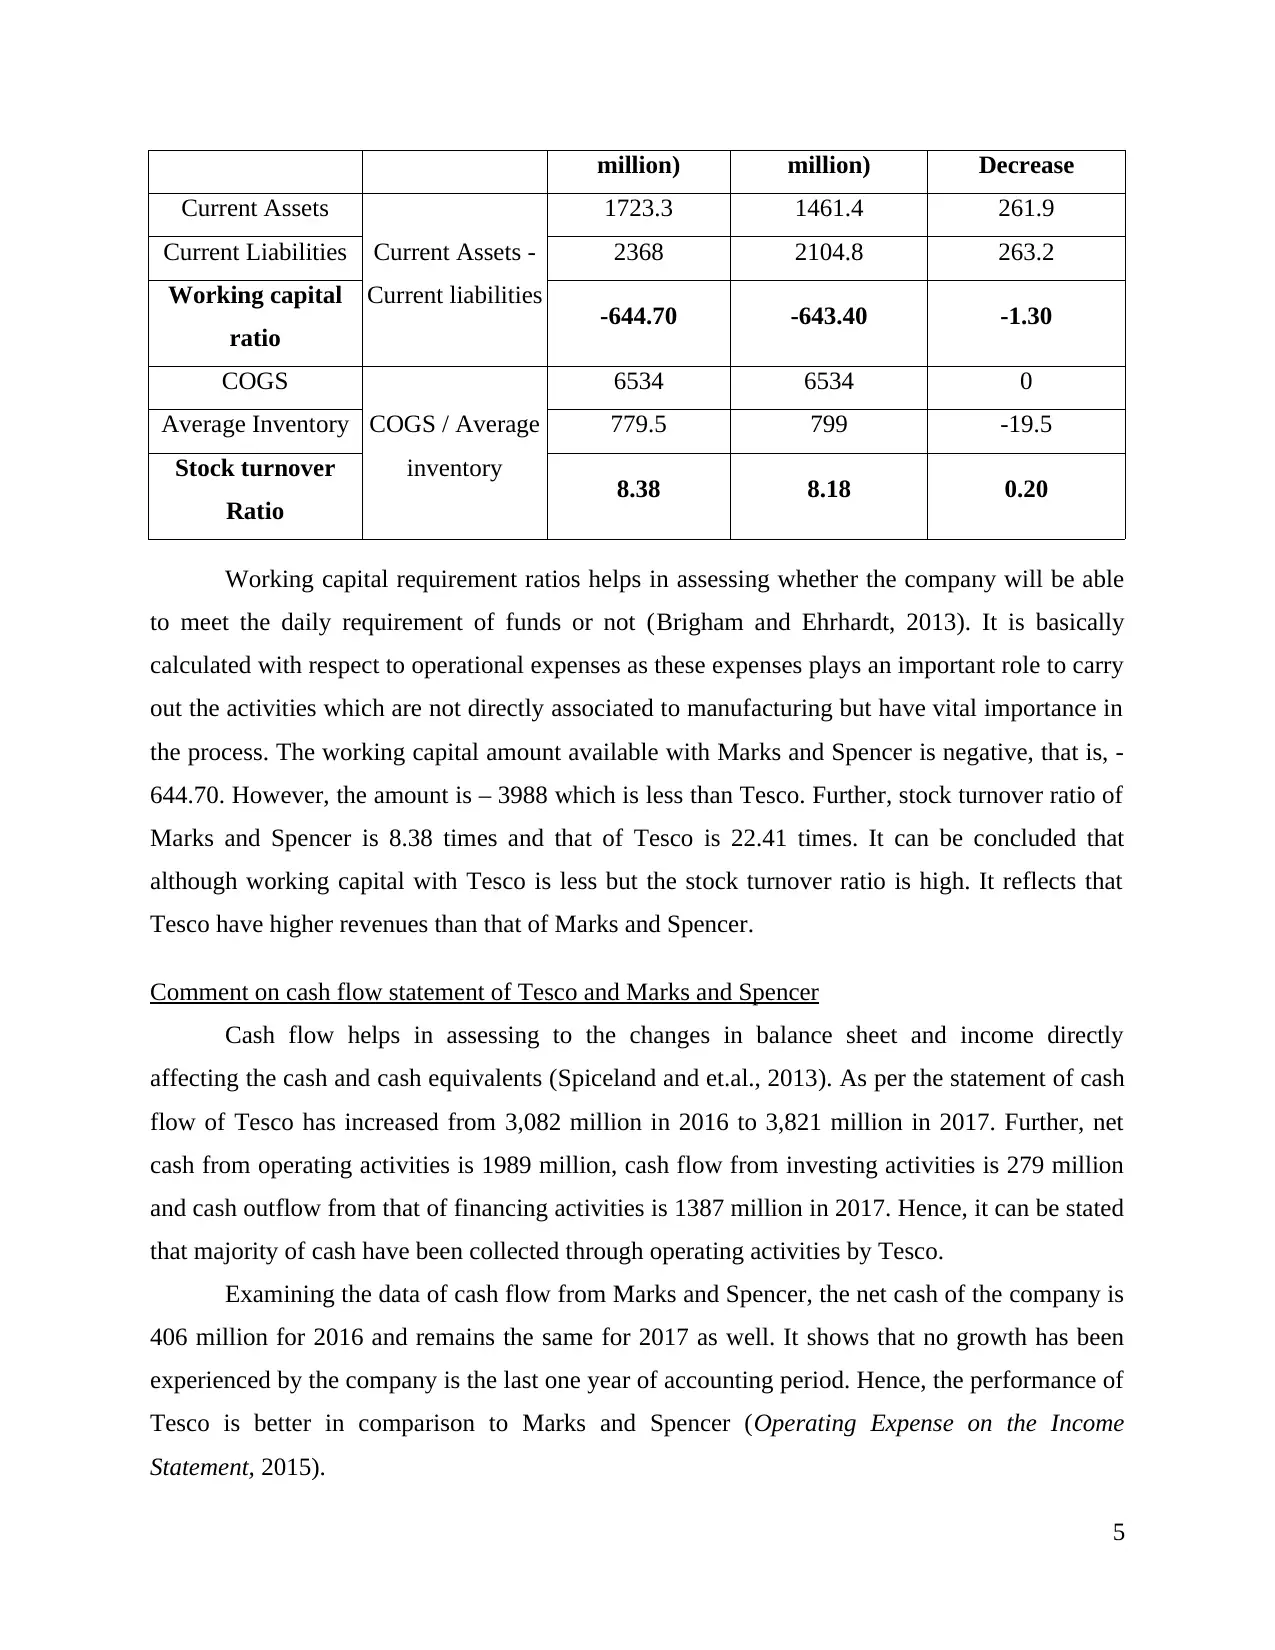
This report presents a comparative financial analysis of Tesco and Marks & Spencer, two major players in the retail sector. It begins with an introduction to ratio analysis, emphasizing its importance in evaluating a company's financial health and performance over time and in comparison to competitors. The core of the report focuses on a detailed examination of key financial ratios for both companies, including profitability ratios (gross margin, operating margin, return on equity), liquidity ratios (current ratio, quick asset ratio, cash ratio), and working capital requirement ratios (working capital ratio, stock turnover ratio). These ratios are calculated and compared for the fiscal years 2016-17 and 2015-16. The analysis also includes a commentary on the cash flow statements of both companies, assessing their ability to generate and manage cash. Based on the findings, the report offers recommendations for improving financial performance, particularly in areas such as liquidity and gross profit margins. The report concludes with a list of references used in the analysis.
1 out of 9
Related Documents


Your All-in-One AI-Powered Toolkit for Academic Success.
+13062052269
info@desklib.com
Available 24*7 on WhatsApp / Email
![[object Object]](/_next/static/media/star-bottom.7253800d.svg)
Copyright © 2020–2025 A2Z Services. All Rights Reserved. Developed and managed by ZUCOL.