Ask a question from expert
Business Research Management Assignment
21 Pages2813 Words195 Views
Added on 2020-07-22
Business Research Management Assignment
Added on 2020-07-22
BookmarkShareRelated Documents
BUSINESS RESEARCHMANAGEMENT

TABLE OF CONTENTINTRODUCTION...........................................................................................................................1PART A...........................................................................................................................................1Age distribution of workforce......................................................................................................12. Proportion of employees in each ethnic group.........................................................................33. Average income.......................................................................................................................44. Impact of working tenure on salary.........................................................................................55. Difference in average salaries across different skill categories...............................................76. Differences in the meeting attends by male and female..........................................................8PART B...........................................................................................................................................9Themes: 1. Critical assessment of living in a joint family...........................................................9Theme: 2. Support of family members to working women.......................................................10CONCLUSION..............................................................................................................................11REFERENCES..............................................................................................................................12
Index of TablesTable 1 Descriptive Statistics of age...............................................................................................1Table 2 Age distribution of the participants....................................................................................1Table 3 Frequency tables of ethnic group........................................................................................3Table 4 Descriptive Statistics of income.........................................................................................4Table 5 Model Summary.................................................................................................................5Table 6 ANOVA statistics measures...............................................................................................5Table 7 Coefficients.........................................................................................................................6Table 8 ANOVA Statistical measures.............................................................................................7Table 9 Descriptive Statistics..........................................................................................................7Table 10 Case Processing Summary................................................................................................8Table 11 Attended meeting * Gender Crosstabulation....................................................................8Table 12 Chi-Square Tests...............................................................................................................8Index of FiguresYFigure 1 Histogram for participant’s age category..........................................................................2Figure 2 Bar graph for different ethnic group of participants.........................................................4Figure 3 Regression plot for income and years worked..................................................................6
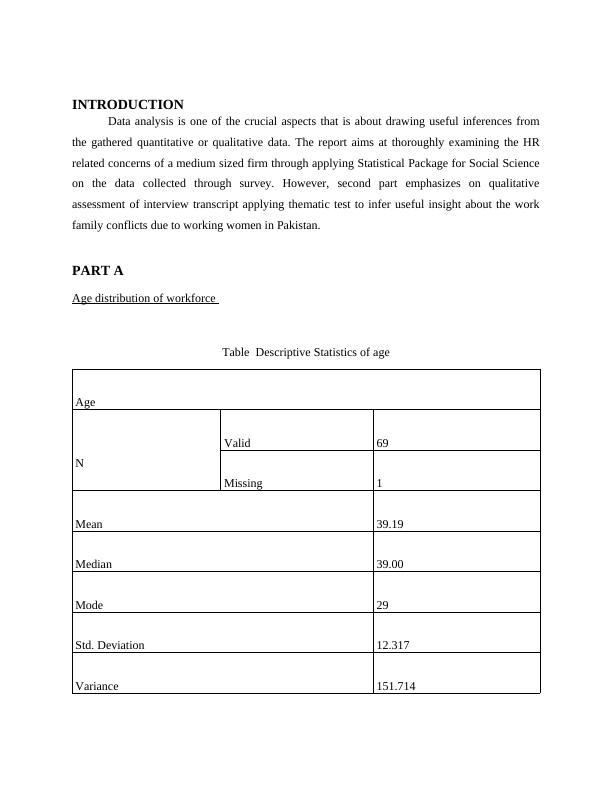
INTRODUCTION Data analysis is one of the crucial aspects that is about drawing useful inferences fromthe gathered quantitative or qualitative data. The report aims at thoroughly examining the HRrelated concerns of a medium sized firm through applying Statistical Package for Social Scienceon the data collected through survey. However, second part emphasizes on qualitativeassessment of interview transcript applying thematic test to infer useful insight about the workfamily conflicts due to working women in Pakistan. PART AAge distribution of workforce Table Descriptive Statistics of ageAgeNValid69Missing1Mean39.19Median39.00Mode29Std. Deviation12.317Variance151.714
Range45Minimum18Maximum63Table Age distribution of the participantsBinFrequency0-10111-20421-301831-401541-501651-601361-703Total70
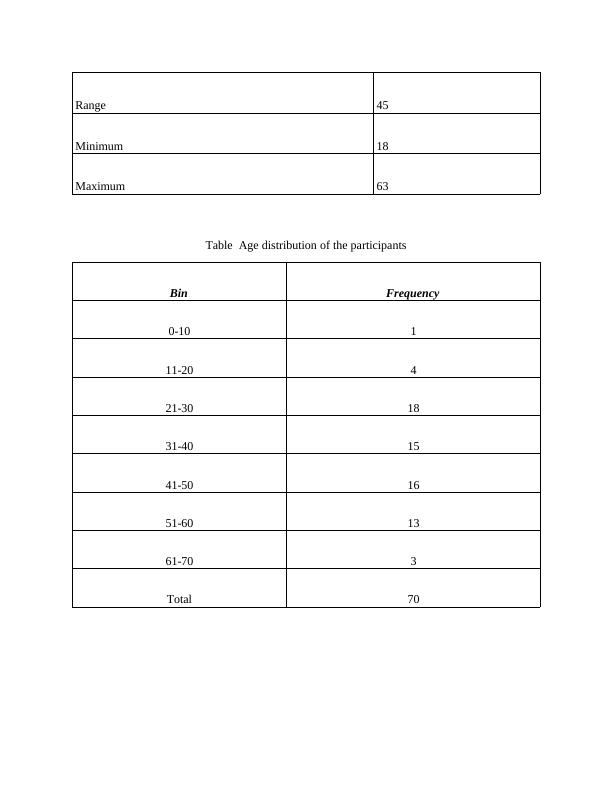
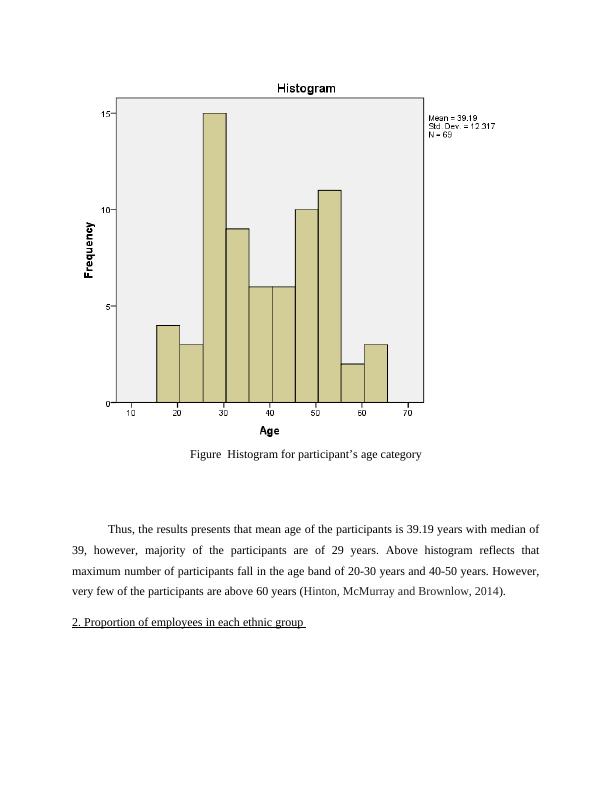
Figure Histogram for participant’s age categoryThus, the results presents that mean age of the participants is 39.19 years with median of39, however, majority of the participants are of 29 years. Above histogram reflects thatmaximum number of participants fall in the age band of 20-30 years and 40-50 years. However,very few of the participants are above 60 years (Hinton, McMurray and Brownlow, 2014). 2. Proportion of employees in each ethnic group
End of preview
Want to access all the pages? Upload your documents or become a member.
Related Documents
Financial Statistics: Relationship Between Variables and Income Levellg...
|16
|2280
|65
Biostatics SPSS Help Assignmentlg...
|7
|1001
|40
Importance of Quality Frequency Percentlg...
|44
|8014
|536
Test for Difference in Mean Aggression, Thrill Seeking, and Risk Acceptinglg...
|19
|3679
|60
Statistic Assignment - Analysis and Interpretationlg...
|9
|924
|192
Applied Business Research: Data Analysis, Descriptive Statistics, and Correlation Matrixlg...
|21
|3914
|42