Business Research Methodology and Data Collection
Added on 2023-01-04
21 Pages2807 Words37 Views
Business Research
Methodology and Data
Collection
1
Methodology and Data
Collection
1

Table of Contents
2. Analyse demographic characteristics of respondents..............................................................3
3. Normality and distribution of data...........................................................................................7
4. Preliminary analysis.................................................................................................................8
5. Hypothesis testing..................................................................................................................10
6. Interpretation findings...........................................................................................................18
REFERENCES..............................................................................................................................21
2
2. Analyse demographic characteristics of respondents
Table 1
EDUCATION
Frequency Percent Valid Percent Cumulative
Percent
Valid
Vocational/High School 18 3.6 3.6 3.6
HND 5 1.0 1.0 4.6
University Degree 319 63.8 63.8 68.4
Post graduate 158 31.6 31.6 100.0
Total 500 100.0 100.0
3
Table 1
EDUCATION
Frequency Percent Valid Percent Cumulative
Percent
Valid
Vocational/High School 18 3.6 3.6 3.6
HND 5 1.0 1.0 4.6
University Degree 319 63.8 63.8 68.4
Post graduate 158 31.6 31.6 100.0
Total 500 100.0 100.0
3
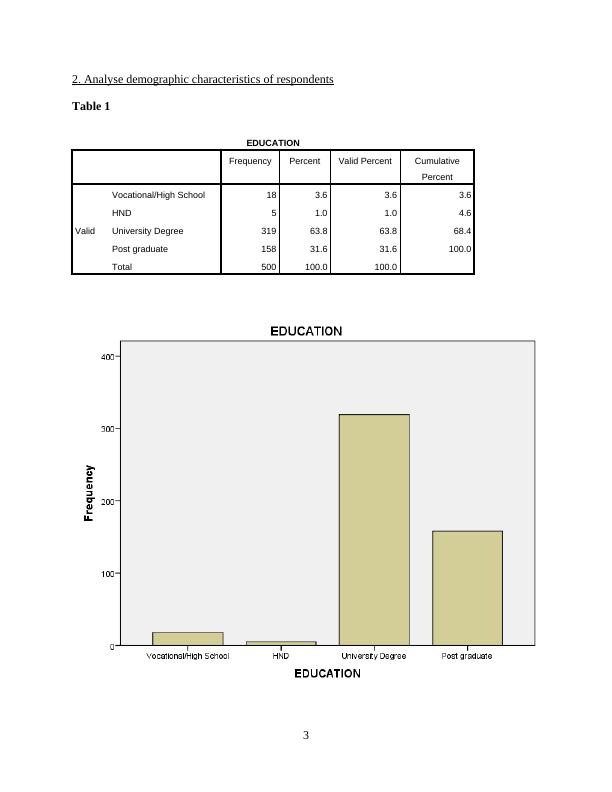
Table 2
GENDER
Frequency Percent Valid Percent Cumulative
Percent
Valid
Male 270 54.0 54.0 54.0
Female 230 46.0 46.0 100.0
Total 500 100.0 100.0
4
GENDER
Frequency Percent Valid Percent Cumulative
Percent
Valid
Male 270 54.0 54.0 54.0
Female 230 46.0 46.0 100.0
Total 500 100.0 100.0
4
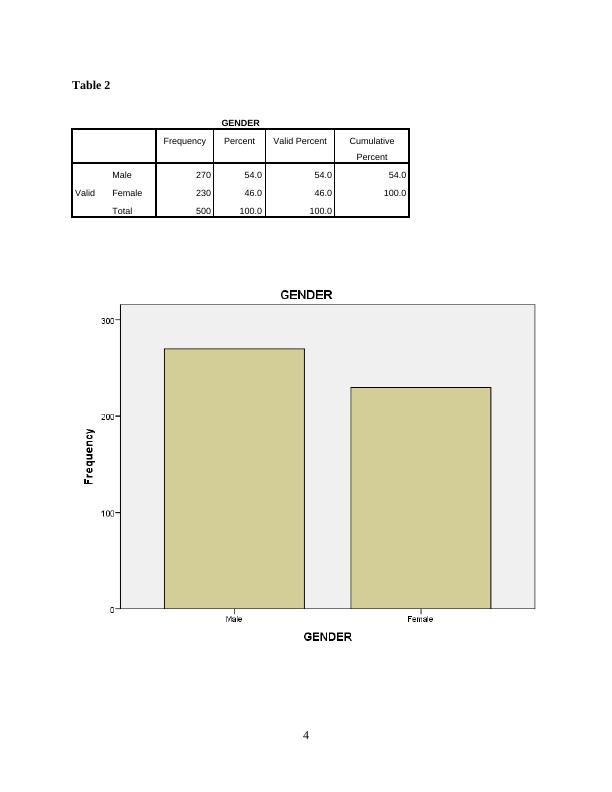
Table 3
AGE
Frequency Percent Valid Percent Cumulative
Percent
Valid
18-27 373 74.6 74.6 74.6
28-37 111 22.2 22.2 96.8
38-47 11 2.2 2.2 99.0
48-57 5 1.0 1.0 100.0
Total 500 100.0 100.0
5
AGE
Frequency Percent Valid Percent Cumulative
Percent
Valid
18-27 373 74.6 74.6 74.6
28-37 111 22.2 22.2 96.8
38-47 11 2.2 2.2 99.0
48-57 5 1.0 1.0 100.0
Total 500 100.0 100.0
5
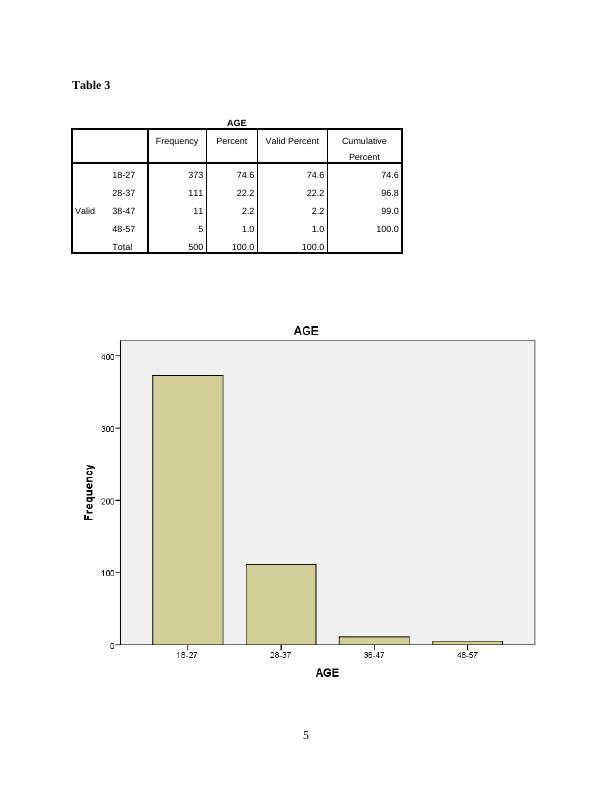
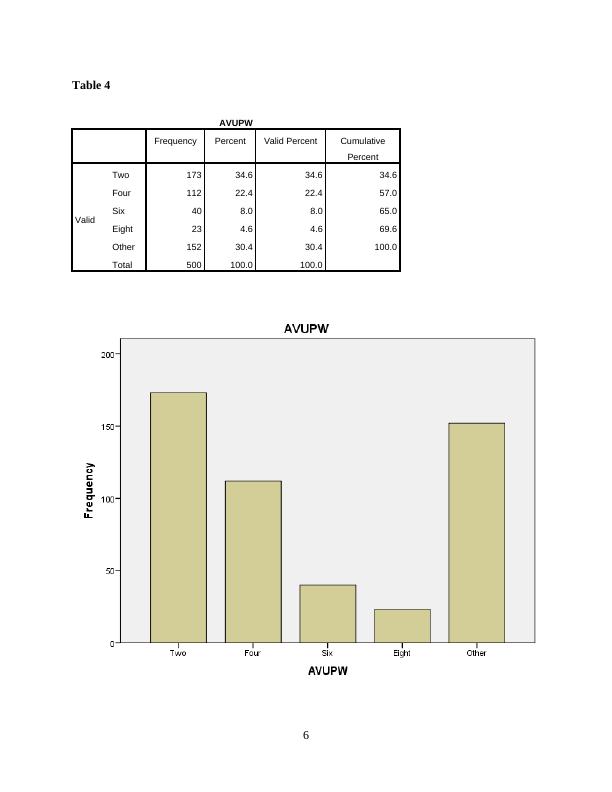
Table 4
AVUPW
Frequency Percent Valid Percent Cumulative
Percent
Valid
Two 173 34.6 34.6 34.6
Four 112 22.4 22.4 57.0
Six 40 8.0 8.0 65.0
Eight 23 4.6 4.6 69.6
Other 152 30.4 30.4 100.0
Total 500 100.0 100.0
6
AVUPW
Frequency Percent Valid Percent Cumulative
Percent
Valid
Two 173 34.6 34.6 34.6
Four 112 22.4 22.4 57.0
Six 40 8.0 8.0 65.0
Eight 23 4.6 4.6 69.6
Other 152 30.4 30.4 100.0
Total 500 100.0 100.0
6
End of preview
Want to access all the pages? Upload your documents or become a member.