Business Statistics Report: Impact of Social Progress Index on SDGs
VerifiedAdded on 2020/12/09
|27
|5365
|203
Report
AI Summary
This business statistics report provides an executive summary of an analysis conducted on data from 182 countries, focusing on the Social Progress Index and its relation to the UN Sustainable Development Goals (SDGs). The report uses randomly selected variables from 12 categories of the index, including deaths from infectious diseases, availability of affordable houses, primary school enrollments, life expectancy, private property rights, and religious tolerance. Employing statistical techniques such as hypothesis testing, correlation, and regression, the analysis investigates the impact of these variables on sustainable development. The findings reveal varying benchmarks across countries for variables like well-being and personal rights, suggesting a need for generalized benchmarks to facilitate easier and more authentic social progress analysis. The report concludes with recommendations to prioritize access to basic knowledge and standardized progress assessment for achieving the UN's sustainable development goals. The report includes descriptive statistics, confidence intervals, and correlation/regression analysis to support its conclusions.
BUSINESS STATISTICS
Paraphrase This Document
Need a fresh take? Get an instant paraphrase of this document with our AI Paraphraser
EXECUTIVE SUMMARY
This report summarises data collected on 50 variables belonging to 182 countries that are
randomly selected from the 12 categories of 2018 Social Progress Index. Based on these data
values, an analysis has been carried out so as to infer statistically what role this index played in
successful fulfilment of UN Sustainable Development Goals to make the world a better place by
2030.
The report randomly selected 5 variables from the 12 categories described in the Index
were Deaths from infectious diseases (Category 1), Availability of Affordable Houses (Category
3), Total Number of Enrolments in Primary School (Category 5), Life Expectancy at 60
(Category 7), Private Property Rights (Category 9) and Religious Tolerance (Category 11). Also,
it employs various techniques such as Hypothesis Testing, Correlation and Regression among
others depending on the nature and size of the variables taken into account. Using these
techniques, Social Progress Index has numerous variables that may impact the sustainable
development of a country domestically as well as Internationally. It was also ascertained through
hypothesis testing that variables such as Well being, Deaths from diseases, Personal Rights and
Access to Basic Knowledge have different benchmarks in different countries. Also, these
variables are either negatively correlated or weak in nature, thus having little or no impact on
each other.
Thus, it is recommended that in order to achieve the goals on Sustainable Development
set by UN, it is important to have access to basic knowledge and ensure that different countries'
progress is generalised on a given benchmark for the same. This will help in an easier analysis of
social progress all around the world and enable much more authenticity as well as relevancy to
the given issue.
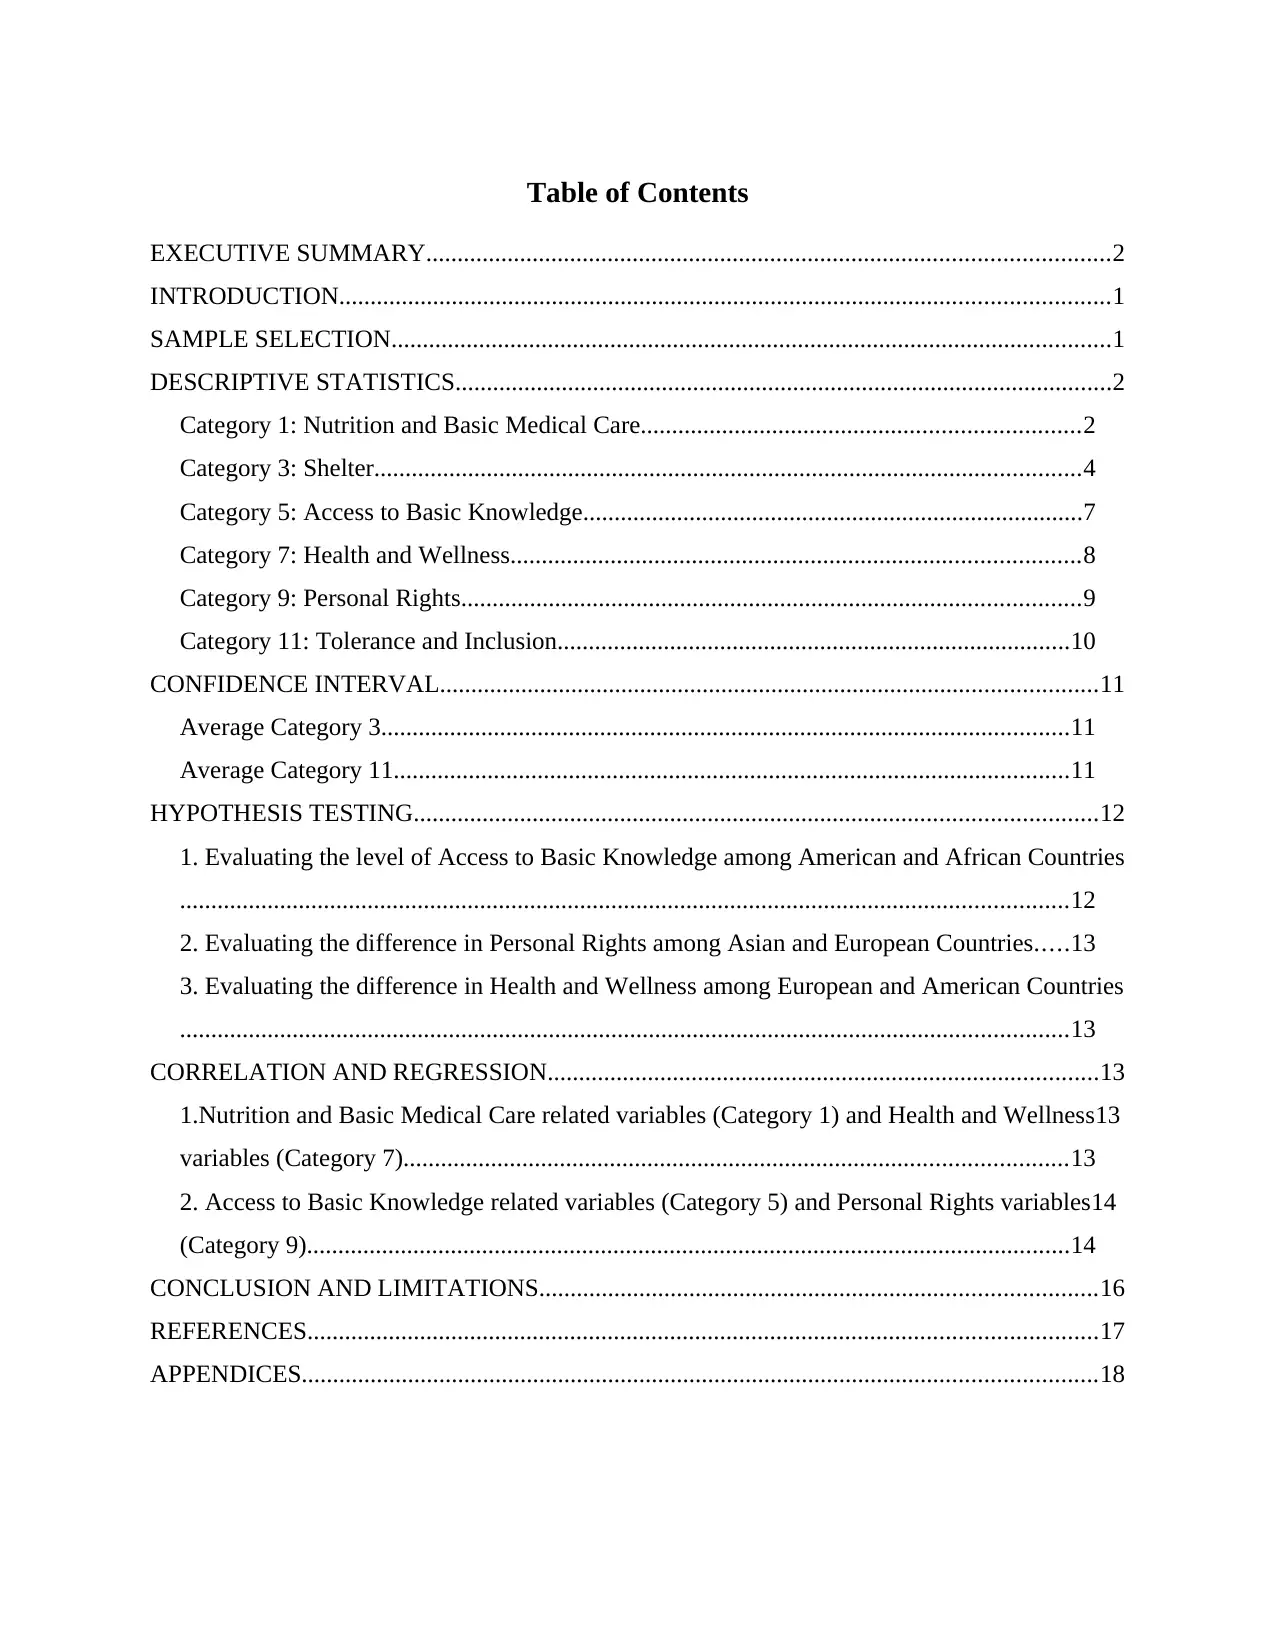
Table of Contents
EXECUTIVE SUMMARY.............................................................................................................2
INTRODUCTION...........................................................................................................................1
SAMPLE SELECTION...................................................................................................................1
DESCRIPTIVE STATISTICS.........................................................................................................2
Category 1: Nutrition and Basic Medical Care......................................................................2
Category 3: Shelter.................................................................................................................4
Category 5: Access to Basic Knowledge................................................................................7
Category 7: Health and Wellness...........................................................................................8
Category 9: Personal Rights...................................................................................................9
Category 11: Tolerance and Inclusion..................................................................................10
CONFIDENCE INTERVAL.........................................................................................................11
Average Category 3..............................................................................................................11
Average Category 11............................................................................................................11
HYPOTHESIS TESTING.............................................................................................................12
1. Evaluating the level of Access to Basic Knowledge among American and African Countries
..............................................................................................................................................12
2. Evaluating the difference in Personal Rights among Asian and European Countries.....13
3. Evaluating the difference in Health and Wellness among European and American Countries
..............................................................................................................................................13
CORRELATION AND REGRESSION........................................................................................13
1.Nutrition and Basic Medical Care related variables (Category 1) and Health and Wellness13
variables (Category 7)..........................................................................................................13
2. Access to Basic Knowledge related variables (Category 5) and Personal Rights variables14
(Category 9)..........................................................................................................................14
CONCLUSION AND LIMITATIONS.........................................................................................16
REFERENCES..............................................................................................................................17
APPENDICES...............................................................................................................................18
⊘ This is a preview!⊘
Do you want full access?
Subscribe today to unlock all pages.
Trusted by 1+ million students worldwide
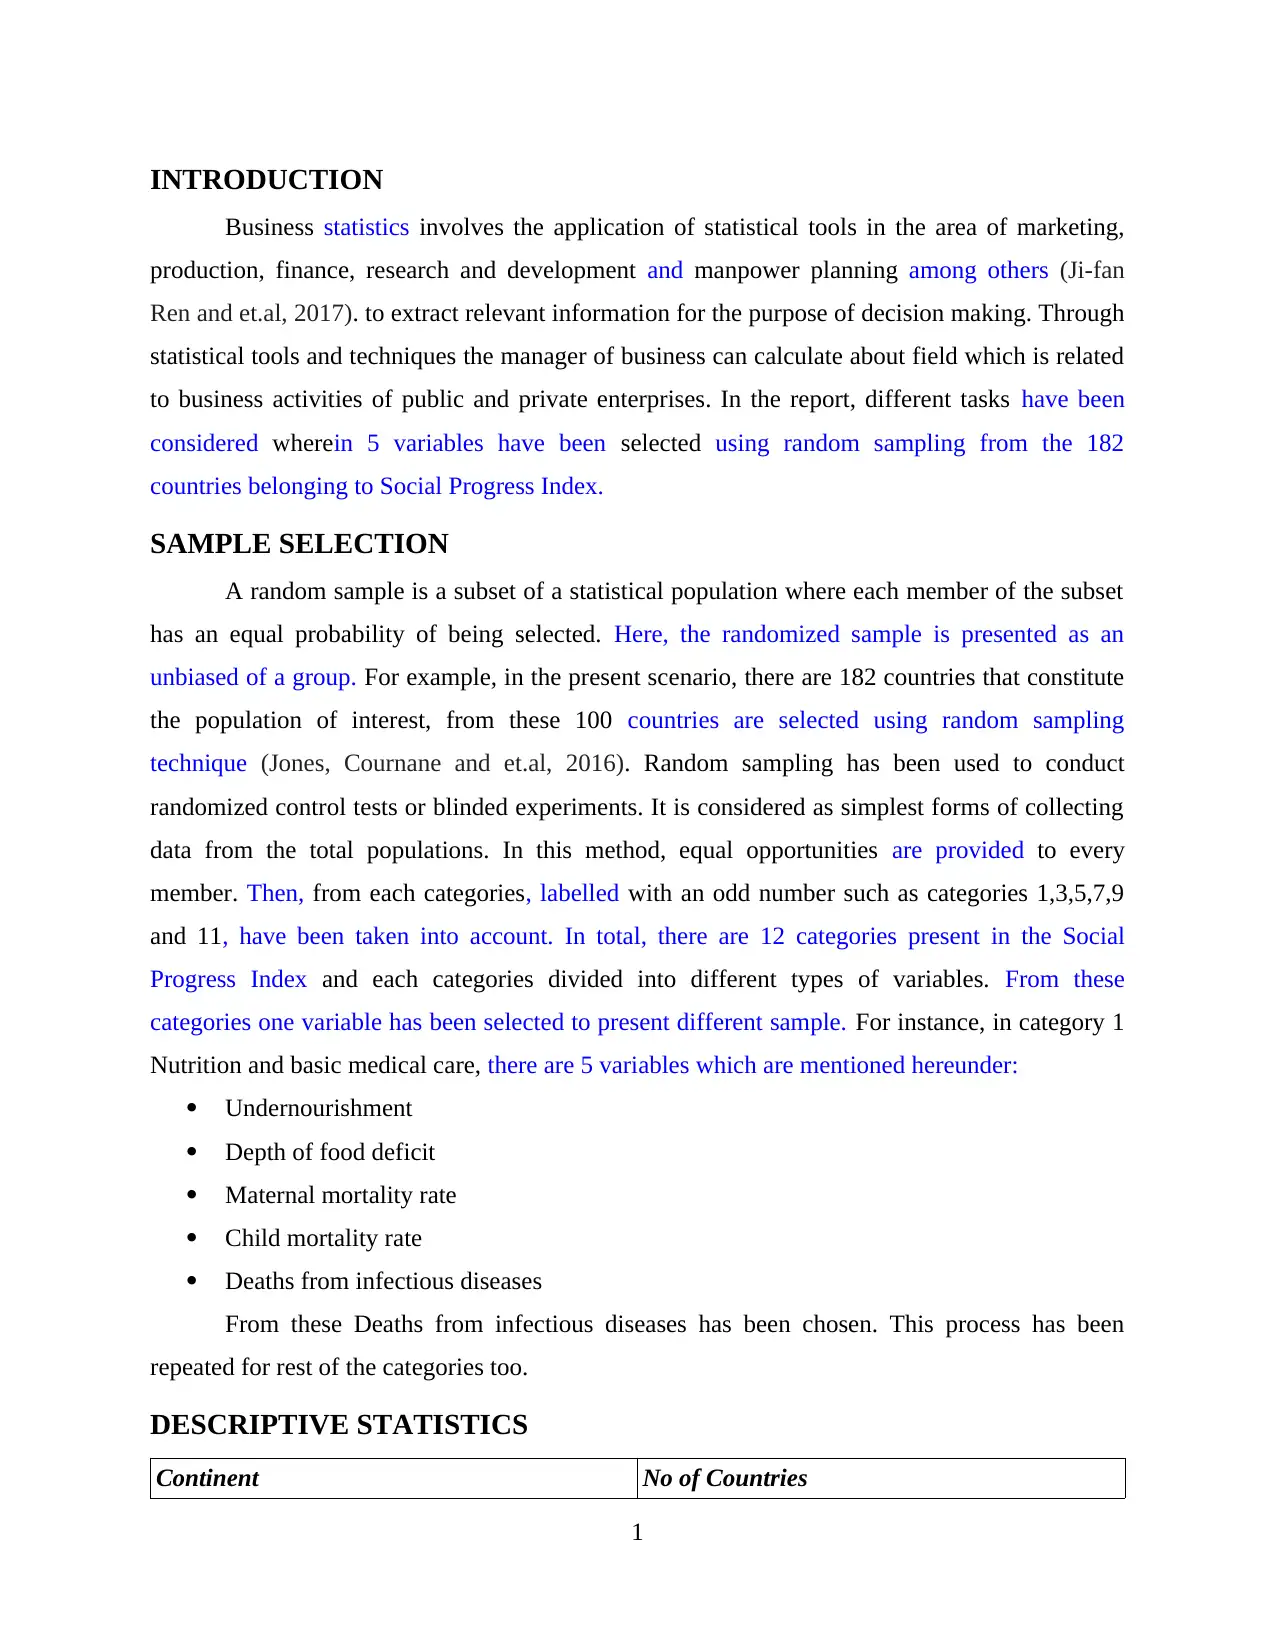
INTRODUCTION
Business statistics involves the application of statistical tools in the area of marketing,
production, finance, research and development and manpower planning among others (Ji-fan
Ren and et.al, 2017). to extract relevant information for the purpose of decision making. Through
statistical tools and techniques the manager of business can calculate about field which is related
to business activities of public and private enterprises. In the report, different tasks have been
considered wherein 5 variables have been selected using random sampling from the 182
countries belonging to Social Progress Index.
SAMPLE SELECTION
A random sample is a subset of a statistical population where each member of the subset
has an equal probability of being selected. Here, the randomized sample is presented as an
unbiased of a group. For example, in the present scenario, there are 182 countries that constitute
the population of interest, from these 100 countries are selected using random sampling
technique (Jones, Cournane and et.al, 2016). Random sampling has been used to conduct
randomized control tests or blinded experiments. It is considered as simplest forms of collecting
data from the total populations. In this method, equal opportunities are provided to every
member. Then, from each categories, labelled with an odd number such as categories 1,3,5,7,9
and 11, have been taken into account. In total, there are 12 categories present in the Social
Progress Index and each categories divided into different types of variables. From these
categories one variable has been selected to present different sample. For instance, in category 1
Nutrition and basic medical care, there are 5 variables which are mentioned hereunder:
Undernourishment
Depth of food deficit
Maternal mortality rate
Child mortality rate
Deaths from infectious diseases
From these Deaths from infectious diseases has been chosen. This process has been
repeated for rest of the categories too.
DESCRIPTIVE STATISTICS
Continent No of Countries
1
Paraphrase This Document
Need a fresh take? Get an instant paraphrase of this document with our AI Paraphraser
AFRICA 14
AMERICA 15
ASIA 15
EUROPE 16
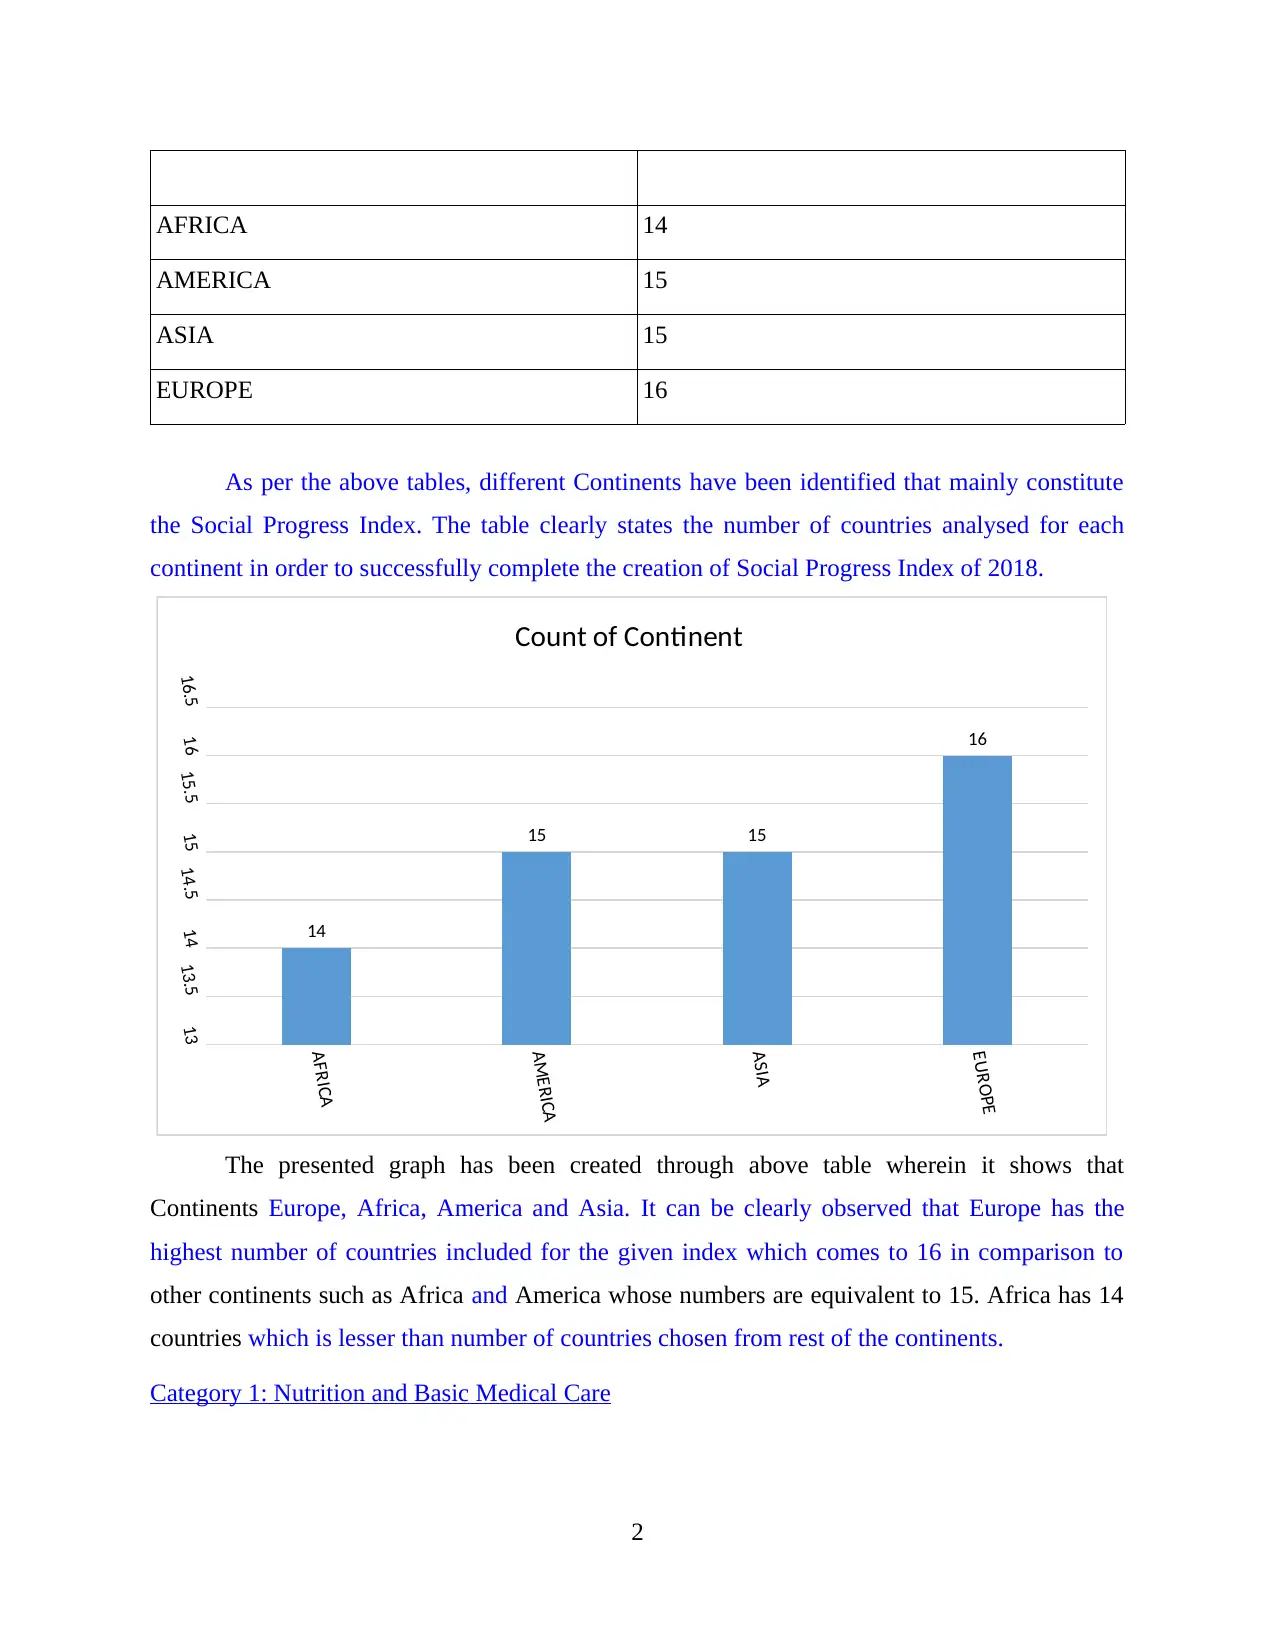
As per the above tables, different Continents have been identified that mainly constitute
the Social Progress Index. The table clearly states the number of countries analysed for each
continent in order to successfully complete the creation of Social Progress Index of 2018.
AFRICA
AMERICA
ASIA
EUROPE
1313.51414.51515.51616.5
14
15 15
16
Count of Continent
The presented graph has been created through above table wherein it shows that
Continents Europe, Africa, America and Asia. It can be clearly observed that Europe has the
highest number of countries included for the given index which comes to 16 in comparison to
other continents such as Africa and America whose numbers are equivalent to 15. Africa has 14
countries which is lesser than number of countries chosen from rest of the continents.
Category 1: Nutrition and Basic Medical Care
2
AMERICA 15
ASIA 15
EUROPE 16
As per the above tables, different Continents have been identified that mainly constitute
the Social Progress Index. The table clearly states the number of countries analysed for each
continent in order to successfully complete the creation of Social Progress Index of 2018.
AFRICA
AMERICA
ASIA
EUROPE
1313.51414.51515.51616.5
14
15 15
16
Count of Continent
The presented graph has been created through above table wherein it shows that
Continents Europe, Africa, America and Asia. It can be clearly observed that Europe has the
highest number of countries included for the given index which comes to 16 in comparison to
other continents such as Africa and America whose numbers are equivalent to 15. Africa has 14
countries which is lesser than number of countries chosen from rest of the continents.
Category 1: Nutrition and Basic Medical Care
2
Continents
Total Number of Deaths from Infectious
Diseases
AFRICA 6185.5561860397
AMERICA 970.6054168193
ASIA 1631.1151300995
EUROPE 327.4231623123
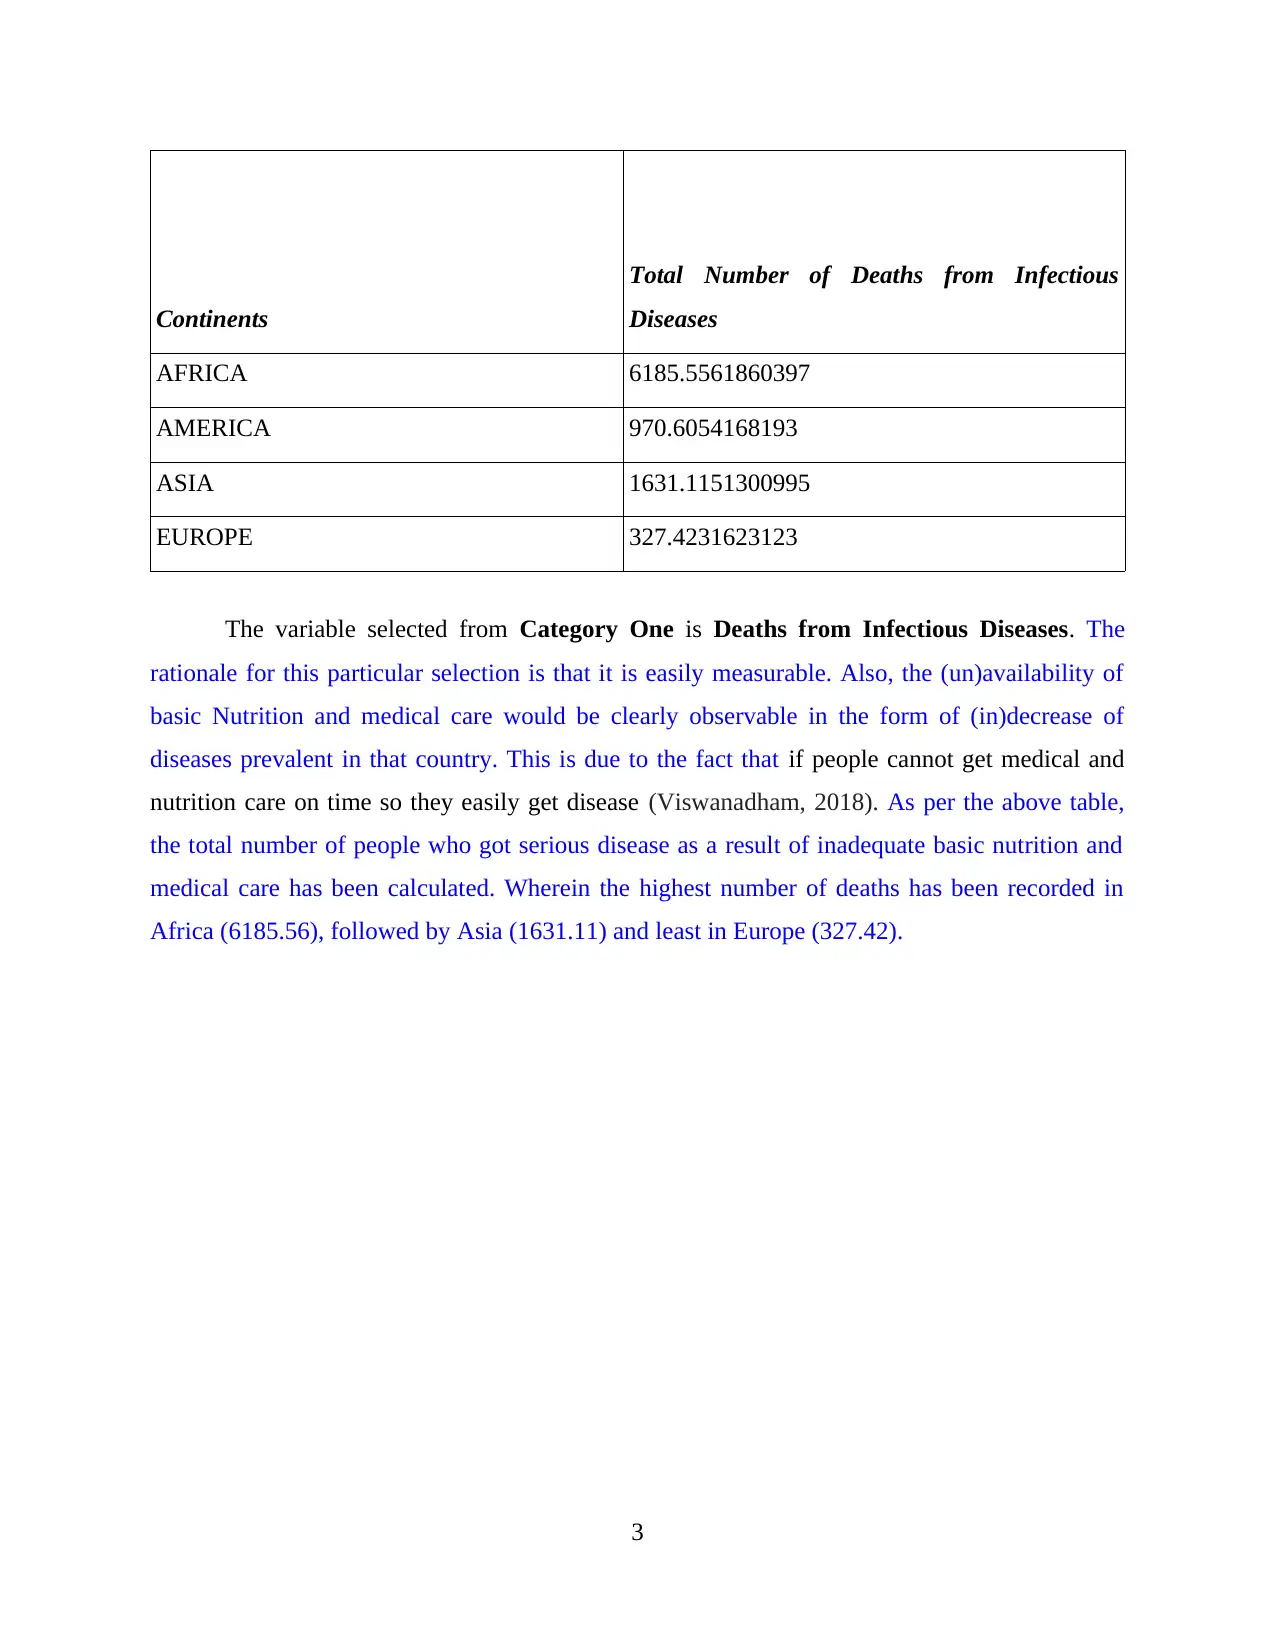
The variable selected from Category One is Deaths from Infectious Diseases. The
rationale for this particular selection is that it is easily measurable. Also, the (un)availability of
basic Nutrition and medical care would be clearly observable in the form of (in)decrease of
diseases prevalent in that country. This is due to the fact that if people cannot get medical and
nutrition care on time so they easily get disease (Viswanadham, 2018). As per the above table,
the total number of people who got serious disease as a result of inadequate basic nutrition and
medical care has been calculated. Wherein the highest number of deaths has been recorded in
Africa (6185.56), followed by Asia (1631.11) and least in Europe (327.42).
3
Total Number of Deaths from Infectious
Diseases
AFRICA 6185.5561860397
AMERICA 970.6054168193
ASIA 1631.1151300995
EUROPE 327.4231623123
The variable selected from Category One is Deaths from Infectious Diseases. The
rationale for this particular selection is that it is easily measurable. Also, the (un)availability of
basic Nutrition and medical care would be clearly observable in the form of (in)decrease of
diseases prevalent in that country. This is due to the fact that if people cannot get medical and
nutrition care on time so they easily get disease (Viswanadham, 2018). As per the above table,
the total number of people who got serious disease as a result of inadequate basic nutrition and
medical care has been calculated. Wherein the highest number of deaths has been recorded in
Africa (6185.56), followed by Asia (1631.11) and least in Europe (327.42).
3
⊘ This is a preview!⊘
Do you want full access?
Subscribe today to unlock all pages.
Trusted by 1+ million students worldwide
AFRICA AMERICA ASIA EUROPE
0
1000
2000
3000
4000
5000
6000
7000
6185.56
970.61
1631.12
327.42
Total Number of Deaths from
Infectious Diseases
Continents
Number of Deaths
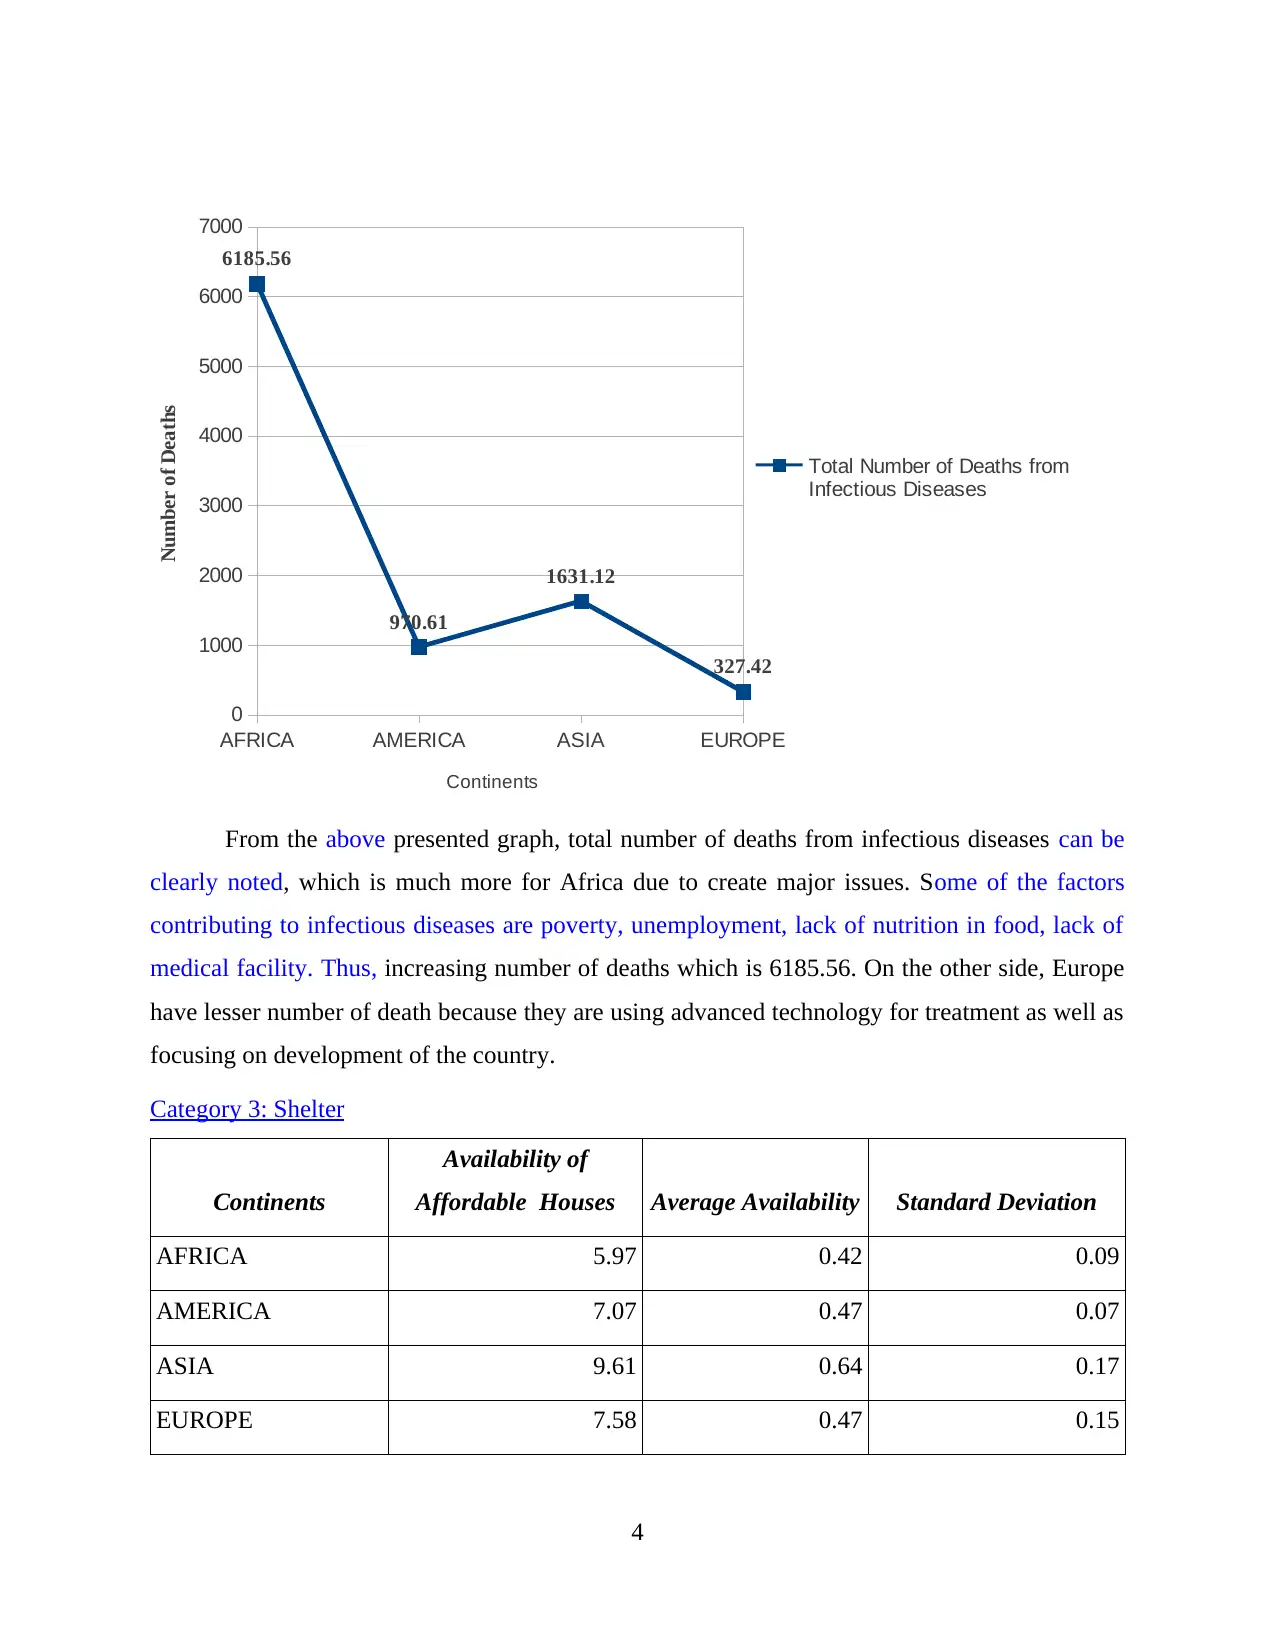
From the above presented graph, total number of deaths from infectious diseases can be
clearly noted, which is much more for Africa due to create major issues. Some of the factors
contributing to infectious diseases are poverty, unemployment, lack of nutrition in food, lack of
medical facility. Thus, increasing number of deaths which is 6185.56. On the other side, Europe
have lesser number of death because they are using advanced technology for treatment as well as
focusing on development of the country.
Category 3: Shelter
Continents
Availability of
Affordable Houses Average Availability Standard Deviation
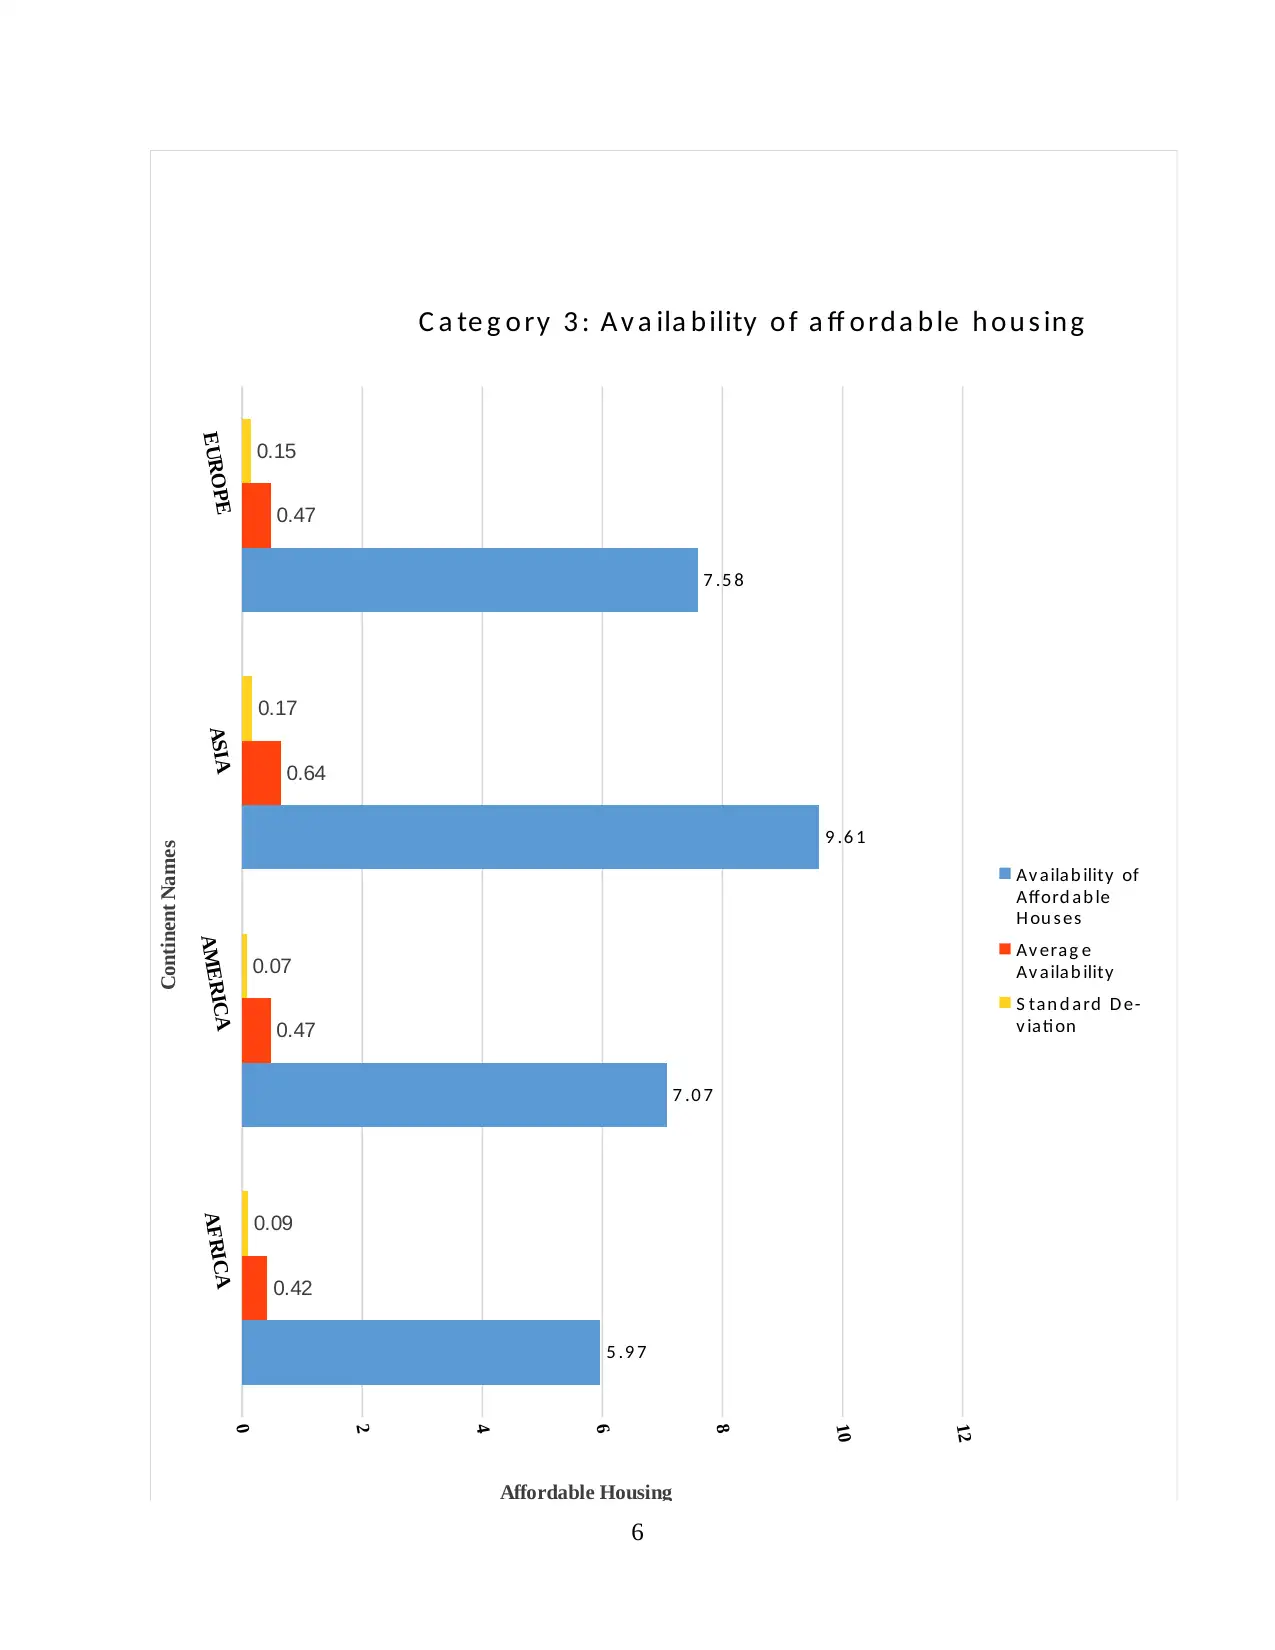
AFRICA 5.97 0.42 0.09
AMERICA 7.07 0.47 0.07
ASIA 9.61 0.64 0.17
EUROPE 7.58 0.47 0.15
4
0
1000
2000
3000
4000
5000
6000
7000
6185.56
970.61
1631.12
327.42
Total Number of Deaths from
Infectious Diseases
Continents
Number of Deaths
From the above presented graph, total number of deaths from infectious diseases can be
clearly noted, which is much more for Africa due to create major issues. Some of the factors
contributing to infectious diseases are poverty, unemployment, lack of nutrition in food, lack of
medical facility. Thus, increasing number of deaths which is 6185.56. On the other side, Europe
have lesser number of death because they are using advanced technology for treatment as well as
focusing on development of the country.
Category 3: Shelter
Continents
Availability of
Affordable Houses Average Availability Standard Deviation
AFRICA 5.97 0.42 0.09
AMERICA 7.07 0.47 0.07
ASIA 9.61 0.64 0.17
EUROPE 7.58 0.47 0.15
4
Paraphrase This Document
Need a fresh take? Get an instant paraphrase of this document with our AI Paraphraser
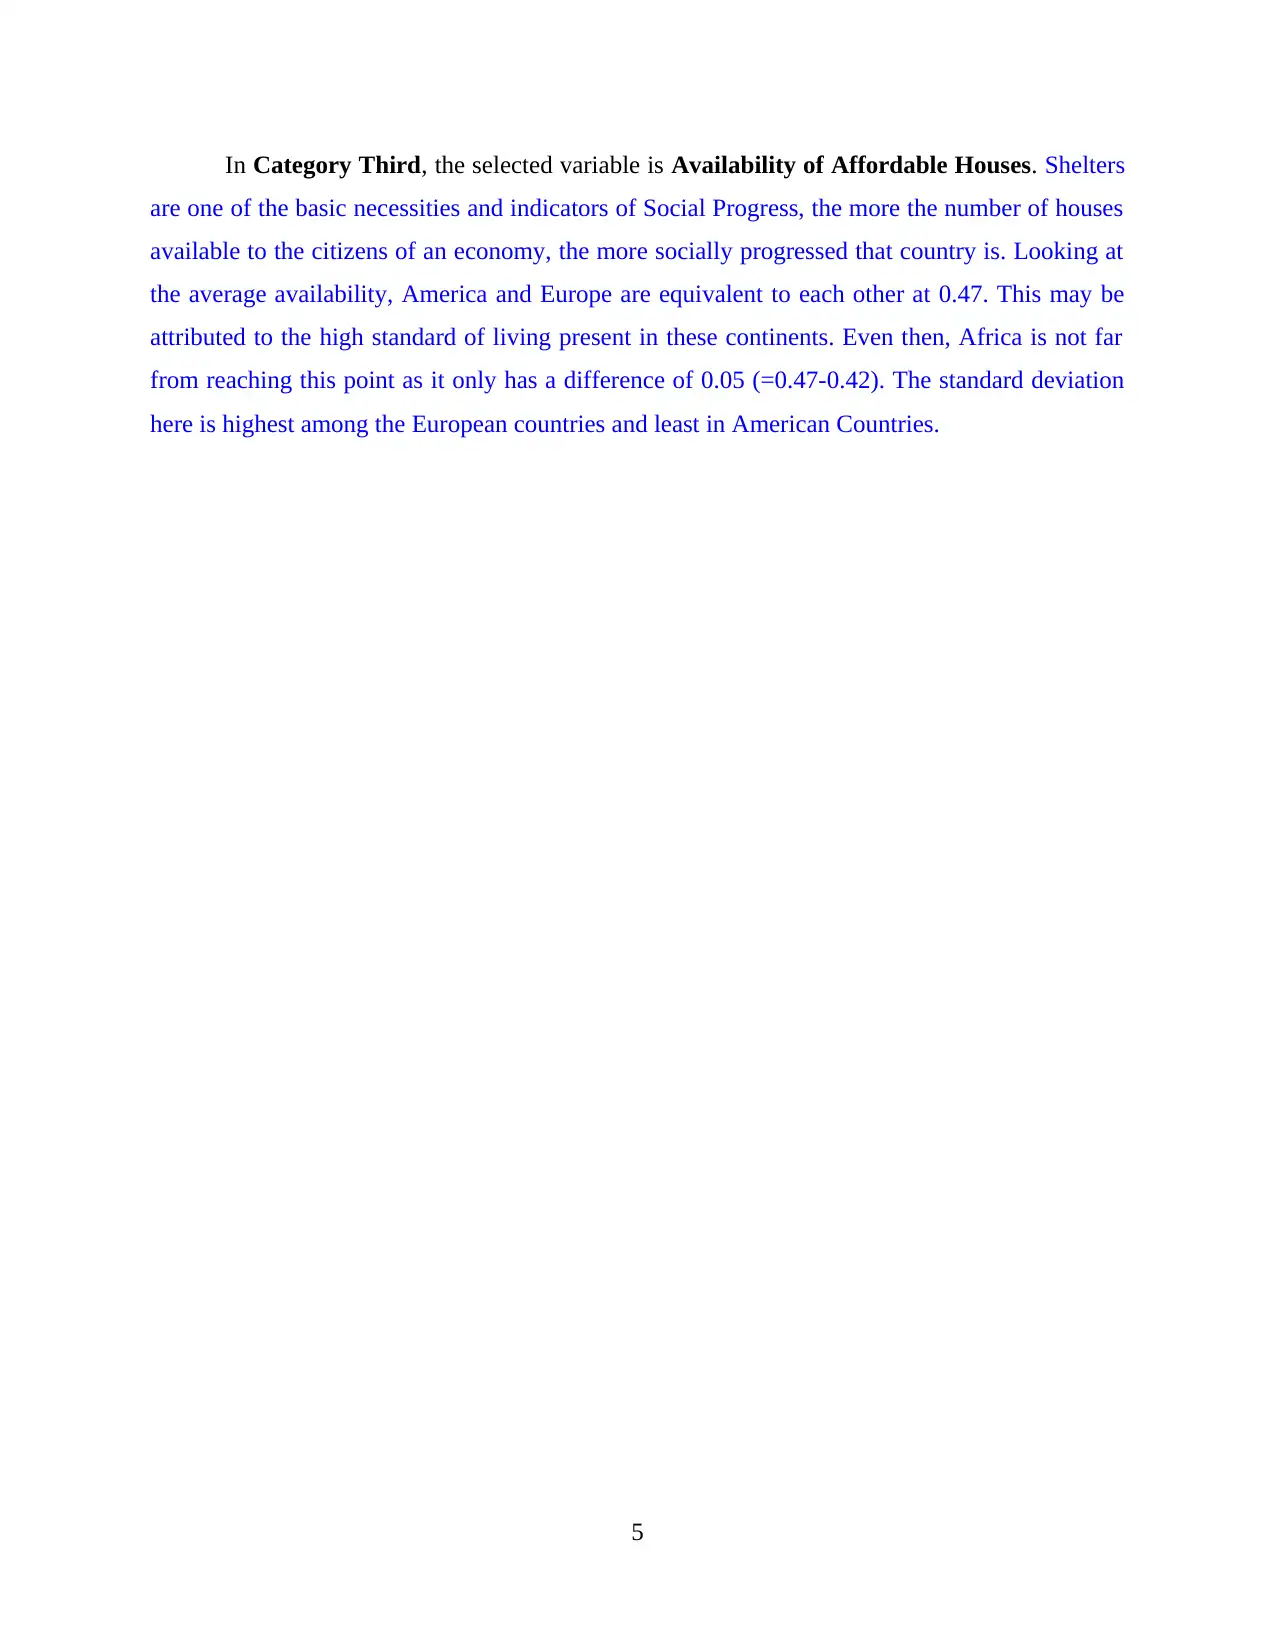
In Category Third, the selected variable is Availability of Affordable Houses. Shelters
are one of the basic necessities and indicators of Social Progress, the more the number of houses
available to the citizens of an economy, the more socially progressed that country is. Looking at
the average availability, America and Europe are equivalent to each other at 0.47. This may be
attributed to the high standard of living present in these continents. Even then, Africa is not far
from reaching this point as it only has a difference of 0.05 (=0.47-0.42). The standard deviation
here is highest among the European countries and least in American Countries.
5
AFRICA
AMERICA
ASIA
EUROPE
0
2
4
6
8
10
12
5 .9 7
7 .0 7
9 .6 1
7 .5 8
0.42
0.47
0.64
0.47
0.09
0.07
0.17
0.15
C a te g o ry 3 : A v a ila b ility o f a ff o rd a b le h o u s in g
Av aila b ility of
Afford a b le
H ou s es
Av erag e
Av aila b ility
S tan d a rd D e-
v iati on
Affordable Housing
Continent Names
6
⊘ This is a preview!⊘
Do you want full access?
Subscribe today to unlock all pages.
Trusted by 1+ million students worldwide
As per the presented chart above, blue colour shows 'Availability of affordable houses',
orange plot shows 'average availability' and yellow plot shows 'standard deviation'. The chart
presented four continents detailed data regarding to affordable housing. Analysing the chart, it is
ascertained that Asia has much more affordable housing compared to other continents. This is
because Asia has much more population which demands a proper allocation of affordable
housing facilities among such masses. In Africa there is less affordable housing due to low
population and desert (Kiedrowicz and Koszela, 2016).
Category 5: Access to Basic Knowledge
Continents
Total Number of
Enrolments in Primary
School
Primary School
Enrolment
(Maximum)
Minimum
Enrolments Ranges
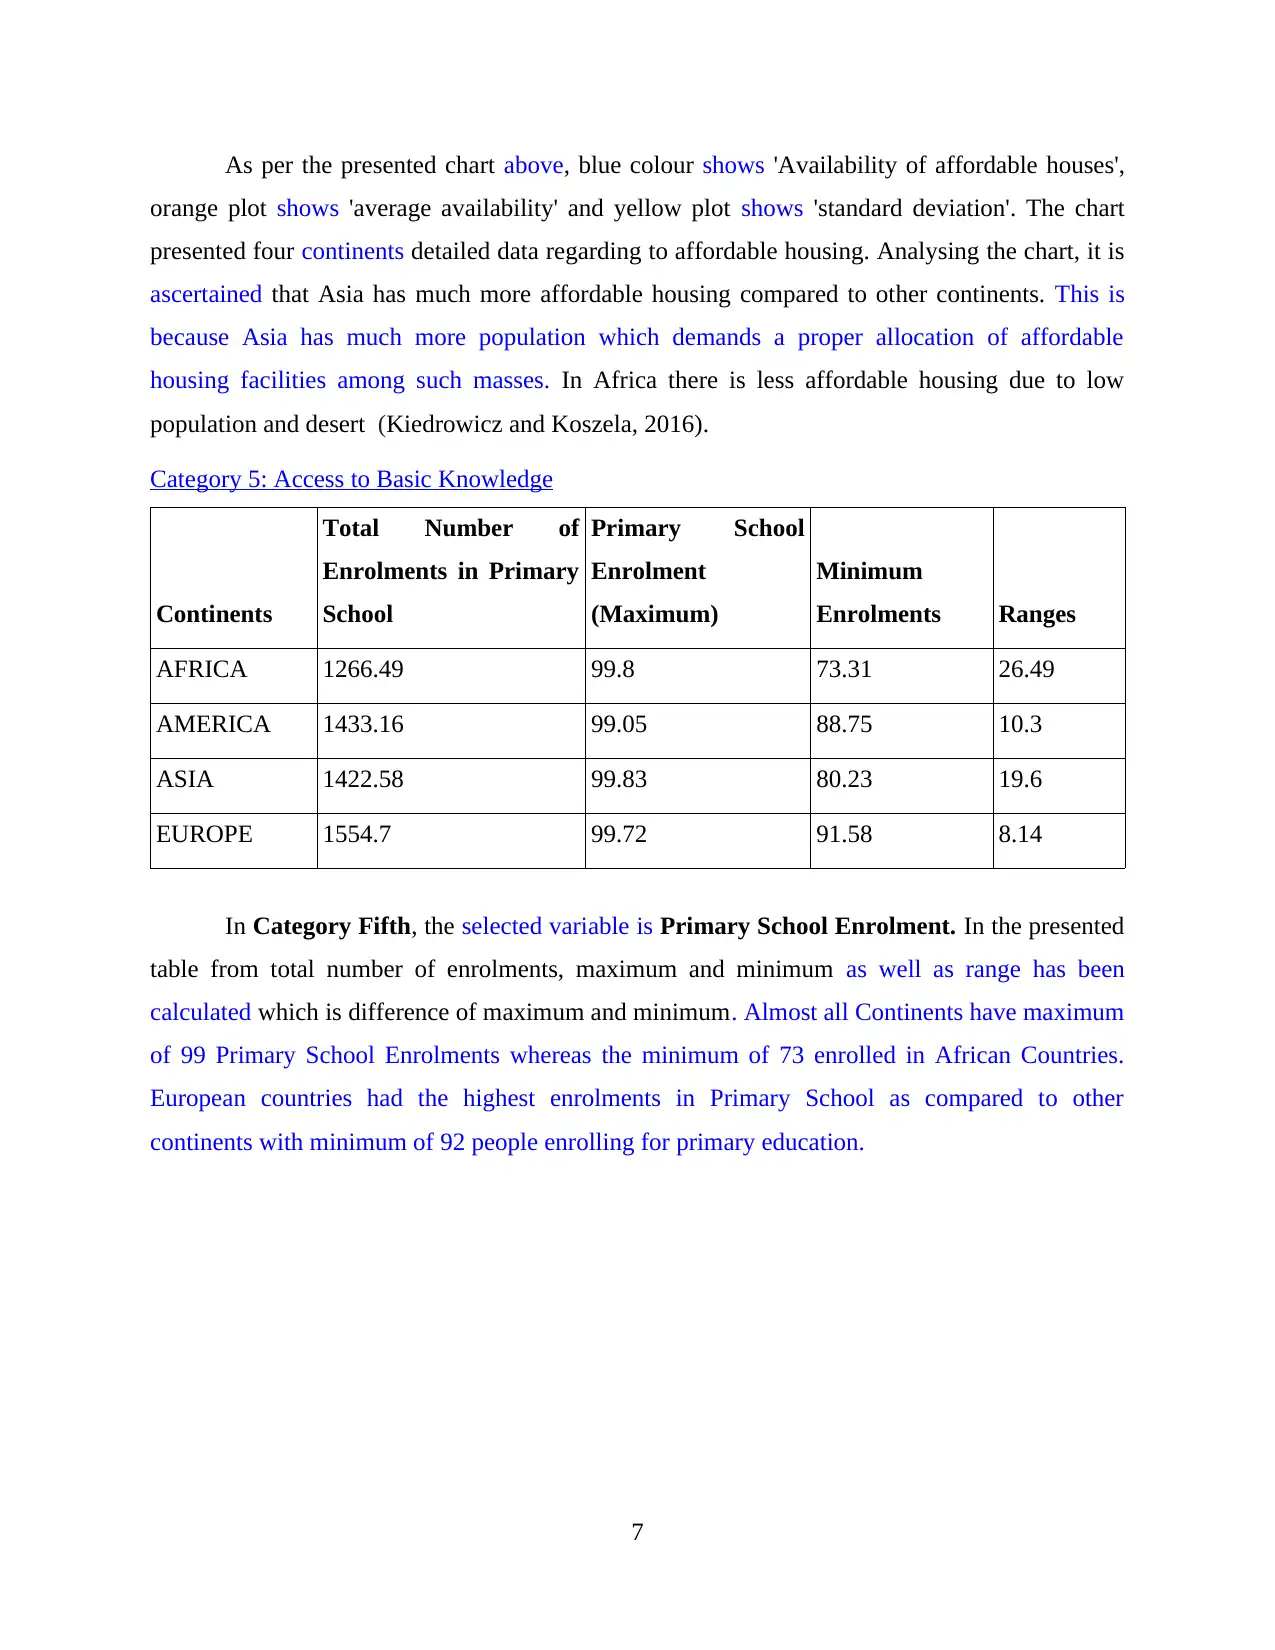
AFRICA 1266.49 99.8 73.31 26.49
AMERICA 1433.16 99.05 88.75 10.3
ASIA 1422.58 99.83 80.23 19.6
EUROPE 1554.7 99.72 91.58 8.14
In Category Fifth, the selected variable is Primary School Enrolment. In the presented
table from total number of enrolments, maximum and minimum as well as range has been
calculated which is difference of maximum and minimum. Almost all Continents have maximum
of 99 Primary School Enrolments whereas the minimum of 73 enrolled in African Countries.
European countries had the highest enrolments in Primary School as compared to other
continents with minimum of 92 people enrolling for primary education.
7
orange plot shows 'average availability' and yellow plot shows 'standard deviation'. The chart
presented four continents detailed data regarding to affordable housing. Analysing the chart, it is
ascertained that Asia has much more affordable housing compared to other continents. This is
because Asia has much more population which demands a proper allocation of affordable
housing facilities among such masses. In Africa there is less affordable housing due to low
population and desert (Kiedrowicz and Koszela, 2016).
Category 5: Access to Basic Knowledge
Continents
Total Number of
Enrolments in Primary
School
Primary School
Enrolment
(Maximum)
Minimum
Enrolments Ranges
AFRICA 1266.49 99.8 73.31 26.49
AMERICA 1433.16 99.05 88.75 10.3
ASIA 1422.58 99.83 80.23 19.6
EUROPE 1554.7 99.72 91.58 8.14
In Category Fifth, the selected variable is Primary School Enrolment. In the presented
table from total number of enrolments, maximum and minimum as well as range has been
calculated which is difference of maximum and minimum. Almost all Continents have maximum
of 99 Primary School Enrolments whereas the minimum of 73 enrolled in African Countries.
European countries had the highest enrolments in Primary School as compared to other
continents with minimum of 92 people enrolling for primary education.
7
Paraphrase This Document
Need a fresh take? Get an instant paraphrase of this document with our AI Paraphraser
AFRICA
AMERICA
ASIA
EUROPE
0 500 1000 1500 2000
Ranges
Minimum Enrollments
Primary School Enrollment
(Maximum)
Total Number of Enrollments in
Primary School
Continents
Primary School Enrollments
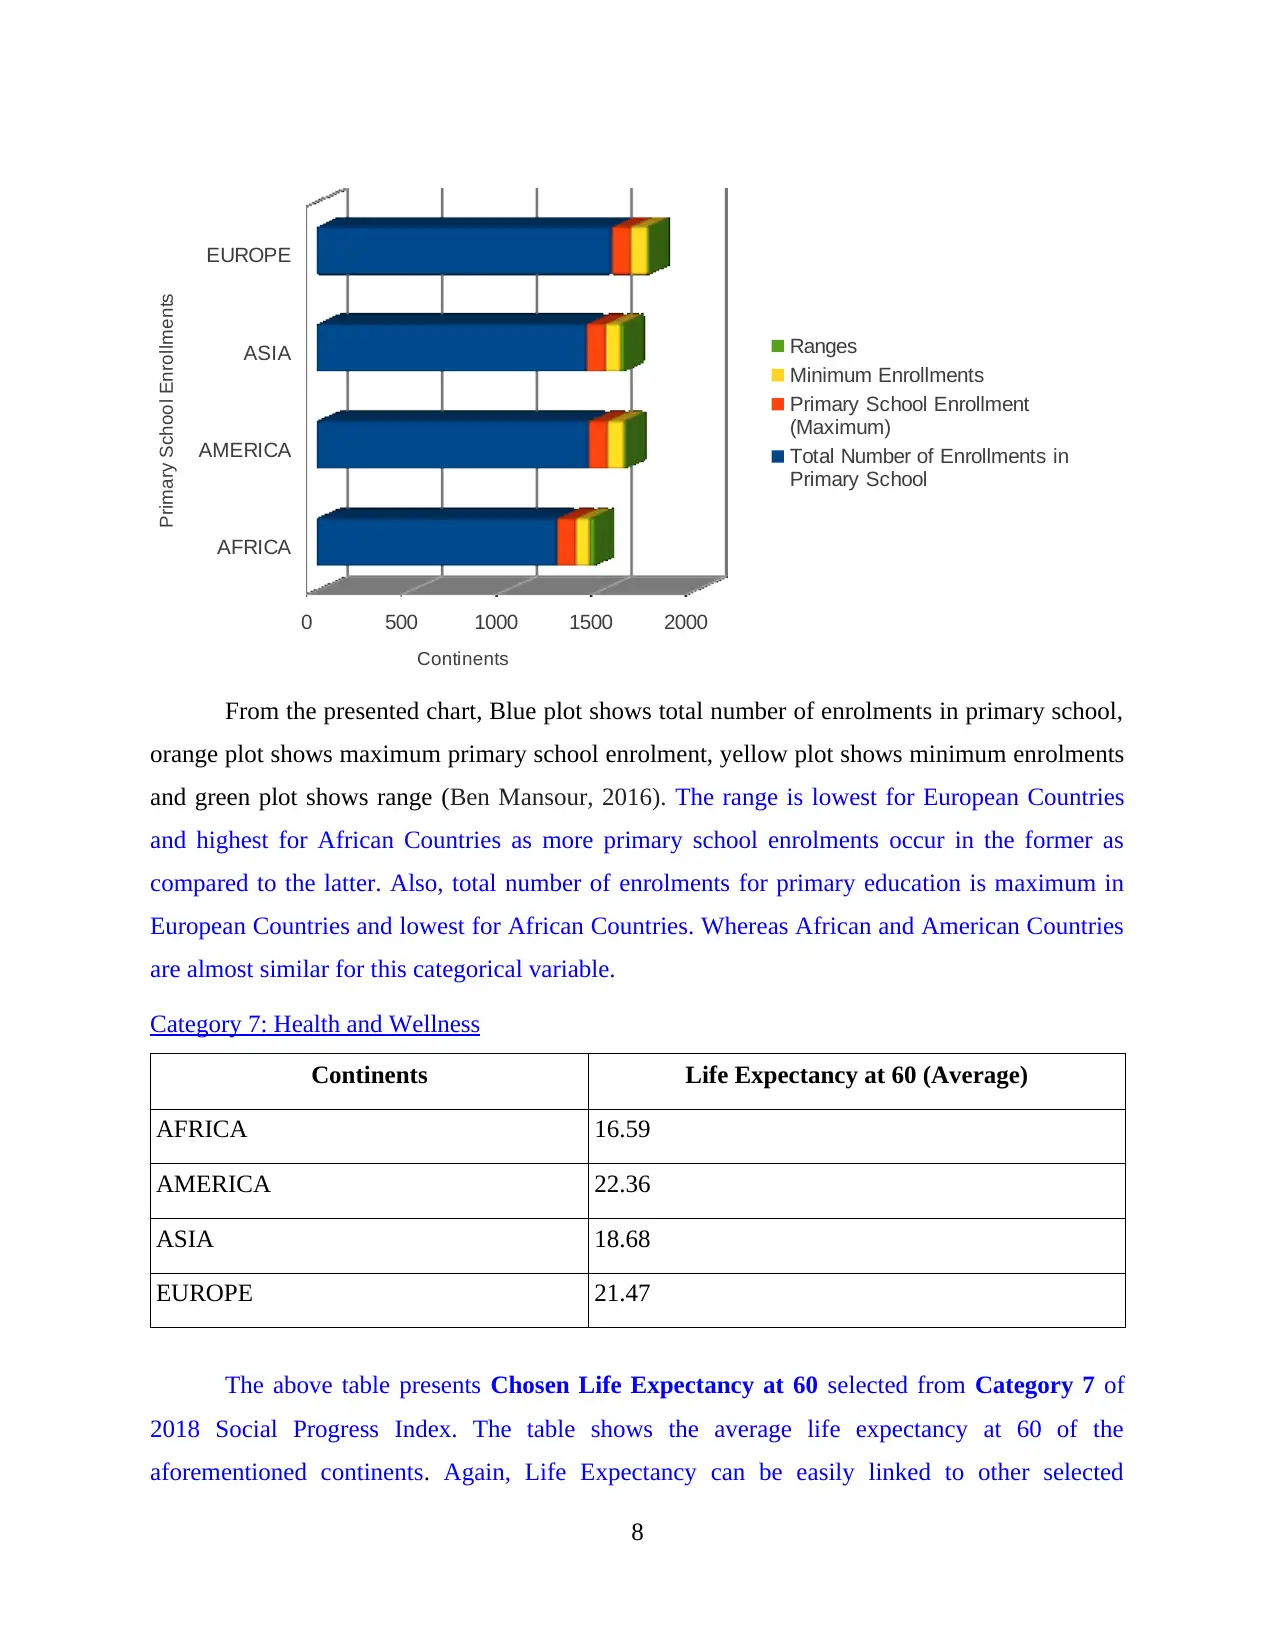
From the presented chart, Blue plot shows total number of enrolments in primary school,
orange plot shows maximum primary school enrolment, yellow plot shows minimum enrolments
and green plot shows range (Ben Mansour, 2016). The range is lowest for European Countries
and highest for African Countries as more primary school enrolments occur in the former as
compared to the latter. Also, total number of enrolments for primary education is maximum in
European Countries and lowest for African Countries. Whereas African and American Countries
are almost similar for this categorical variable.
Category 7: Health and Wellness
Continents Life Expectancy at 60 (Average)
AFRICA 16.59
AMERICA 22.36
ASIA 18.68
EUROPE 21.47
The above table presents Chosen Life Expectancy at 60 selected from Category 7 of
2018 Social Progress Index. The table shows the average life expectancy at 60 of the
aforementioned continents. Again, Life Expectancy can be easily linked to other selected
8
AMERICA
ASIA
EUROPE
0 500 1000 1500 2000
Ranges
Minimum Enrollments
Primary School Enrollment
(Maximum)
Total Number of Enrollments in
Primary School
Continents
Primary School Enrollments
From the presented chart, Blue plot shows total number of enrolments in primary school,
orange plot shows maximum primary school enrolment, yellow plot shows minimum enrolments
and green plot shows range (Ben Mansour, 2016). The range is lowest for European Countries
and highest for African Countries as more primary school enrolments occur in the former as
compared to the latter. Also, total number of enrolments for primary education is maximum in
European Countries and lowest for African Countries. Whereas African and American Countries
are almost similar for this categorical variable.
Category 7: Health and Wellness
Continents Life Expectancy at 60 (Average)
AFRICA 16.59
AMERICA 22.36
ASIA 18.68
EUROPE 21.47
The above table presents Chosen Life Expectancy at 60 selected from Category 7 of
2018 Social Progress Index. The table shows the average life expectancy at 60 of the
aforementioned continents. Again, Life Expectancy can be easily linked to other selected
8
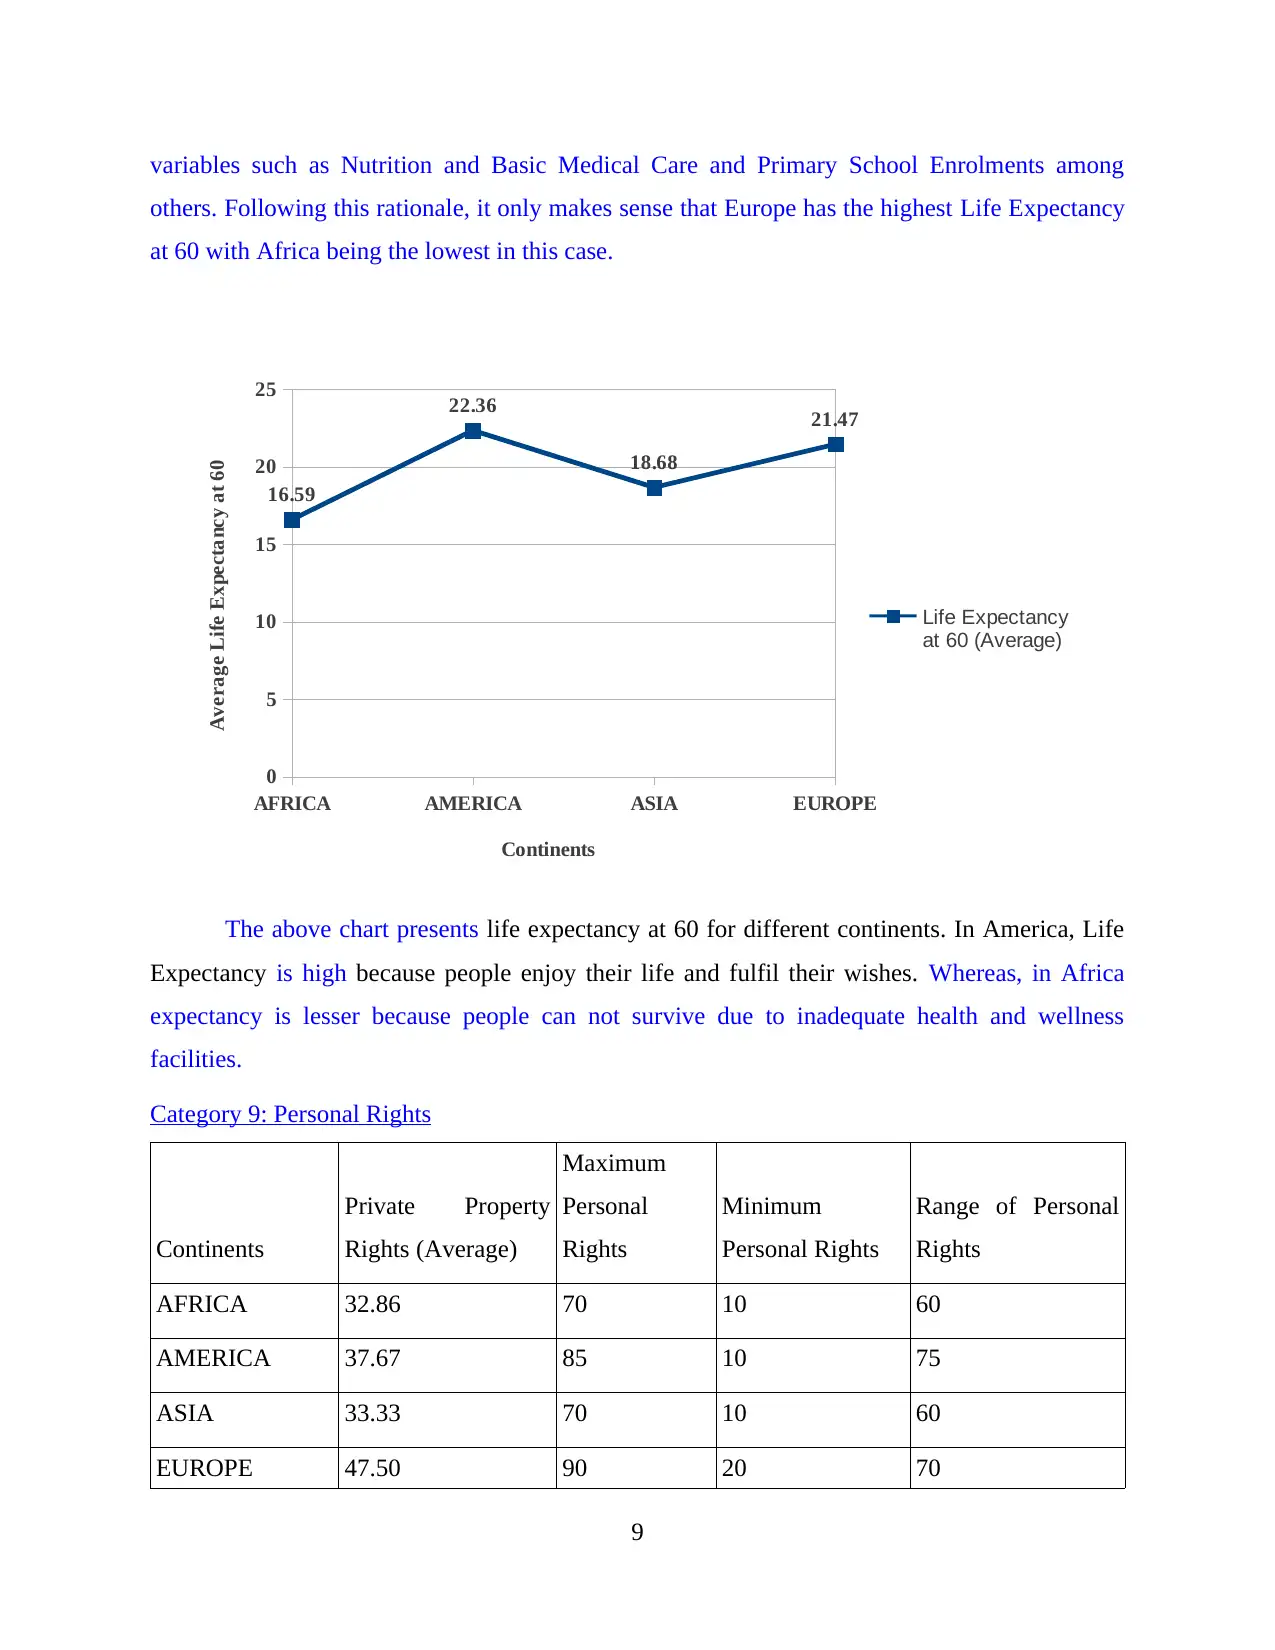
variables such as Nutrition and Basic Medical Care and Primary School Enrolments among
others. Following this rationale, it only makes sense that Europe has the highest Life Expectancy
at 60 with Africa being the lowest in this case.
AFRICA AMERICA ASIA EUROPE
0
5
10
15
20
25
16.59
22.36
18.68
21.47
Life Expectancy
at 60 (Average)
Continents
Average Life Expectancy at 60
The above chart presents life expectancy at 60 for different continents. In America, Life
Expectancy is high because people enjoy their life and fulfil their wishes. Whereas, in Africa
expectancy is lesser because people can not survive due to inadequate health and wellness
facilities.
Category 9: Personal Rights
Continents
Private Property
Rights (Average)
Maximum
Personal
Rights
Minimum
Personal Rights
Range of Personal
Rights
AFRICA 32.86 70 10 60
AMERICA 37.67 85 10 75
ASIA 33.33 70 10 60
EUROPE 47.50 90 20 70
9
⊘ This is a preview!⊘
Do you want full access?
Subscribe today to unlock all pages.
Trusted by 1+ million students worldwide
1 out of 27
Related Documents


Your All-in-One AI-Powered Toolkit for Academic Success.
+13062052269
info@desklib.com
Available 24*7 on WhatsApp / Email
![[object Object]](/_next/static/media/star-bottom.7253800d.svg)
Unlock your academic potential
Copyright © 2020–2026 A2Z Services. All Rights Reserved. Developed and managed by ZUCOL.