Business Statistics Assignment: Descriptive Statistics & Data Analysis
VerifiedAdded on 2023/06/11
|7
|545
|169
Homework Assignment
AI Summary
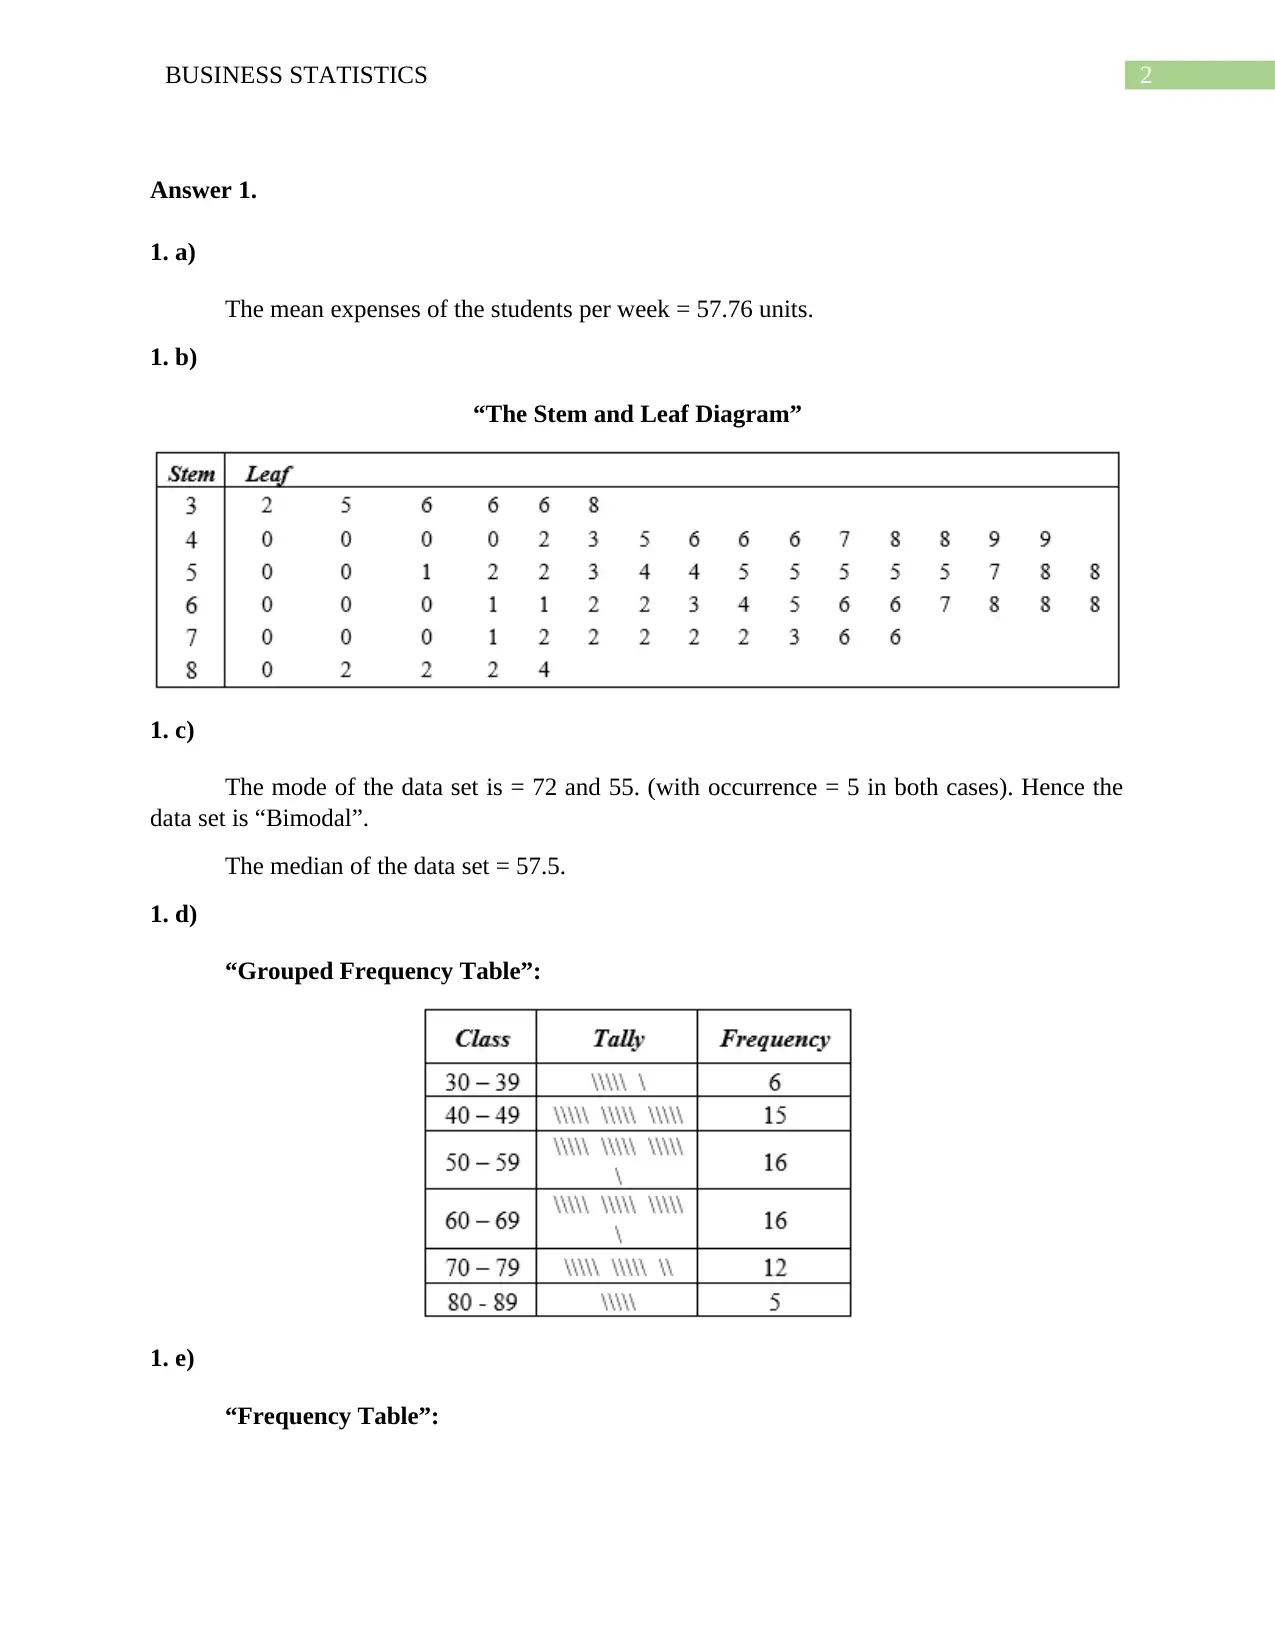
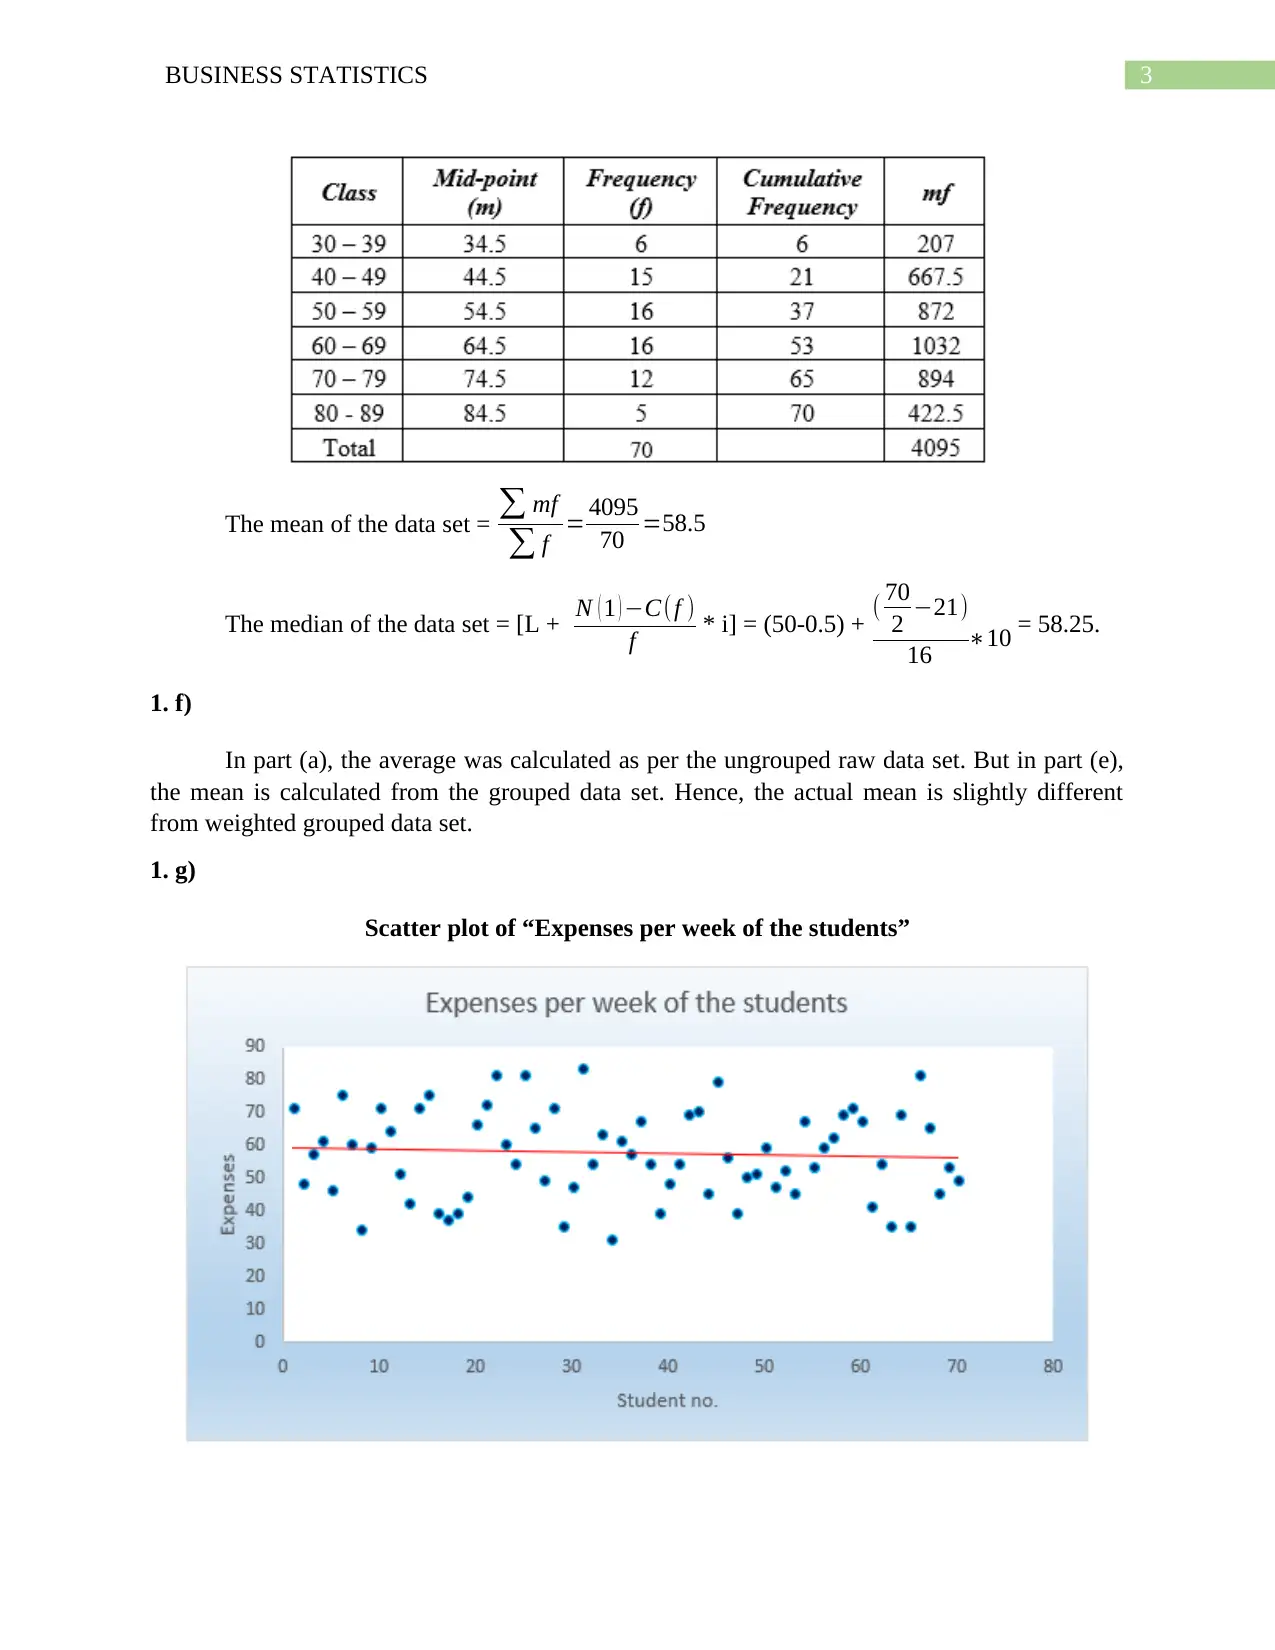
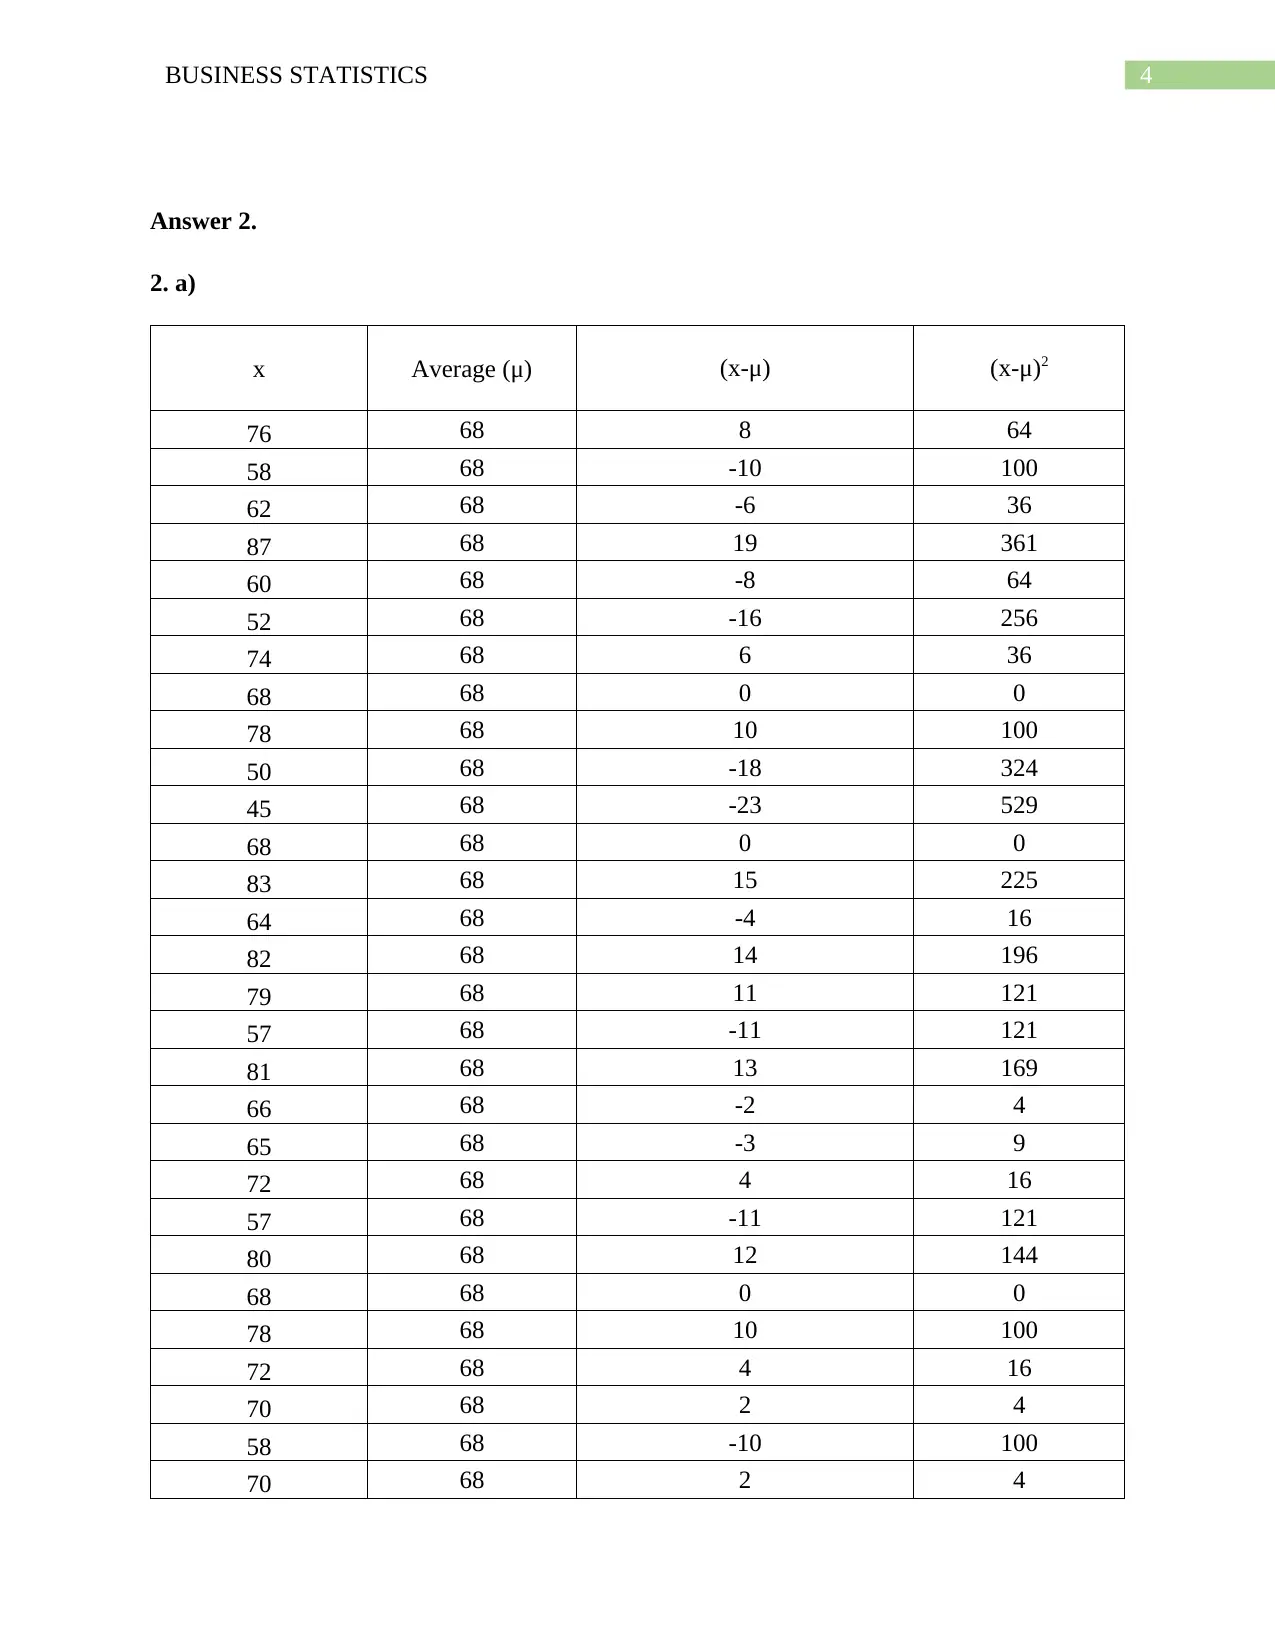
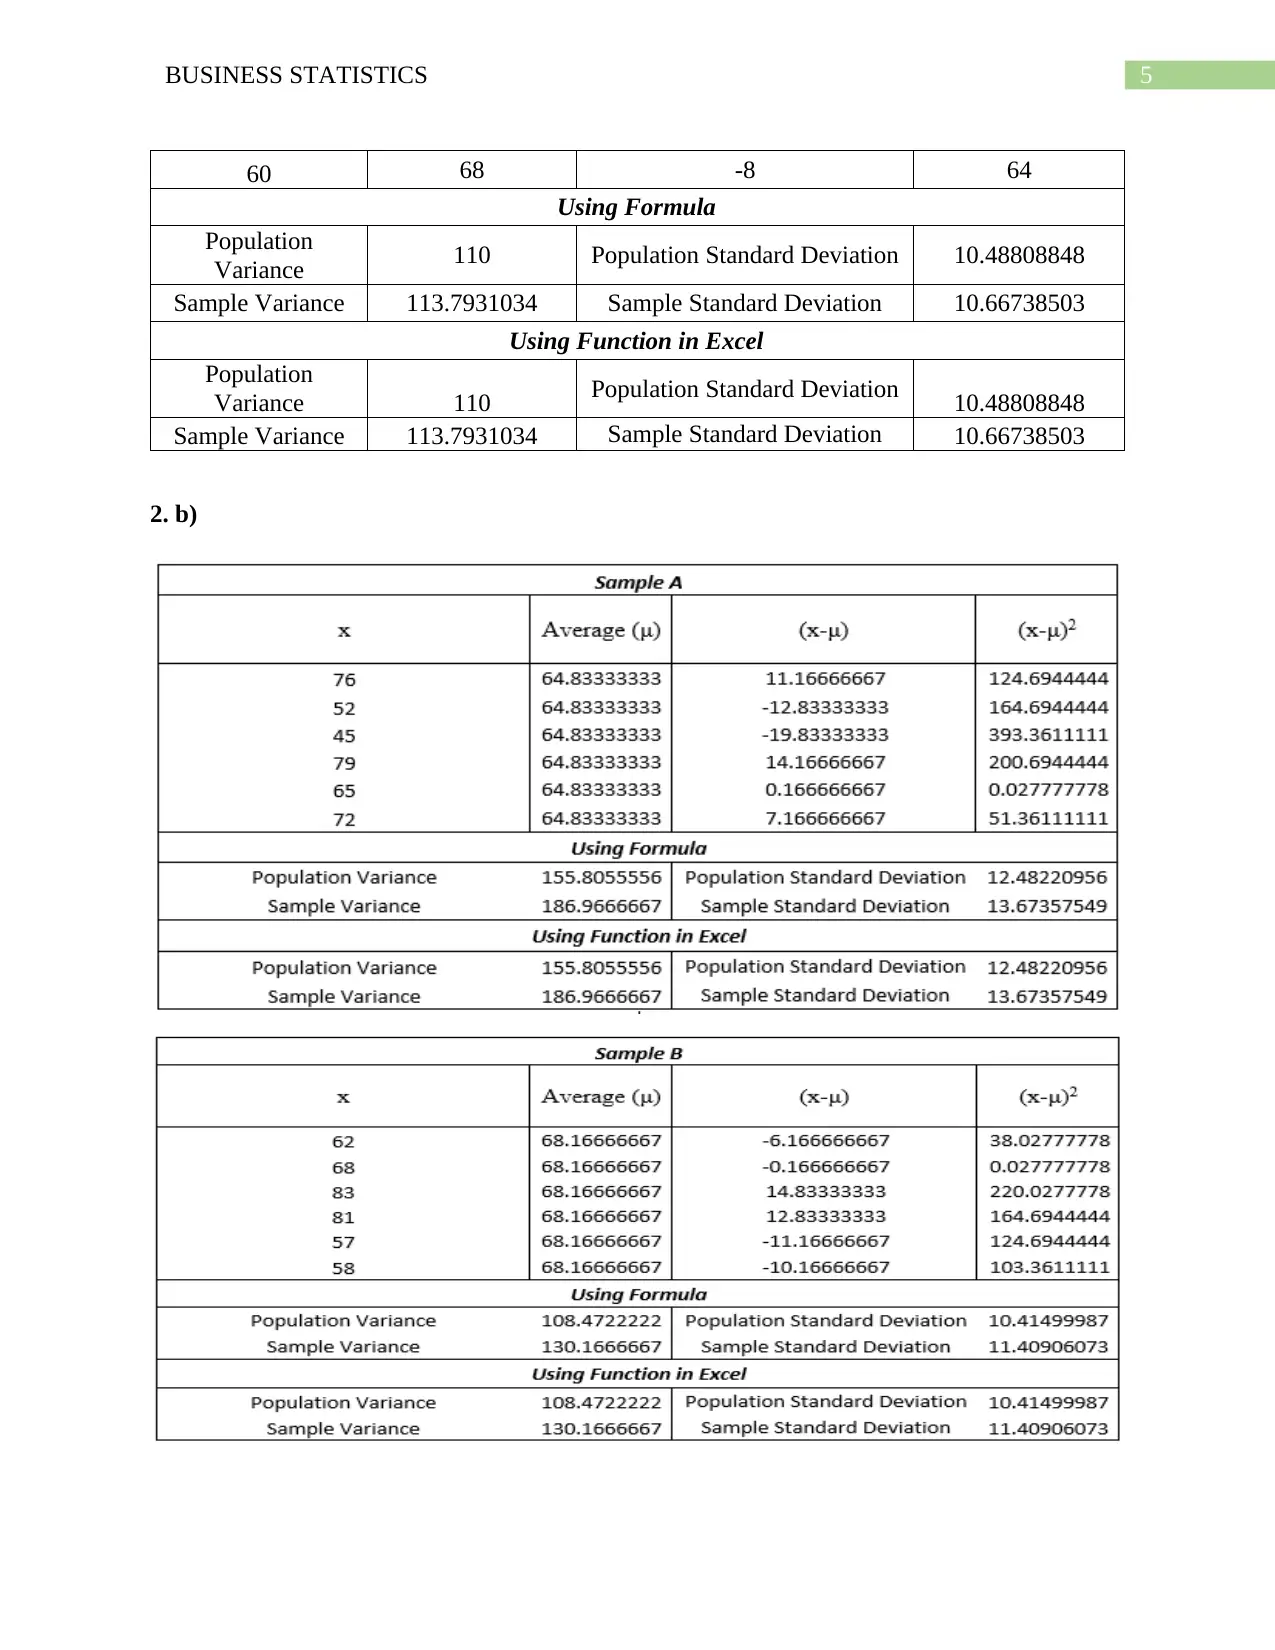
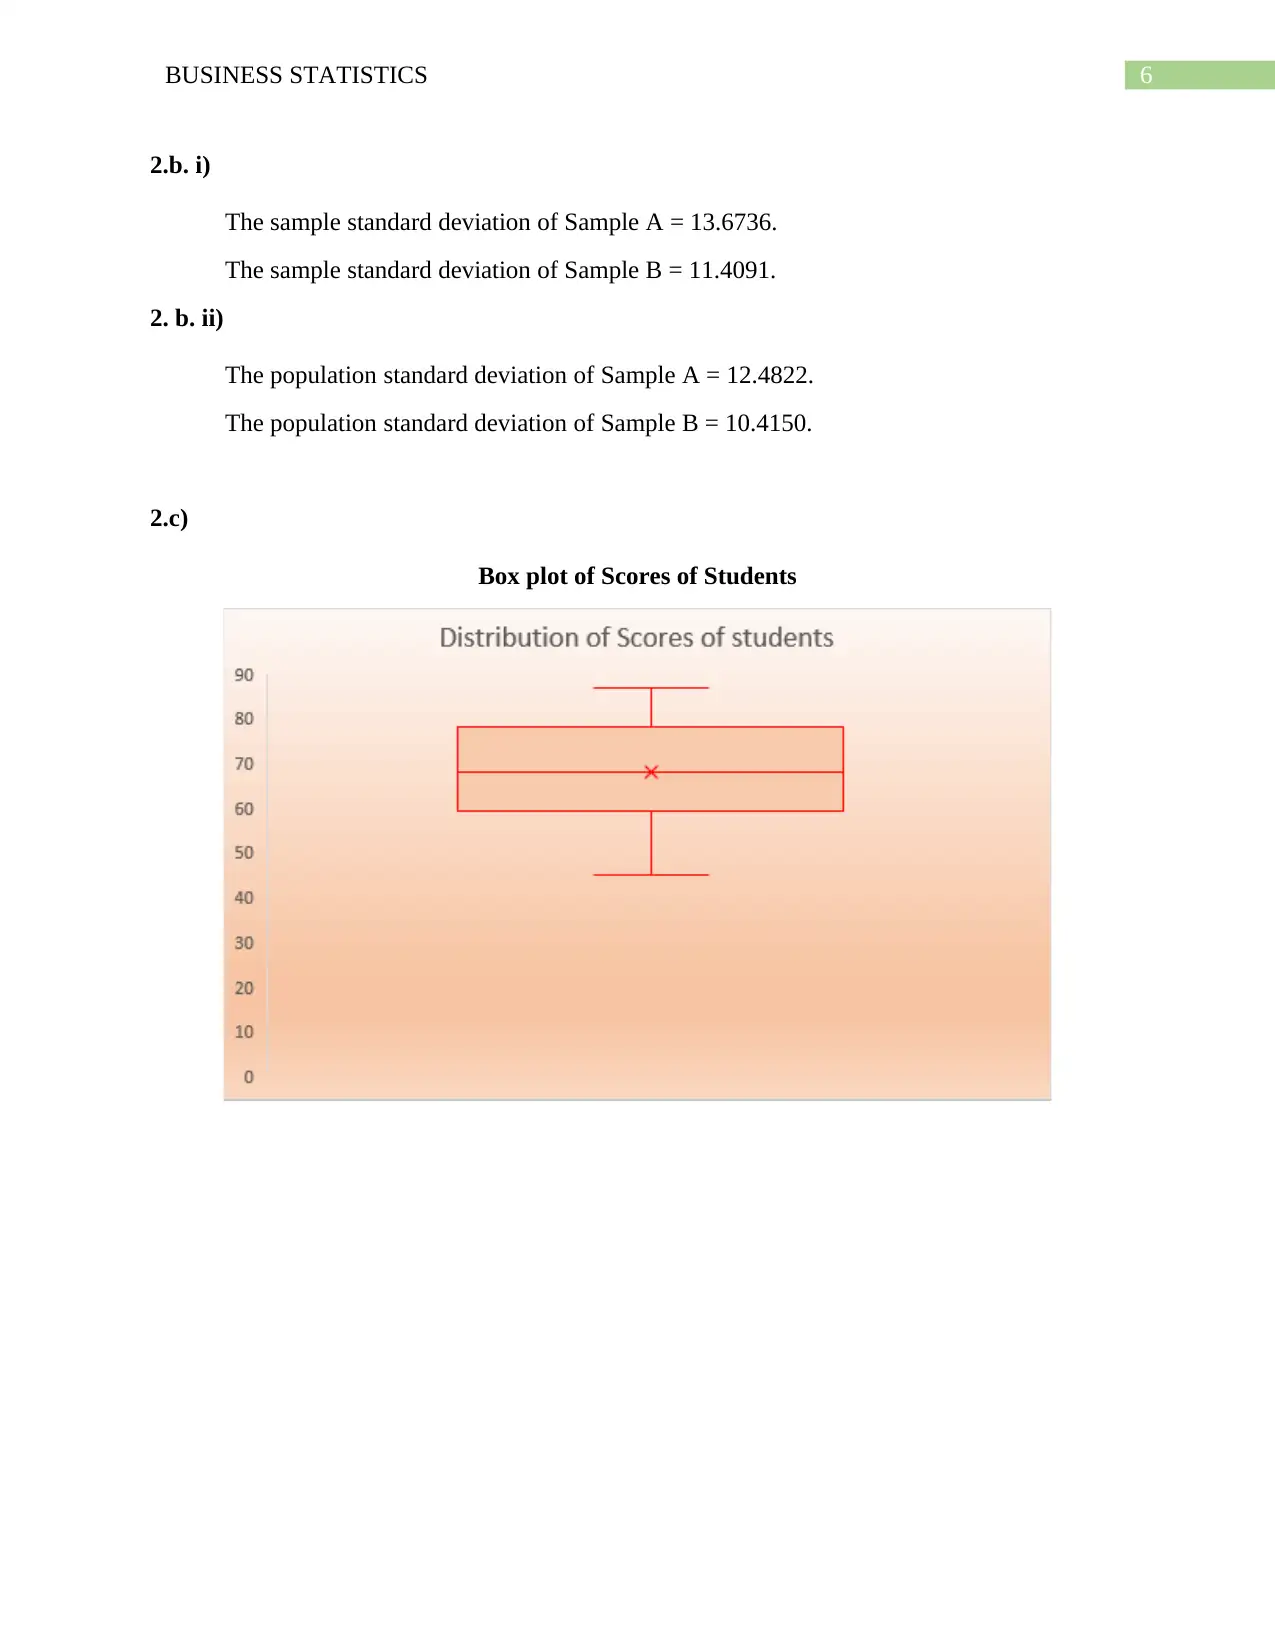
This assignment solution covers various aspects of business statistics, including calculating the mean of expenses, creating stem and leaf diagrams, identifying the mode and median, constructing grouped frequency tables, and analyzing scatter plots. It also delves into calculating population and sample standard deviations and variances, comparing standard deviations of different samples, and creating box plots for score analysis. The solution highlights the differences between calculating the mean from raw data versus grouped data, and provides a comprehensive approach to understanding and interpreting statistical data.

Running head: BUSINESS STATISTICS
Business Statistics
Name of Student:
Name of University:
Course ID:
Business Statistics
Name of Student:
Name of University:
Course ID:
Paraphrase This Document
Need a fresh take? Get an instant paraphrase of this document with our AI Paraphraser

1BUSINESS STATISTICS
Table of Contents
Answer 1..........................................................................................................................................2
1. a)..............................................................................................................................................2
1. b)..............................................................................................................................................2
1. c)..............................................................................................................................................2
1. d)..............................................................................................................................................2
1. e)..............................................................................................................................................2
1. f)...............................................................................................................................................3
1. g)..............................................................................................................................................3
Answer 2..........................................................................................................................................4
2. a)..............................................................................................................................................4
2. b)..............................................................................................................................................5
2.b. i)........................................................................................................................................6
2. b. ii)......................................................................................................................................6
2.c)...............................................................................................................................................6

2BUSINESS STATISTICS
Answer 1.
1. a)
The mean expenses of the students per week = 57.76 units.
1. b)
“The Stem and Leaf Diagram”
1. c)
The mode of the data set is = 72 and 55. (with occurrence = 5 in both cases). Hence the
data set is “Bimodal”.
The median of the data set = 57.5.
1. d)
“Grouped Frequency Table”:
1. e)
“Frequency Table”:
⊘ This is a preview!⊘
Do you want full access?
Subscribe today to unlock all pages.

Trusted by 1+ million students worldwide

3BUSINESS STATISTICS
The mean of the data set = ∑ mf
∑ f = 4095
70 =58.5
The median of the data set = [L + N ( 1 ) −C(f )
f * i] = (50-0.5) + ( 70
2 −21)
16 ∗10 = 58.25.
1. f)
In part (a), the average was calculated as per the ungrouped raw data set. But in part (e),
the mean is calculated from the grouped data set. Hence, the actual mean is slightly different
from weighted grouped data set.
1. g)
Scatter plot of “Expenses per week of the students”
Paraphrase This Document
Need a fresh take? Get an instant paraphrase of this document with our AI Paraphraser

4BUSINESS STATISTICS
Answer 2.
2. a)
x Average (μ) (x-μ) (x-μ)2
76 68 8 64
58 68 -10 100
62 68 -6 36
87 68 19 361
60 68 -8 64
52 68 -16 256
74 68 6 36
68 68 0 0
78 68 10 100
50 68 -18 324
45 68 -23 529
68 68 0 0
83 68 15 225
64 68 -4 16
82 68 14 196
79 68 11 121
57 68 -11 121
81 68 13 169
66 68 -2 4
65 68 -3 9
72 68 4 16
57 68 -11 121
80 68 12 144
68 68 0 0
78 68 10 100
72 68 4 16
70 68 2 4
58 68 -10 100
70 68 2 4

5BUSINESS STATISTICS
60 68 -8 64
Using Formula
Population
Variance 110 Population Standard Deviation 10.48808848
Sample Variance 113.7931034 Sample Standard Deviation 10.66738503
Using Function in Excel
Population
Variance 110 Population Standard Deviation 10.48808848
Sample Variance 113.7931034 Sample Standard Deviation 10.66738503
2. b)
⊘ This is a preview!⊘
Do you want full access?
Subscribe today to unlock all pages.

Trusted by 1+ million students worldwide

6BUSINESS STATISTICS
2.b. i)
The sample standard deviation of Sample A = 13.6736.
The sample standard deviation of Sample B = 11.4091.
2. b. ii)
The population standard deviation of Sample A = 12.4822.
The population standard deviation of Sample B = 10.4150.
2.c)
Box plot of Scores of Students
2.b. i)
The sample standard deviation of Sample A = 13.6736.
The sample standard deviation of Sample B = 11.4091.
2. b. ii)
The population standard deviation of Sample A = 12.4822.
The population standard deviation of Sample B = 10.4150.
2.c)
Box plot of Scores of Students
1 out of 7
Related Documents

Your All-in-One AI-Powered Toolkit for Academic Success.
+13062052269
info@desklib.com
Available 24*7 on WhatsApp / Email
Unlock your academic potential
© 2024 | Zucol Services PVT LTD | All rights reserved.