Business Statistics Assignment: Sample Analysis and Conclusion
VerifiedAdded on 2020/03/28
|12
|2331
|39
Homework Assignment
AI Summary
This document presents a business statistics assignment completed by a student, covering various statistical concepts and techniques. The assignment includes analyzing datasets, creating scatterplots, and calculating regression equations to determine relationships between variables like income and annual contributions. It involves using pivot tables in Excel to find summary statistics for different investment types, calculating sample proportions and differences, and constructing graphs to compare proportions. Furthermore, the assignment covers hypothesis testing, calculating z-scores and p-values, and determining confidence intervals. The student also analyzes their own dataset to find sample statistics, generate graphs, and interpret relationships between variables. Finally, the assignment concludes with a summary of risk and return, including calculations and interpretations based on a provided case study and dataset.

Business Statistics
Name
Institution
Instructor
22nd September 2017
Allocated sample number: 107
1
Name
Institution
Instructor
22nd September 2017
Allocated sample number: 107
1
Paraphrase This Document
Need a fresh take? Get an instant paraphrase of this document with our AI Paraphraser
Section 1
Use the dataset given below you must use the sample allocated to you based on your student
number
https://app.box.com/s/56pb6hqu0ypcg0f3lhy6cl5szt1jgdla
Note that for section 1 the answers are provided so you can check your work, the answers will
not be provided for the other sections.
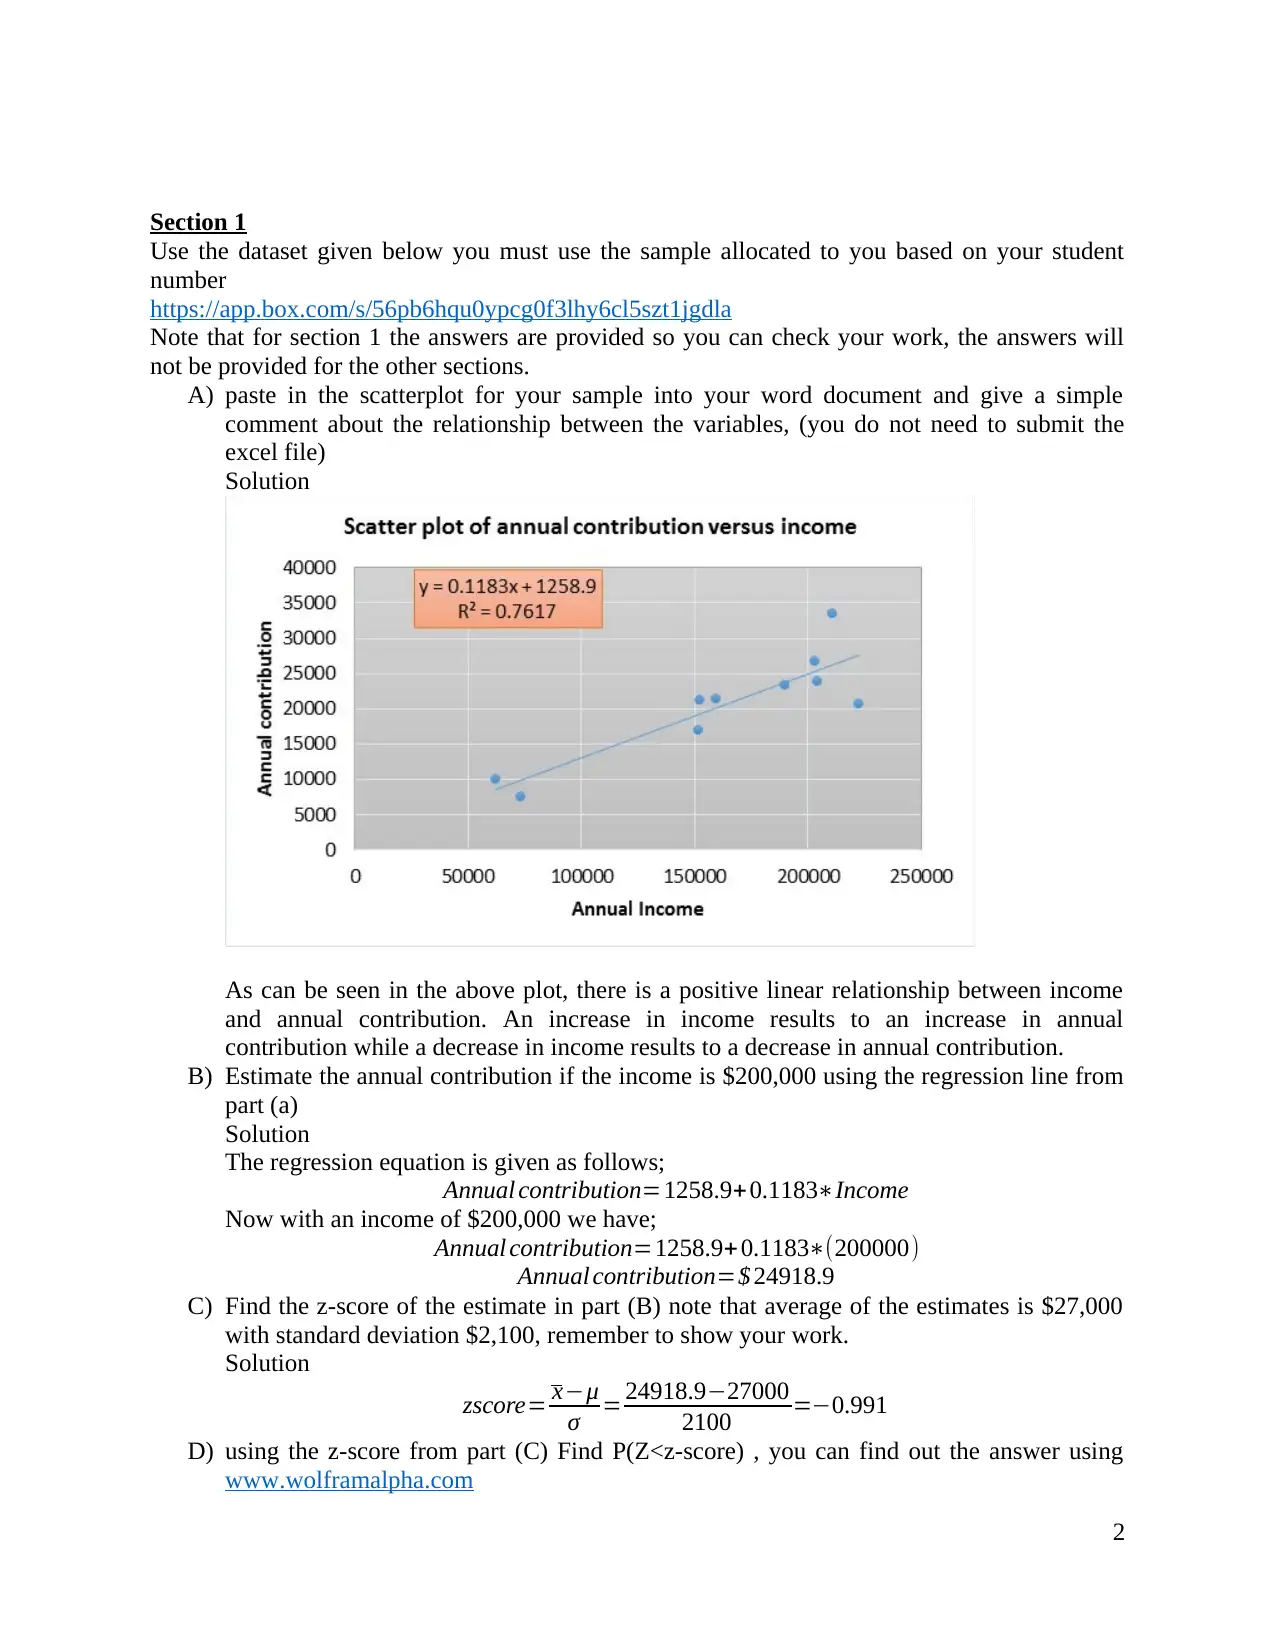
A) paste in the scatterplot for your sample into your word document and give a simple
comment about the relationship between the variables, (you do not need to submit the
excel file)
Solution
As can be seen in the above plot, there is a positive linear relationship between income
and annual contribution. An increase in income results to an increase in annual
contribution while a decrease in income results to a decrease in annual contribution.
B) Estimate the annual contribution if the income is $200,000 using the regression line from
part (a)
Solution
The regression equation is given as follows;
Annual contribution=1258.9+0.1183∗Income
Now with an income of $200,000 we have;
Annual contribution=1258.9+ 0.1183∗(200000)
Annual contribution=$ 24918.9
C) Find the z-score of the estimate in part (B) note that average of the estimates is $27,000
with standard deviation $2,100, remember to show your work.
Solution
zscore= x−μ
σ = 24918.9−27000
2100 =−0.991
D) using the z-score from part (C) Find P(Z<z-score) , you can find out the answer using
www.wolframalpha.com
2
Use the dataset given below you must use the sample allocated to you based on your student
number
https://app.box.com/s/56pb6hqu0ypcg0f3lhy6cl5szt1jgdla
Note that for section 1 the answers are provided so you can check your work, the answers will
not be provided for the other sections.
A) paste in the scatterplot for your sample into your word document and give a simple
comment about the relationship between the variables, (you do not need to submit the
excel file)
Solution
As can be seen in the above plot, there is a positive linear relationship between income
and annual contribution. An increase in income results to an increase in annual
contribution while a decrease in income results to a decrease in annual contribution.
B) Estimate the annual contribution if the income is $200,000 using the regression line from
part (a)
Solution
The regression equation is given as follows;
Annual contribution=1258.9+0.1183∗Income
Now with an income of $200,000 we have;
Annual contribution=1258.9+ 0.1183∗(200000)
Annual contribution=$ 24918.9
C) Find the z-score of the estimate in part (B) note that average of the estimates is $27,000
with standard deviation $2,100, remember to show your work.
Solution
zscore= x−μ
σ = 24918.9−27000
2100 =−0.991
D) using the z-score from part (C) Find P(Z<z-score) , you can find out the answer using
www.wolframalpha.com
2
for example found the z-score was 1.5 if the z-score is 1.5 type in
P(Z<1.5)
into wolfram alpha.com
Solution
P( Z< zscore)=P( Z ←0.991)=0.16 08
E) If there was a list of 10,000 estimates ranked from lowest to highest, what rank do you
think your estimate would be close to?
Hint: just use the formula
expected rank = P(Z<z-score)*10000, remember to show your work.
Solution
Expected rank =P(Z < zscore )∗10000
Expected rank =0.1608∗10000=16 08
Section 2
Use the dataset given below you must use the sample allocated to you based on your student
number
https://app.box.com/s/yvhk3e3oymbs3toy6j5xetid82dsjyz4
A) Use the PivotTable feature in excel to find appropriate summary statistics for your
sample, This will probably require two PivotTables. You should paste both into word,
you do not need the excel file.
Make sure the pivot table (or pivot tables) include the following statistics
*Just considering the high risk (riskier type) investments what is the sample size n1 and
the proportion of high risk investments that made a loss ^p1
*Just considering the low risk (safer type) investments what is the sample size =n2 and
What is the proportion of low risk investments that made a loss ^p2
Solution
Count of made a loss (L or P)? Column Labels
Row Labels L P Grand Total
r 19 56 75
s 1 24 25
Grand Total 20 80 100
High risk investment
Sample size n1 is 75
Proportion that made a loss ^p1 is 19
75 =0.2533
Low risk investments,
Sample size n2 is 25
Proportion that made a loss ^p2 is 1
25 =0.0 4
3
⊘ This is a preview!⊘
Do you want full access?
Subscribe today to unlock all pages.
Trusted by 1+ million students worldwide
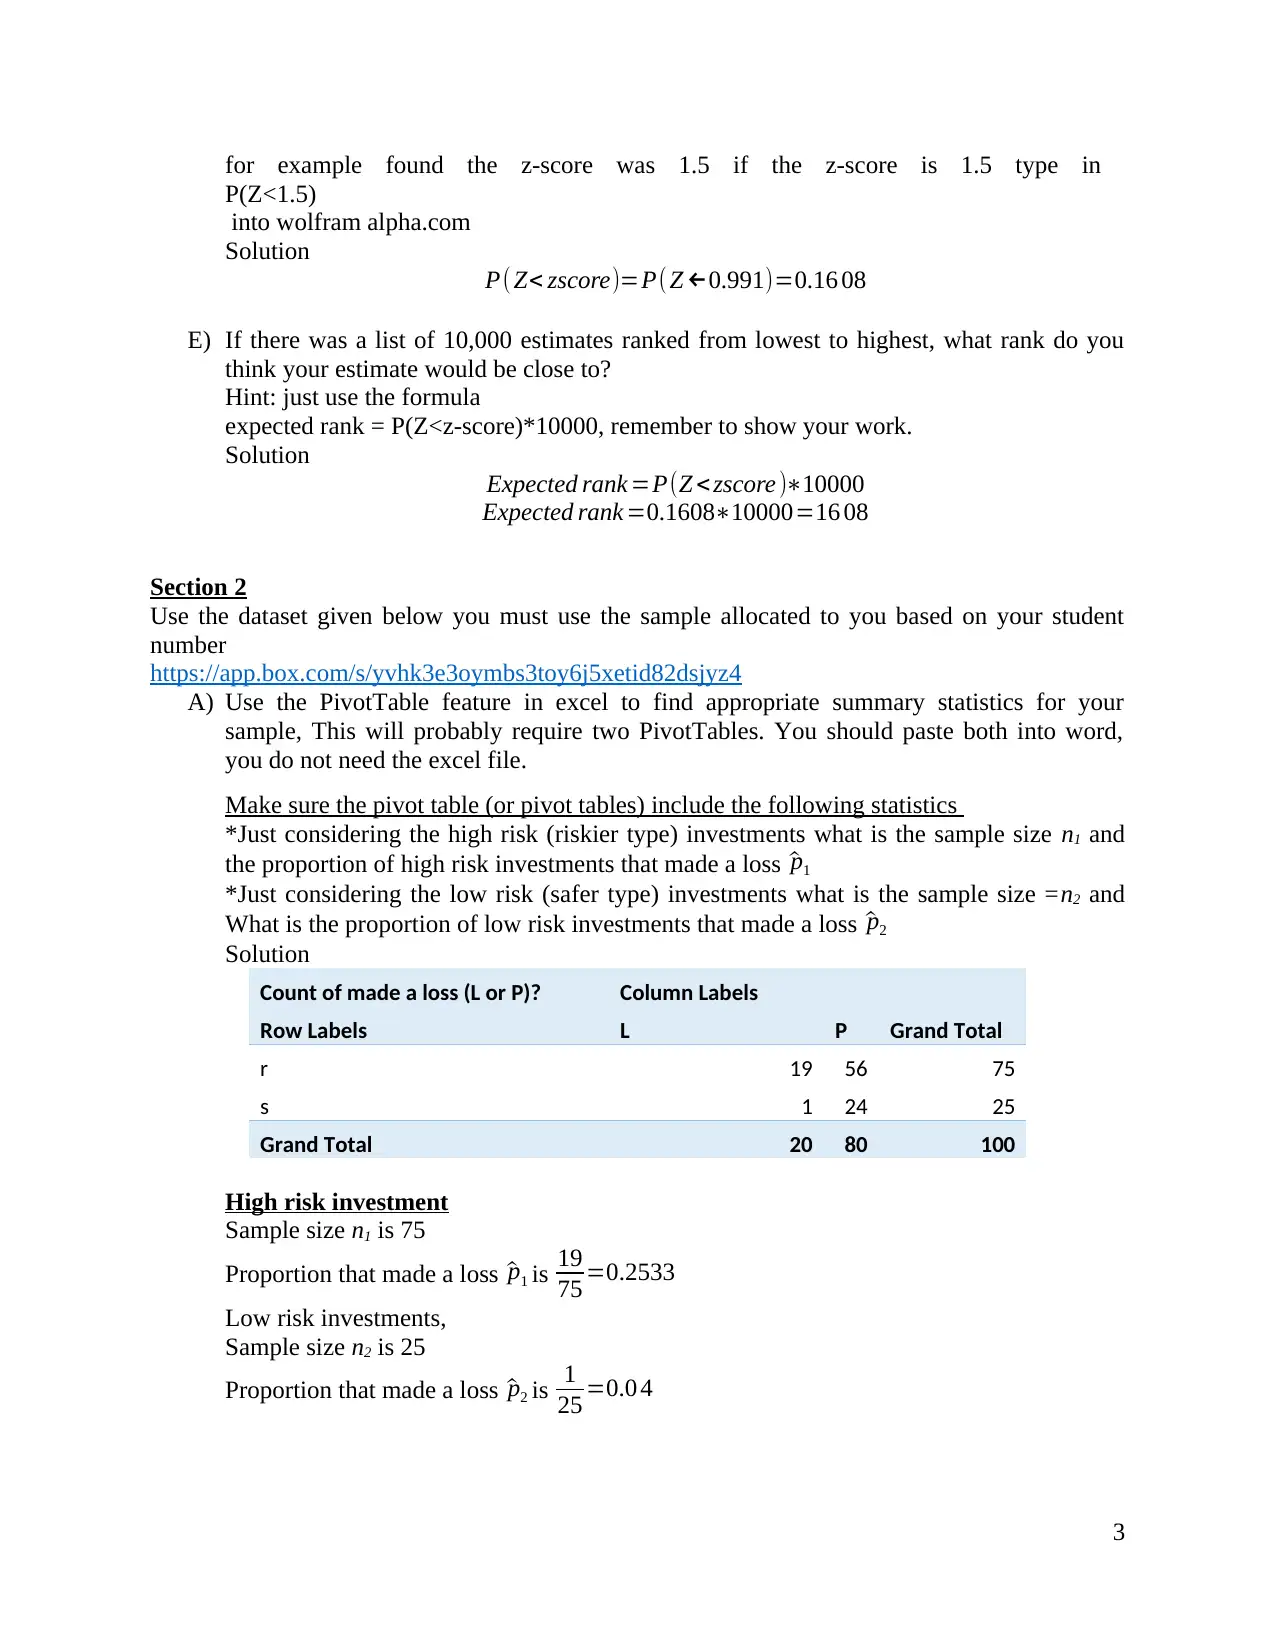
B) Use excel to make an appropriate graph that lets you compare the proportions found in
parts A and paste this into your word document
Solution
C) Looking at your answers to parts (A) and (B) Make a simple comment about the
relationship between the variables investment type (risk or safe) and Made a profit (made
a profit/made a loss)
Solution
Clearly a huge proportion (96%) of safer investments made profits as compared to riskier
investments (74.7%)
D) Questions
i) Using your sample what is the estimate for p1- p2? In other words what is the
difference between the sample proportions ^p1 - ^p2
Solution
^p1− ^p2
¿ 0.2533−0.04=0.2133
ii) Find the z-score of the estimate in part (i) note that average of the estimates is 0.1
with standard deviation 0.0743
Solution
0.2133
√ 0.1 ( 1−0.1 ) ( 1
75 + 1
25 ) =3.0787
iii) Using part (ii) find P(Z<z-score) using www.wolframalpha.com for example if
the z-score is 0.5 type in P(Z<0.5)” into wolframalpha.com
Solution
P(Z< 3.0787)=0.9990
4
Paraphrase This Document
Need a fresh take? Get an instant paraphrase of this document with our AI Paraphraser
iv) IF there was a list of 4000 estimates ranked from lowest to highest, roughly what
rank do you expect your estimate to have? Hint: just use the formula expected
rank = P(Z<z-score)*4000
Solution
Expected rank =P(Z <zscore )∗4000
Expected rank =0.9990∗4000=3996
E) Test the claim there is a difference in the proportions use a 5% level of significance
i) State an appropriate H0 and H1
Solution
H0 : ^p1= ^p2
H1 : ^p1 ≠ ^p2
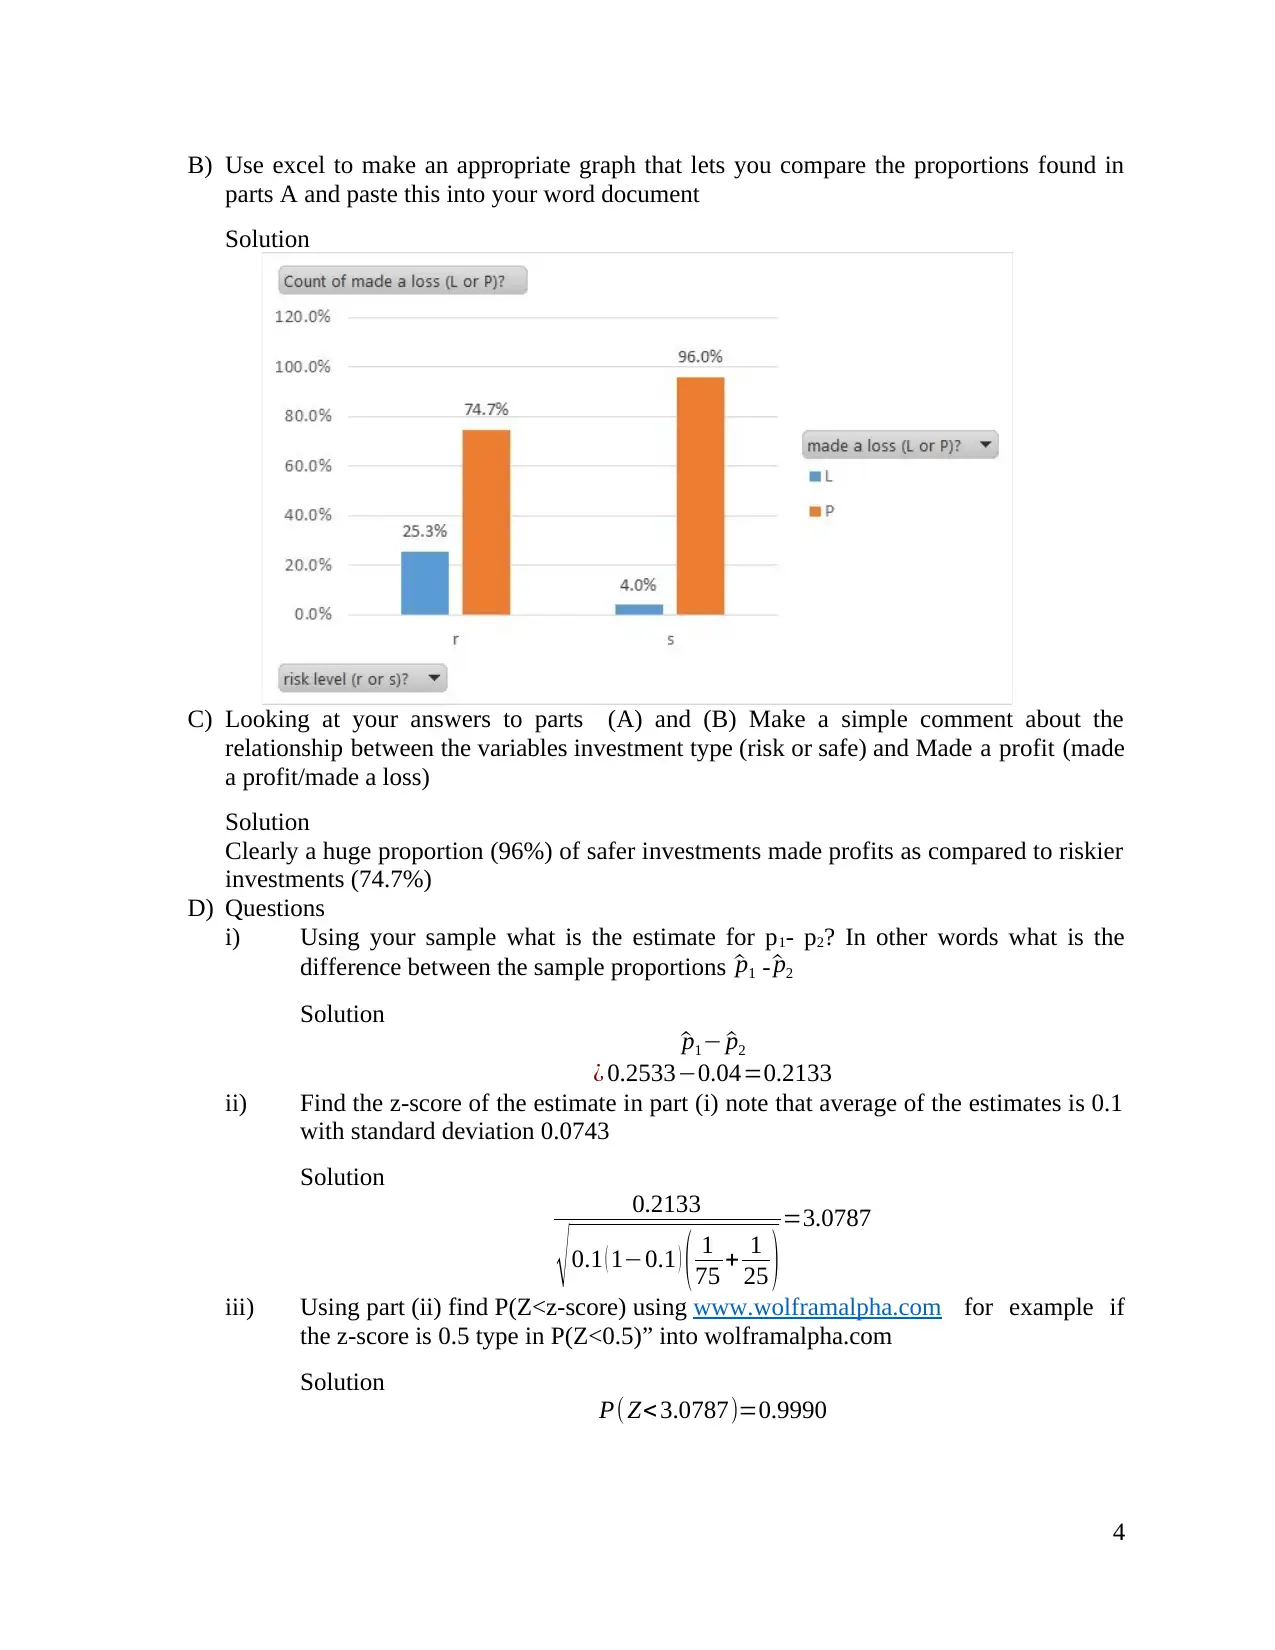
ii) Find the p-value Only using the answers to part (A) and the webpage
http://epitools.ausvet.com.au/content.php?page=z-test-2 Do NOT use any other
method to find the p-value. Do NOT use any other software package such as
SPSS or Analysis tookpak
Solution
Results
Sample 1 Sample 2 Difference
Sample proportion 0.2533 0.04 0.2133
95% CI (asymptotic) 0.1549 - 0.3517 -0.0368 - 0.1168 0.0323 - 0.3943
z-value 2.3
P-value 0.0209
Interpretation
Statistically significant,
reject null hypothesis that
sample proportions are equal
n by pi n * pi <=5, test inappropriate
5
rank do you expect your estimate to have? Hint: just use the formula expected
rank = P(Z<z-score)*4000
Solution
Expected rank =P(Z <zscore )∗4000
Expected rank =0.9990∗4000=3996
E) Test the claim there is a difference in the proportions use a 5% level of significance
i) State an appropriate H0 and H1
Solution
H0 : ^p1= ^p2
H1 : ^p1 ≠ ^p2
ii) Find the p-value Only using the answers to part (A) and the webpage
http://epitools.ausvet.com.au/content.php?page=z-test-2 Do NOT use any other
method to find the p-value. Do NOT use any other software package such as
SPSS or Analysis tookpak
Solution
Results
Sample 1 Sample 2 Difference
Sample proportion 0.2533 0.04 0.2133
95% CI (asymptotic) 0.1549 - 0.3517 -0.0368 - 0.1168 0.0323 - 0.3943
z-value 2.3
P-value 0.0209
Interpretation
Statistically significant,
reject null hypothesis that
sample proportions are equal
n by pi n * pi <=5, test inappropriate
5
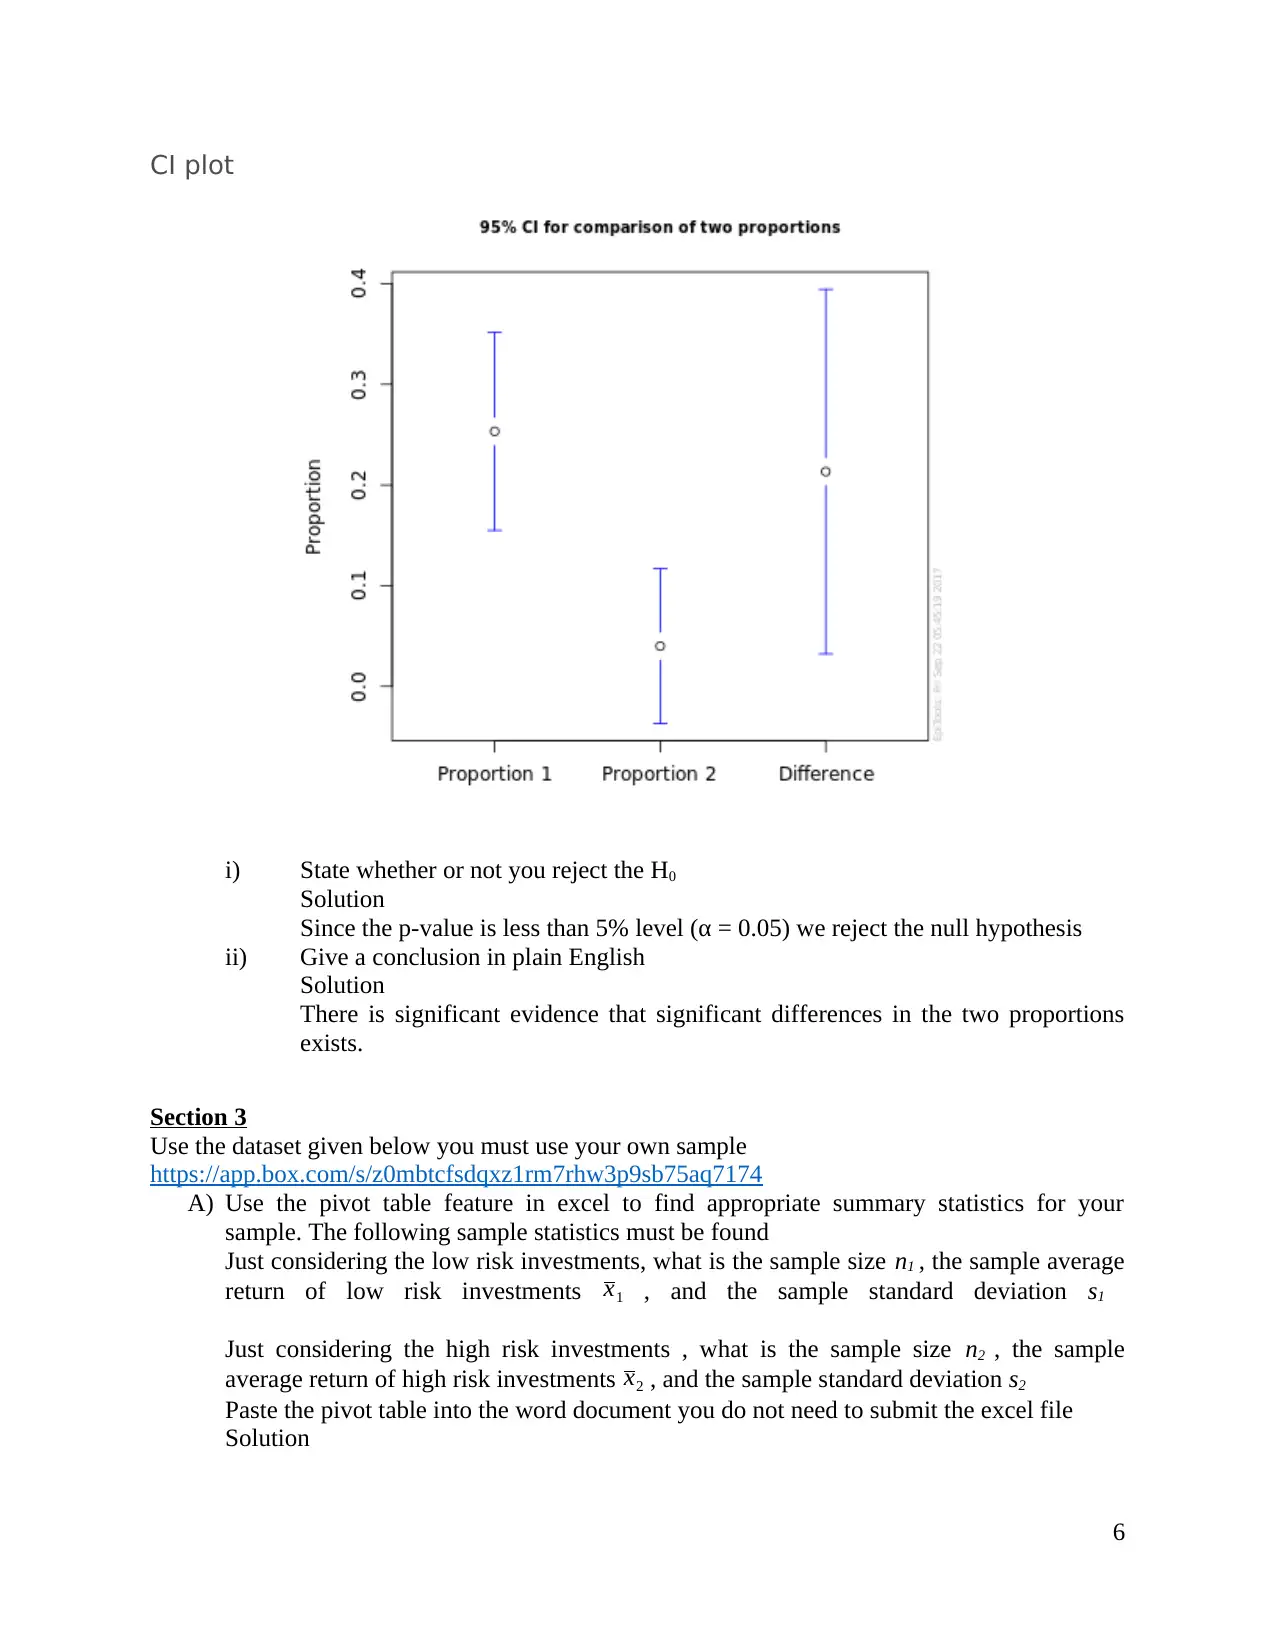
CI plot
i) State whether or not you reject the H0
Solution
Since the p-value is less than 5% level (α = 0.05) we reject the null hypothesis
ii) Give a conclusion in plain English
Solution
There is significant evidence that significant differences in the two proportions
exists.
Section 3
Use the dataset given below you must use your own sample
https://app.box.com/s/z0mbtcfsdqxz1rm7rhw3p9sb75aq7174
A) Use the pivot table feature in excel to find appropriate summary statistics for your
sample. The following sample statistics must be found
Just considering the low risk investments, what is the sample size n1 , the sample average
return of low risk investments x1 , and the sample standard deviation s1
Just considering the high risk investments , what is the sample size n2 , the sample
average return of high risk investments x2 , and the sample standard deviation s2
Paste the pivot table into the word document you do not need to submit the excel file
Solution
6
⊘ This is a preview!⊘
Do you want full access?
Subscribe today to unlock all pages.
Trusted by 1+ million students worldwide
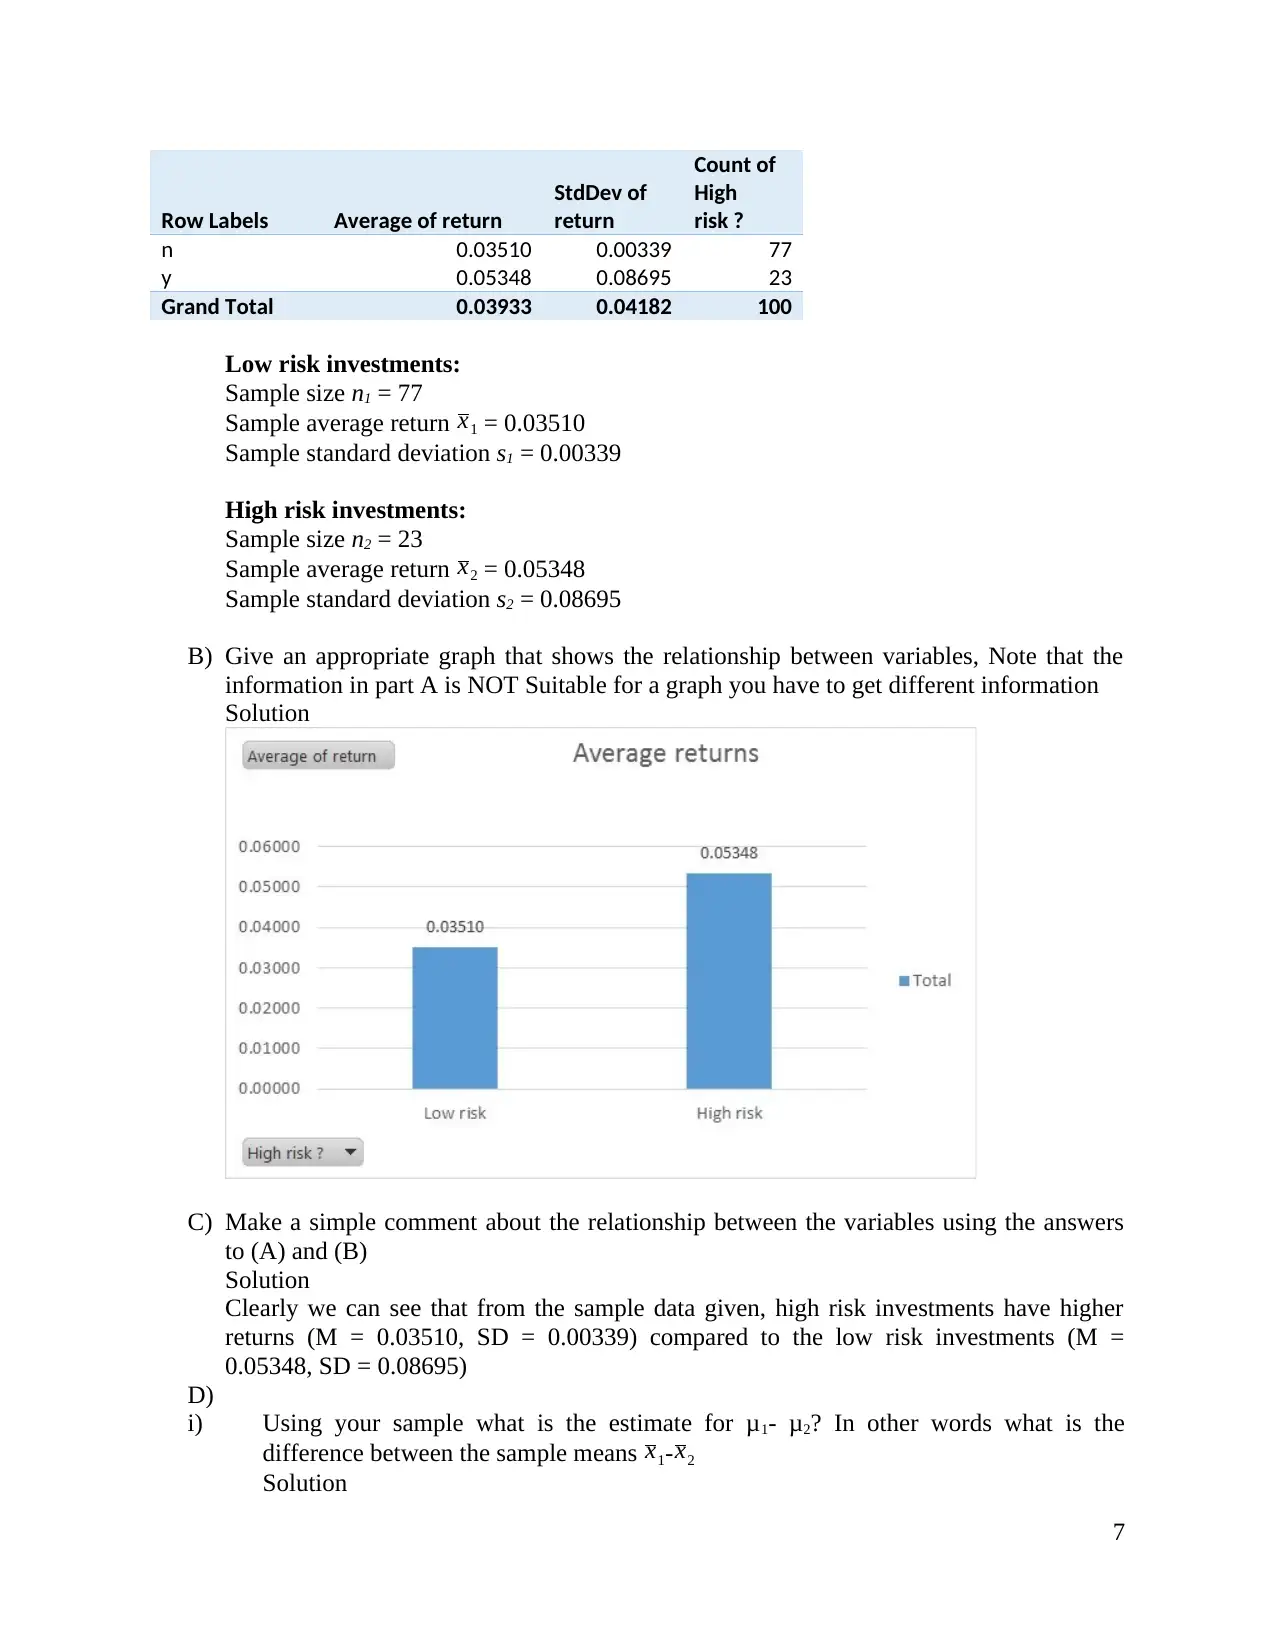
Row Labels Average of return
StdDev of
return
Count of
High
risk ?
n 0.03510 0.00339 77
y 0.05348 0.08695 23
Grand Total 0.03933 0.04182 100
Low risk investments:
Sample size n1 = 77
Sample average return x1 = 0.03510
Sample standard deviation s1 = 0.00339
High risk investments:
Sample size n2 = 23
Sample average return x2 = 0.05348
Sample standard deviation s2 = 0.08695
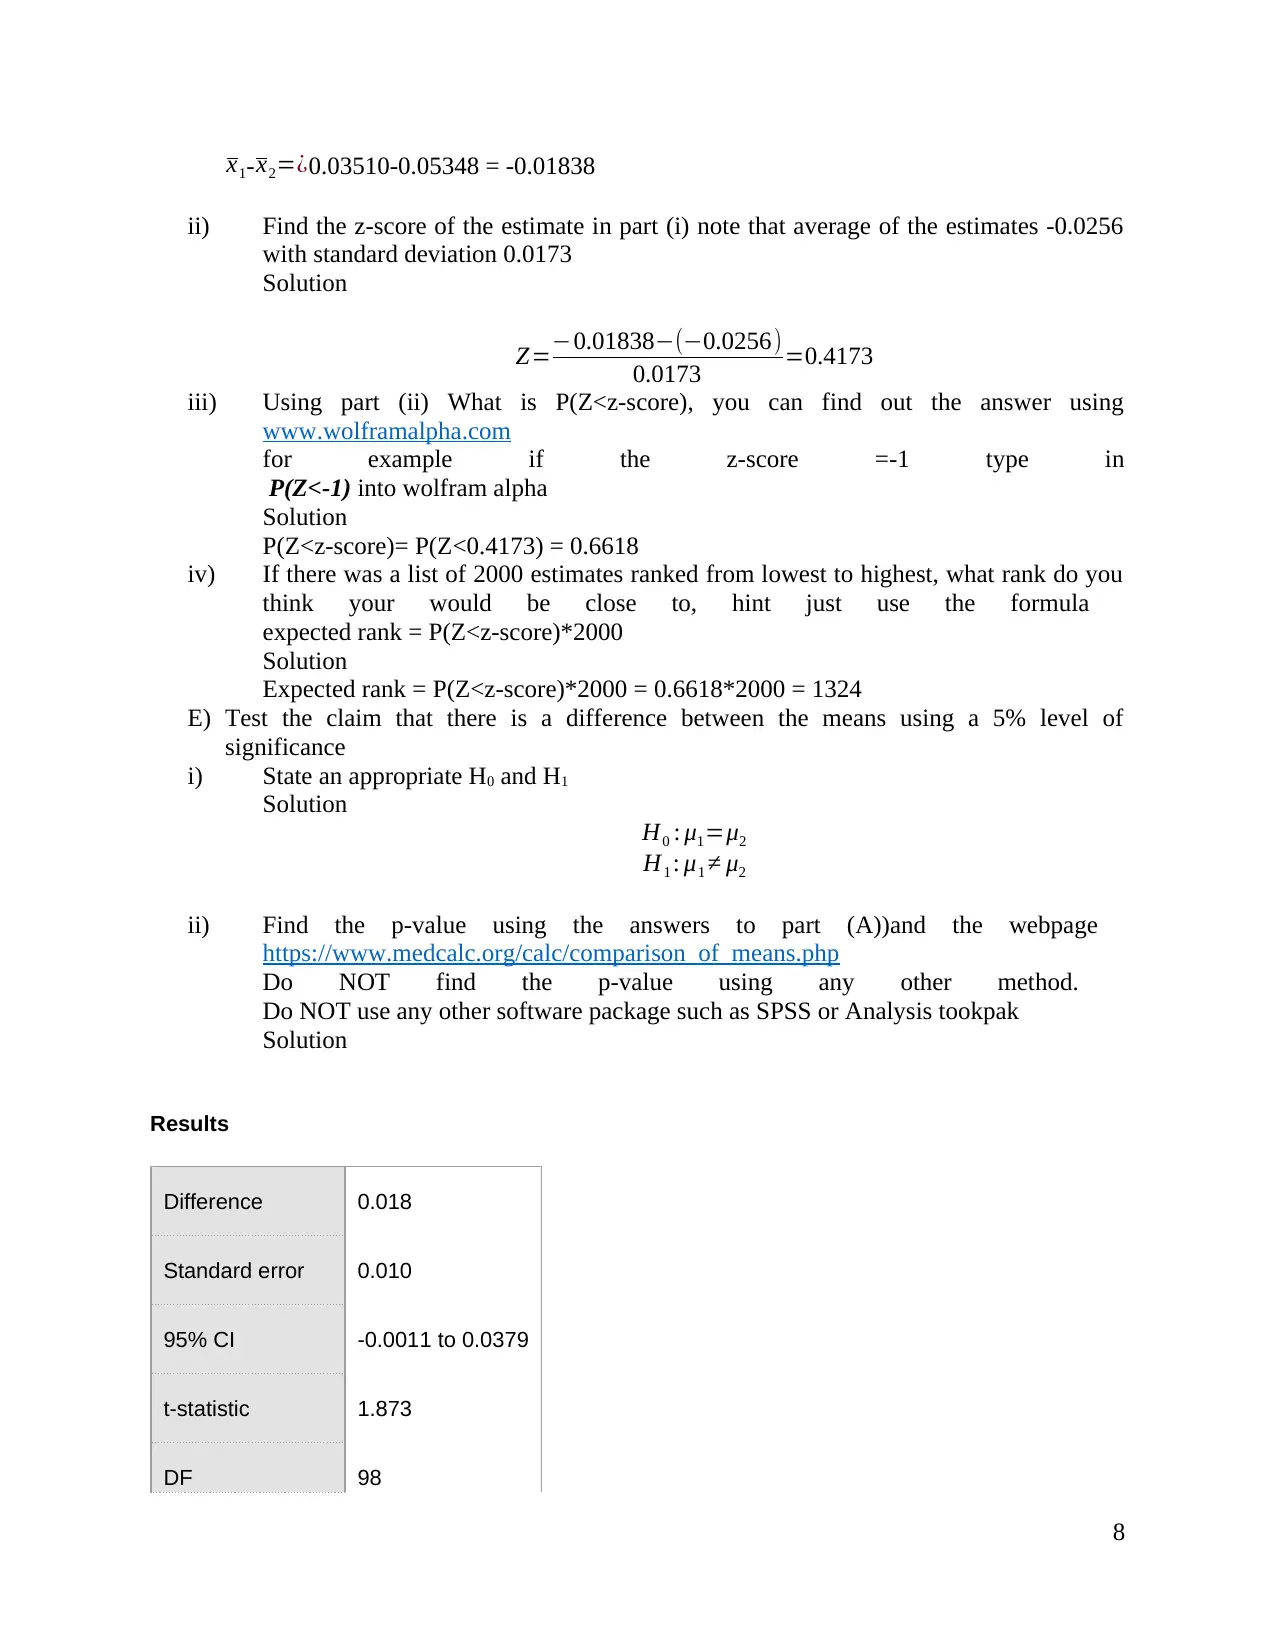
B) Give an appropriate graph that shows the relationship between variables, Note that the
information in part A is NOT Suitable for a graph you have to get different information
Solution
C) Make a simple comment about the relationship between the variables using the answers
to (A) and (B)
Solution
Clearly we can see that from the sample data given, high risk investments have higher
returns (M = 0.03510, SD = 0.00339) compared to the low risk investments (M =
0.05348, SD = 0.08695)
D)
i) Using your sample what is the estimate for μ1- μ2? In other words what is the
difference between the sample means x1- x2
Solution
7
StdDev of
return
Count of
High
risk ?
n 0.03510 0.00339 77
y 0.05348 0.08695 23
Grand Total 0.03933 0.04182 100
Low risk investments:
Sample size n1 = 77
Sample average return x1 = 0.03510
Sample standard deviation s1 = 0.00339
High risk investments:
Sample size n2 = 23
Sample average return x2 = 0.05348
Sample standard deviation s2 = 0.08695
B) Give an appropriate graph that shows the relationship between variables, Note that the
information in part A is NOT Suitable for a graph you have to get different information
Solution
C) Make a simple comment about the relationship between the variables using the answers
to (A) and (B)
Solution
Clearly we can see that from the sample data given, high risk investments have higher
returns (M = 0.03510, SD = 0.00339) compared to the low risk investments (M =
0.05348, SD = 0.08695)
D)
i) Using your sample what is the estimate for μ1- μ2? In other words what is the
difference between the sample means x1- x2
Solution
7
Paraphrase This Document
Need a fresh take? Get an instant paraphrase of this document with our AI Paraphraser
x1- x2=¿0.03510-0.05348 = -0.01838
ii) Find the z-score of the estimate in part (i) note that average of the estimates -0.0256
with standard deviation 0.0173
Solution
Z=−0.01838−(−0.0256)
0.0173 =0.4173
iii) Using part (ii) What is P(Z<z-score), you can find out the answer using
www.wolframalpha.com
for example if the z-score =-1 type in
P(Z<-1) into wolfram alpha
Solution
P(Z<z-score)= P(Z<0.4173) = 0.6618
iv) If there was a list of 2000 estimates ranked from lowest to highest, what rank do you
think your would be close to, hint just use the formula
expected rank = P(Z<z-score)*2000
Solution
Expected rank = P(Z<z-score)*2000 = 0.6618*2000 = 1324
E) Test the claim that there is a difference between the means using a 5% level of
significance
i) State an appropriate H0 and H1
Solution
H0 : μ1=μ2
H1 : μ1 ≠ μ2
ii) Find the p-value using the answers to part (A))and the webpage
https://www.medcalc.org/calc/comparison_of_means.php
Do NOT find the p-value using any other method.
Do NOT use any other software package such as SPSS or Analysis tookpak
Solution
Results
Difference 0.018
Standard error 0.010
95% CI -0.0011 to 0.0379
t-statistic 1.873
DF 98
8
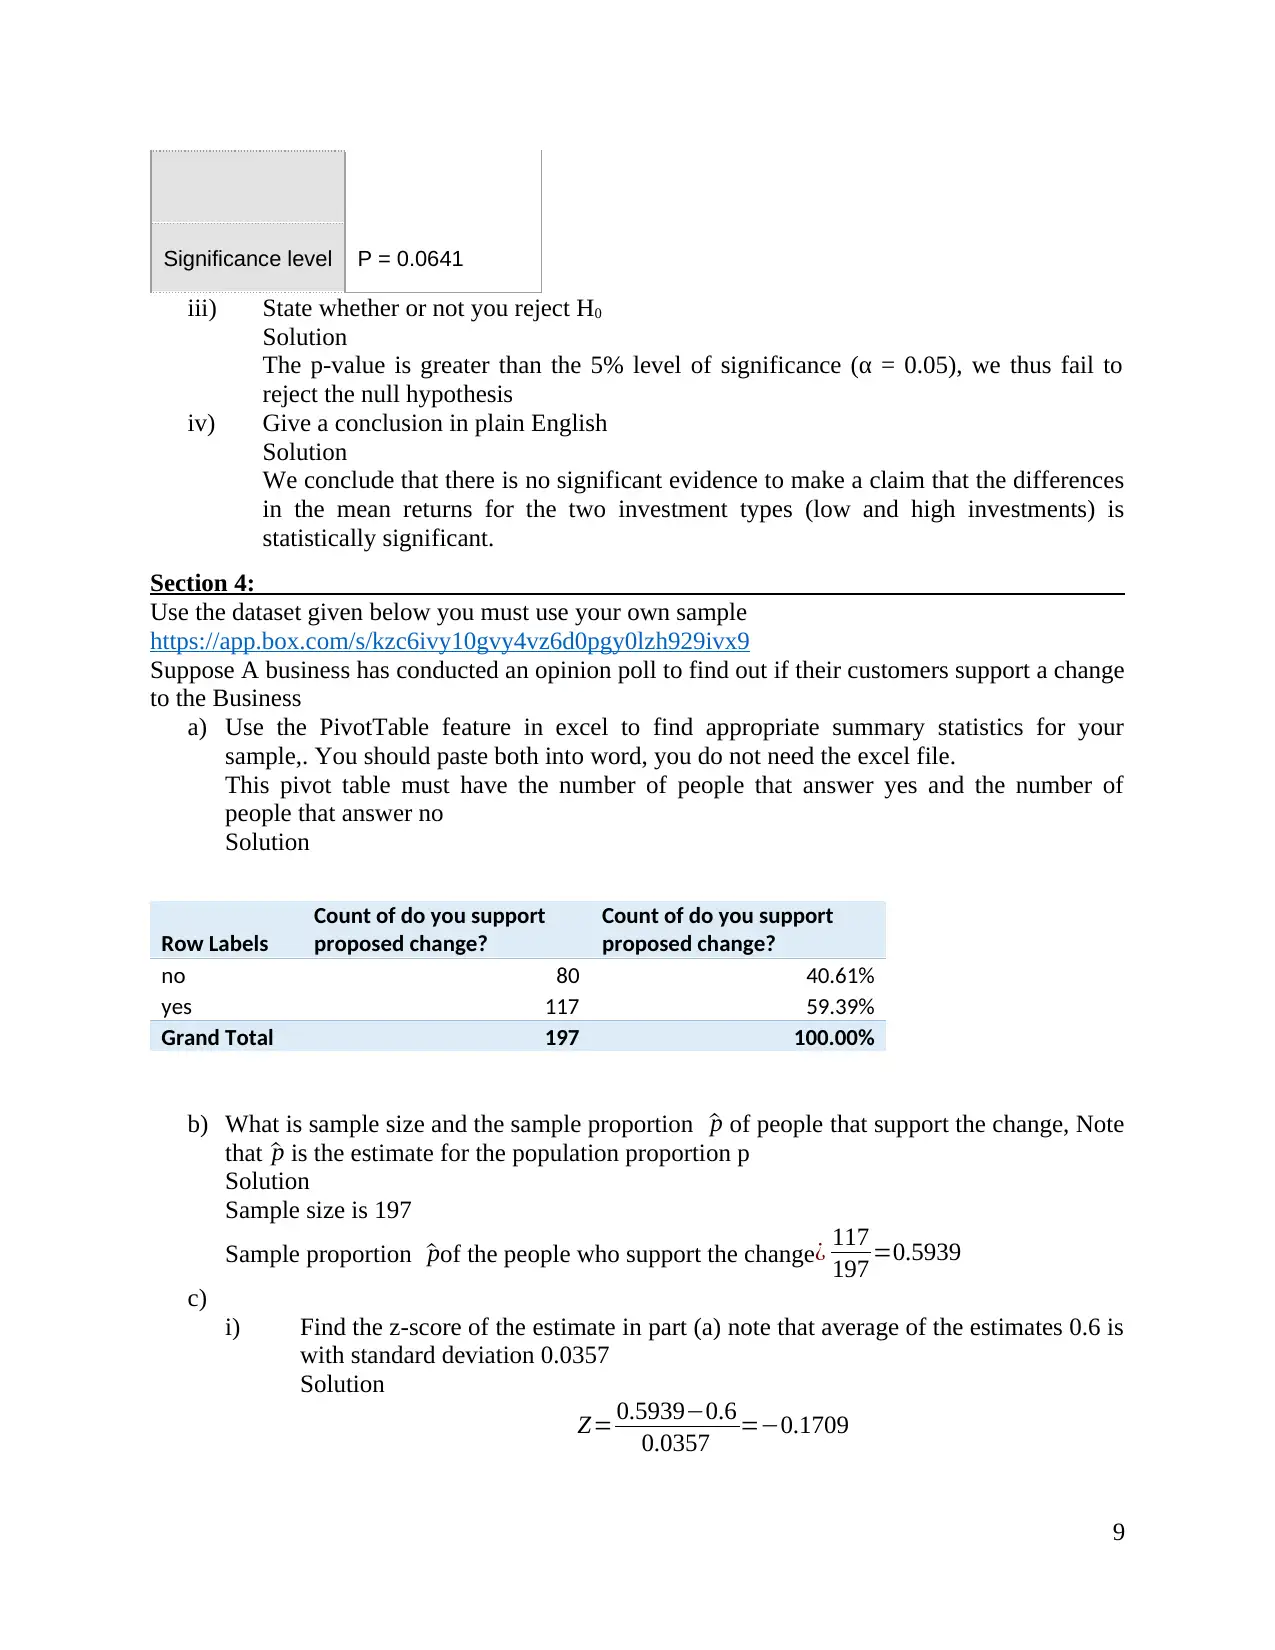
Significance level P = 0.0641
iii) State whether or not you reject H0
Solution
The p-value is greater than the 5% level of significance (α = 0.05), we thus fail to
reject the null hypothesis
iv) Give a conclusion in plain English
Solution
We conclude that there is no significant evidence to make a claim that the differences
in the mean returns for the two investment types (low and high investments) is
statistically significant.
Section 4:
Use the dataset given below you must use your own sample
https://app.box.com/s/kzc6ivy10gvy4vz6d0pgy0lzh929ivx9
Suppose A business has conducted an opinion poll to find out if their customers support a change
to the Business
a) Use the PivotTable feature in excel to find appropriate summary statistics for your
sample,. You should paste both into word, you do not need the excel file.
This pivot table must have the number of people that answer yes and the number of
people that answer no
Solution
Row Labels
Count of do you support
proposed change?
Count of do you support
proposed change?
no 80 40.61%
yes 117 59.39%
Grand Total 197 100.00%
b) What is sample size and the sample proportion ^p of people that support the change, Note
that ^p is the estimate for the population proportion p
Solution
Sample size is 197
Sample proportion ^pof the people who support the change ¿ 117
197 =0.5939
c)
i) Find the z-score of the estimate in part (a) note that average of the estimates 0.6 is
with standard deviation 0.0357
Solution
Z= 0.5939−0.6
0.0357 =−0.1709
9
⊘ This is a preview!⊘
Do you want full access?
Subscribe today to unlock all pages.
Trusted by 1+ million students worldwide
ii) Using part (i) what is P(Z<z-score) you can find out the answer using
www.wolframalpha.com
For example if the z-score is 2 then enter P(Z<2) into www.wolframalpha.com
Solution
P(Z<z-score) = P(Z< -0.1709) = 0.4322
iii) If there was a list of 1000 estimates ranked from lowest to highest, what rank do
you think your would be close to, hint just use the formula
expected rank = P(Z<z-score)*1000
Solution
Expected rank = P(Z<z-score)*1000 = 0.4322*1000 = 433
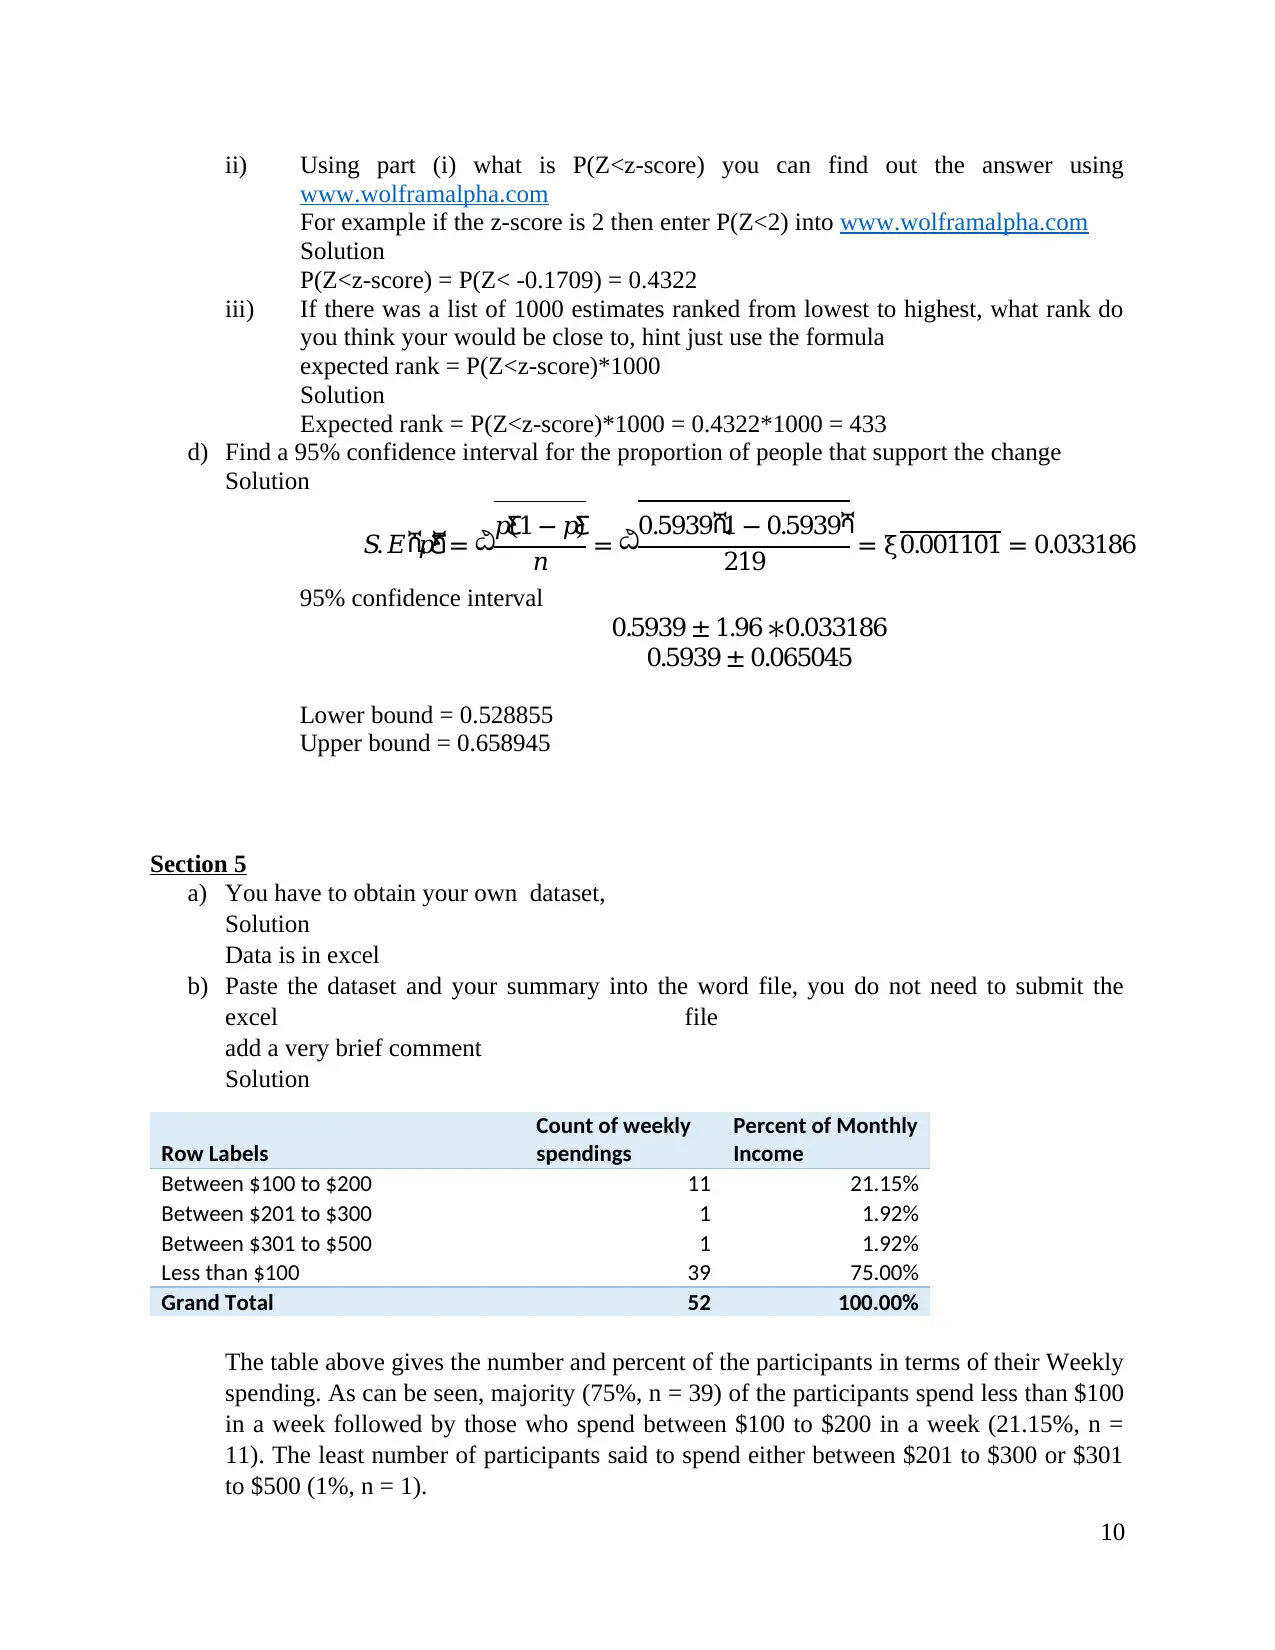
d) Find a 95% confidence interval for the proportion of people that support the change
Solution
𝑆.𝐸ሺ𝑝Ƹሻ= ඨ𝑝Ƹ(1 − 𝑝Ƹ)
𝑛 = ඨ0.5939ሺ1 − 0.5939ሻ
219 = ξ0.001101 = 0.033186
95% confidence interval
0.5939 ± 1.96 ∗0.033186
0.5939 ± 0.065045
Lower bound = 0.528855
Upper bound = 0.658945
Section 5
a) You have to obtain your own dataset,
Solution
Data is in excel
b) Paste the dataset and your summary into the word file, you do not need to submit the
excel file
add a very brief comment
Solution
Row Labels
Count of weekly
spendings
Percent of Monthly
Income
Between $100 to $200 11 21.15%
Between $201 to $300 1 1.92%
Between $301 to $500 1 1.92%
Less than $100 39 75.00%
Grand Total 52 100.00%
The table above gives the number and percent of the participants in terms of their Weekly
spending. As can be seen, majority (75%, n = 39) of the participants spend less than $100
in a week followed by those who spend between $100 to $200 in a week (21.15%, n =
11). The least number of participants said to spend either between $201 to $300 or $301
to $500 (1%, n = 1).
10
www.wolframalpha.com
For example if the z-score is 2 then enter P(Z<2) into www.wolframalpha.com
Solution
P(Z<z-score) = P(Z< -0.1709) = 0.4322
iii) If there was a list of 1000 estimates ranked from lowest to highest, what rank do
you think your would be close to, hint just use the formula
expected rank = P(Z<z-score)*1000
Solution
Expected rank = P(Z<z-score)*1000 = 0.4322*1000 = 433
d) Find a 95% confidence interval for the proportion of people that support the change
Solution
𝑆.𝐸ሺ𝑝Ƹሻ= ඨ𝑝Ƹ(1 − 𝑝Ƹ)
𝑛 = ඨ0.5939ሺ1 − 0.5939ሻ
219 = ξ0.001101 = 0.033186
95% confidence interval
0.5939 ± 1.96 ∗0.033186
0.5939 ± 0.065045
Lower bound = 0.528855
Upper bound = 0.658945
Section 5
a) You have to obtain your own dataset,
Solution
Data is in excel
b) Paste the dataset and your summary into the word file, you do not need to submit the
excel file
add a very brief comment
Solution
Row Labels
Count of weekly
spendings
Percent of Monthly
Income
Between $100 to $200 11 21.15%
Between $201 to $300 1 1.92%
Between $301 to $500 1 1.92%
Less than $100 39 75.00%
Grand Total 52 100.00%
The table above gives the number and percent of the participants in terms of their Weekly
spending. As can be seen, majority (75%, n = 39) of the participants spend less than $100
in a week followed by those who spend between $100 to $200 in a week (21.15%, n =
11). The least number of participants said to spend either between $201 to $300 or $301
to $500 (1%, n = 1).
10
Paraphrase This Document
Need a fresh take? Get an instant paraphrase of this document with our AI Paraphraser
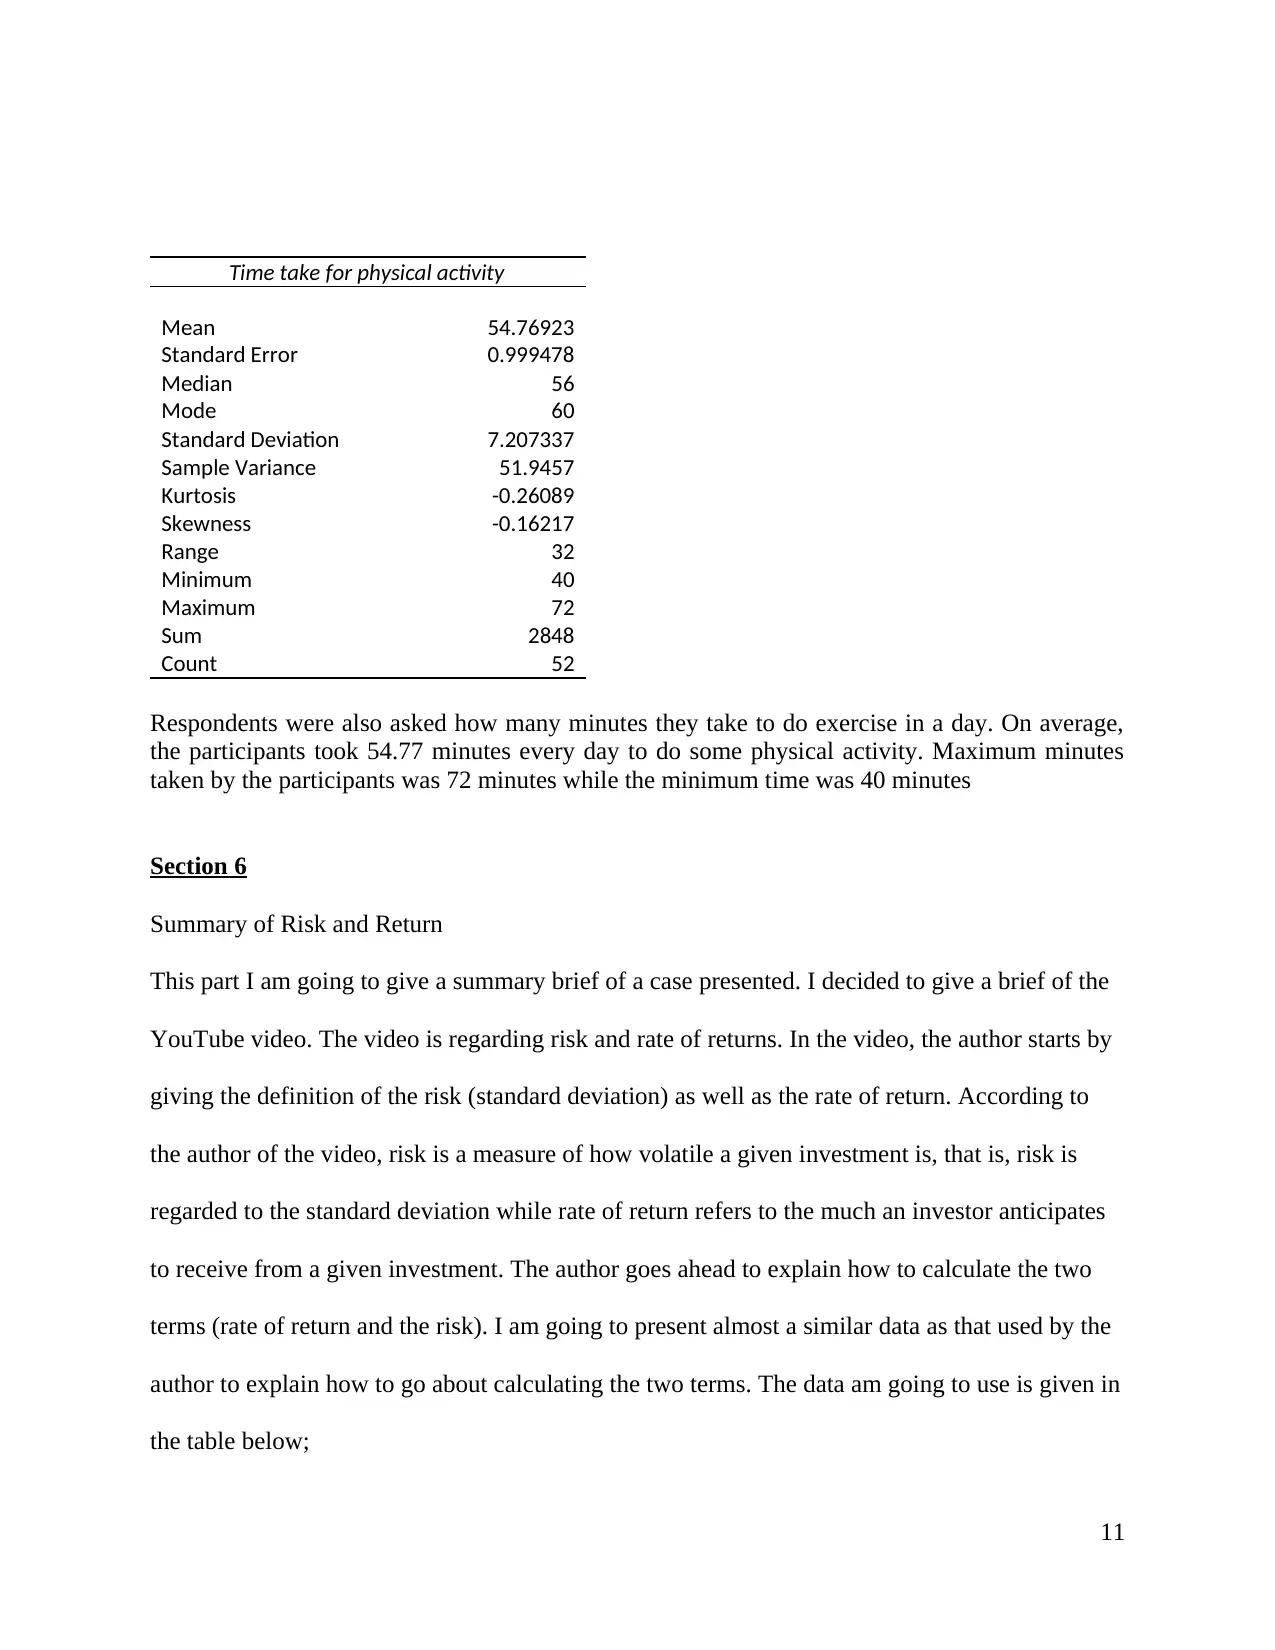
Time take for physical activity
Mean 54.76923
Standard Error 0.999478
Median 56
Mode 60
Standard Deviation 7.207337
Sample Variance 51.9457
Kurtosis -0.26089
Skewness -0.16217
Range 32
Minimum 40
Maximum 72
Sum 2848
Count 52
Respondents were also asked how many minutes they take to do exercise in a day. On average,
the participants took 54.77 minutes every day to do some physical activity. Maximum minutes
taken by the participants was 72 minutes while the minimum time was 40 minutes
Section 6
Summary of Risk and Return
This part I am going to give a summary brief of a case presented. I decided to give a brief of the
YouTube video. The video is regarding risk and rate of returns. In the video, the author starts by
giving the definition of the risk (standard deviation) as well as the rate of return. According to
the author of the video, risk is a measure of how volatile a given investment is, that is, risk is
regarded to the standard deviation while rate of return refers to the much an investor anticipates
to receive from a given investment. The author goes ahead to explain how to calculate the two
terms (rate of return and the risk). I am going to present almost a similar data as that used by the
author to explain how to go about calculating the two terms. The data am going to use is given in
the table below;
11
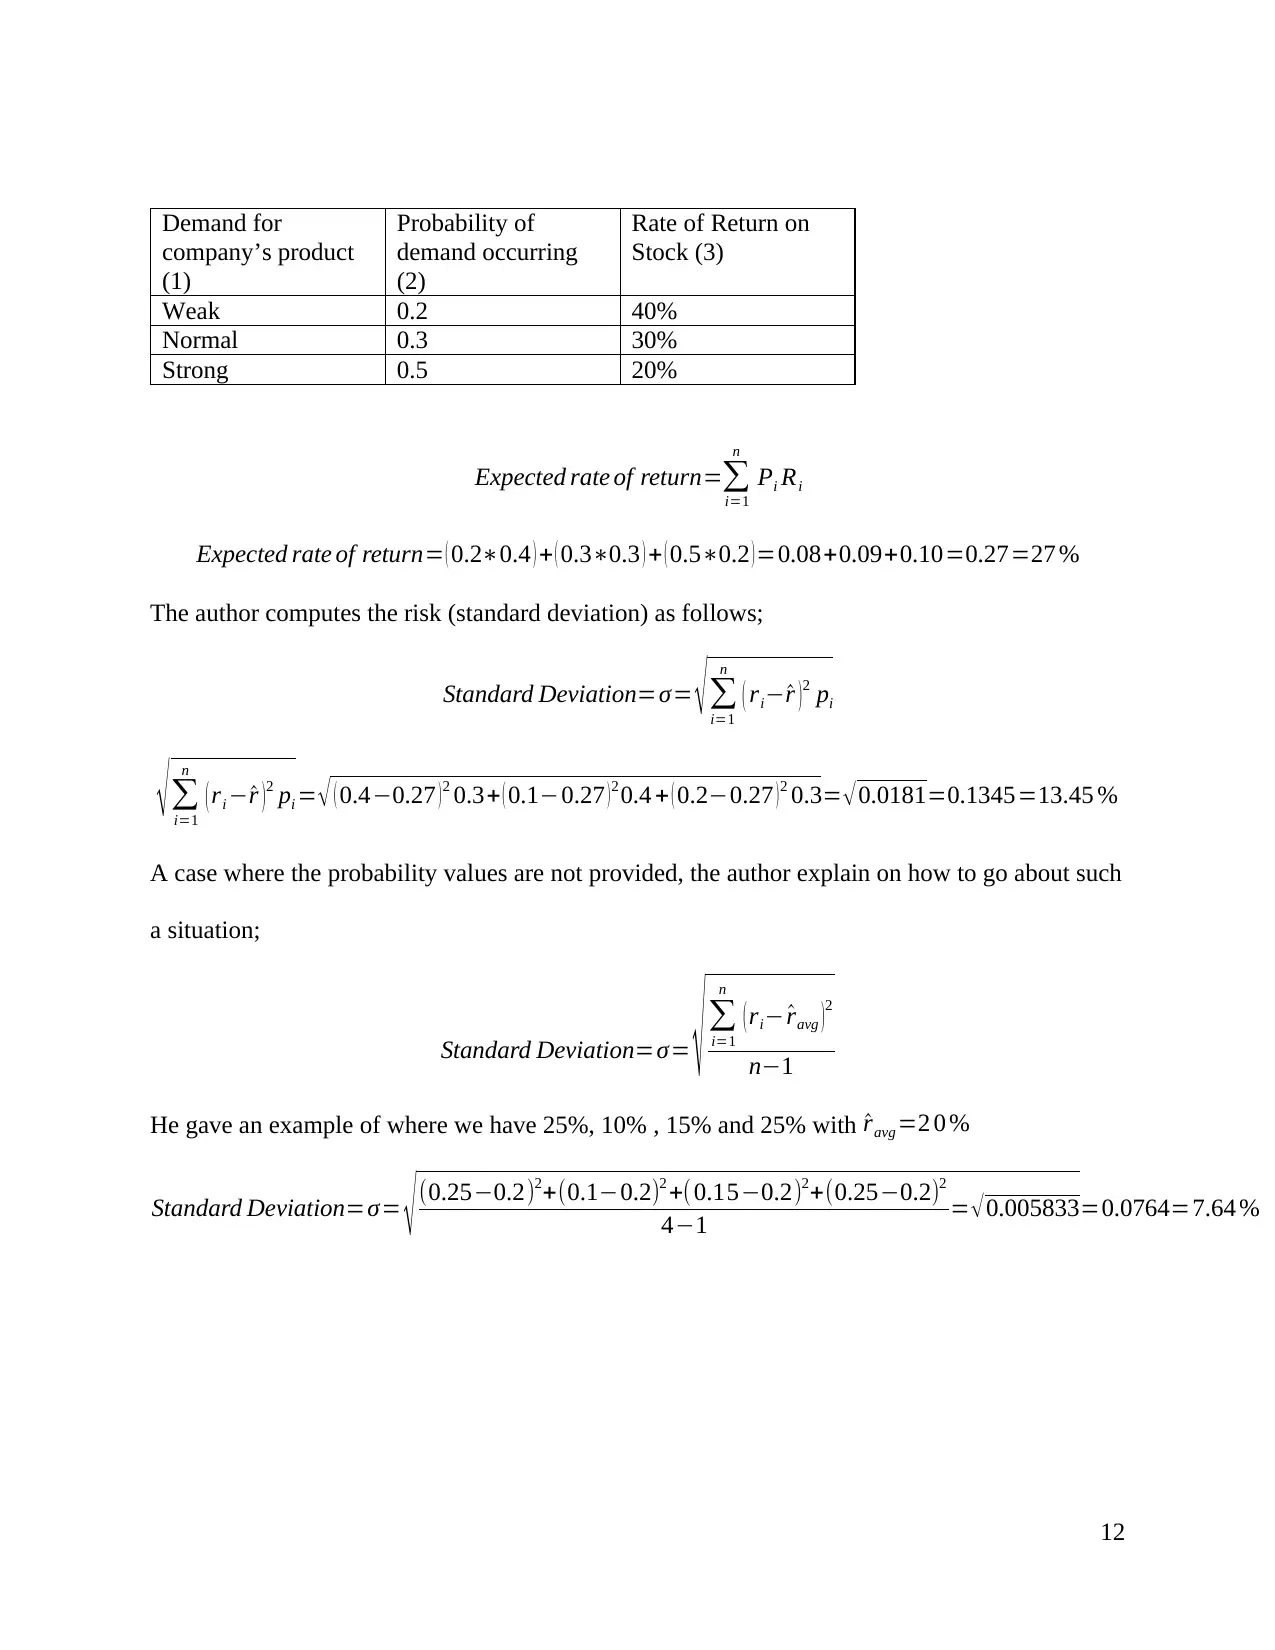
Demand for
company’s product
(1)
Probability of
demand occurring
(2)
Rate of Return on
Stock (3)
Weak 0.2 40%
Normal 0.3 30%
Strong 0.5 20%
Expected rate of return=∑
i=1
n
Pi Ri
Expected rate of return= ( 0.2∗0.4 ) + ( 0.3∗0.3 ) + ( 0.5∗0.2 )=0.08+0.09+0.10=0.27=27 %
The author computes the risk (standard deviation) as follows;
Standard Deviation=σ= √∑
i=1
n
( ri− ^r )2 pi
√ ∑
i=1
n
( ri − ^r )
2 pi = √ ( 0.4−0.27 ) 2 0.3+ ( 0.1−0.27 ) 2 0.4 + ( 0.2−0.27 ) 2 0.3= √ 0.0181=0.1345=13.45 %
A case where the probability values are not provided, the author explain on how to go about such
a situation;
Standard Deviation=σ= √∑
i=1
n
( ri− ^ravg )2
n−1
He gave an example of where we have 25%, 10% , 15% and 25% with ^ravg =2 0 %
Standard Deviation=σ= √ (0.25−0.2)2+(0.1−0.2)2 +( 0.15−0.2)2+(0.25−0.2)2
4−1 = √ 0.005833=0.0764=7.64 %
12
⊘ This is a preview!⊘
Do you want full access?
Subscribe today to unlock all pages.
Trusted by 1+ million students worldwide
1 out of 12
Related Documents


Your All-in-One AI-Powered Toolkit for Academic Success.
+13062052269
info@desklib.com
Available 24*7 on WhatsApp / Email
![[object Object]](/_next/static/media/star-bottom.7253800d.svg)
Unlock your academic potential
Copyright © 2020–2026 A2Z Services. All Rights Reserved. Developed and managed by ZUCOL.