Business Statistics | Assignment | Part B
Added on 2022-09-22
9 Pages1163 Words19 Views
PART B
Question 1: Understanding your data
(a) Qualitative variable: Live in a large city is a nominal variable because it gives
categories which is either yes or no.
Quantitative variable: Wife’s hours of work in 1975 which is continuous variable
because it measured through counting.
(b) The data is cross sectional because it is a one point of time collection of data in 1975. In a
cross-sectional study, a snap point of information is collected without considering what
happens after data collection.
(c) The proportion of working women having children under the age of 6 is given by
53/500*100% which approximately 9%.
Question 2: Preliminary analysis
(a) Compare the hourly wage, on average, for women who:
i. Have preschool children (less than 6 years old) vs. no preschool child/children
920.9; 41%
1350.6; 59%
Have preschool children (less than 6 years old)
No preschool child/children
Figure 1
1
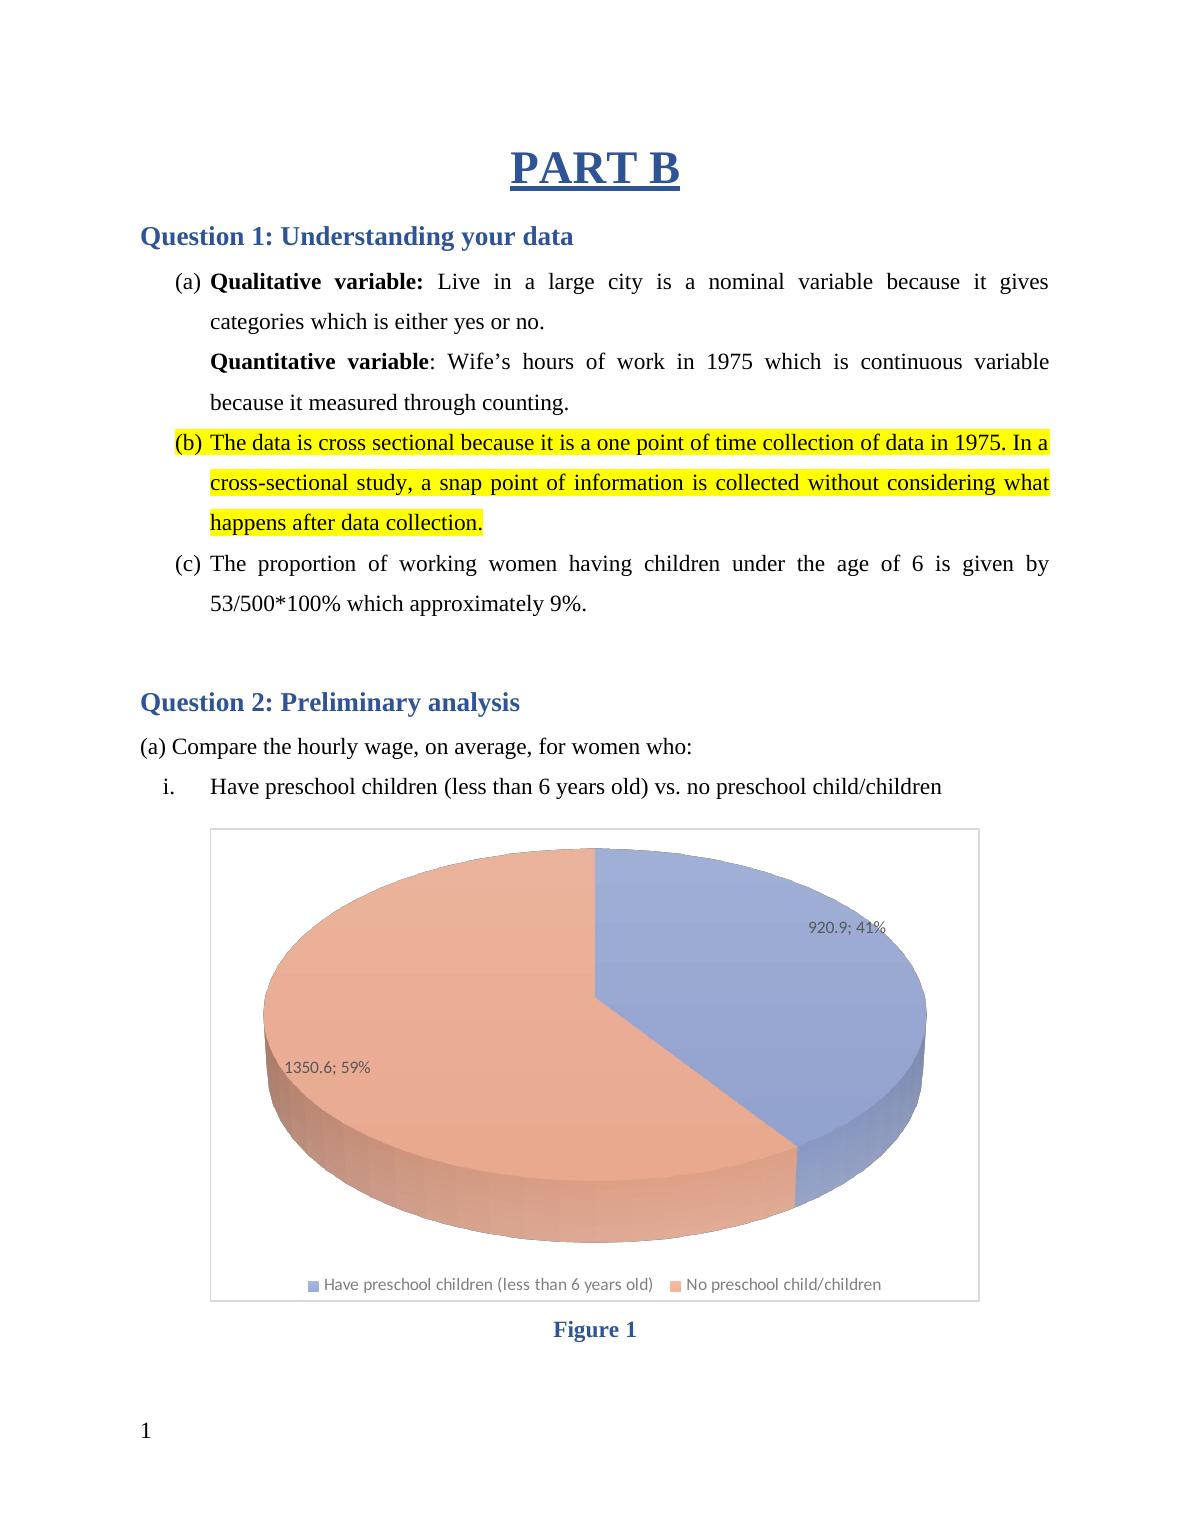
The hourly wage, on average, for women who have preschool children (less than 6 years old) is
higher; 59% compared to those without preschool child/children as shown in the figure above.
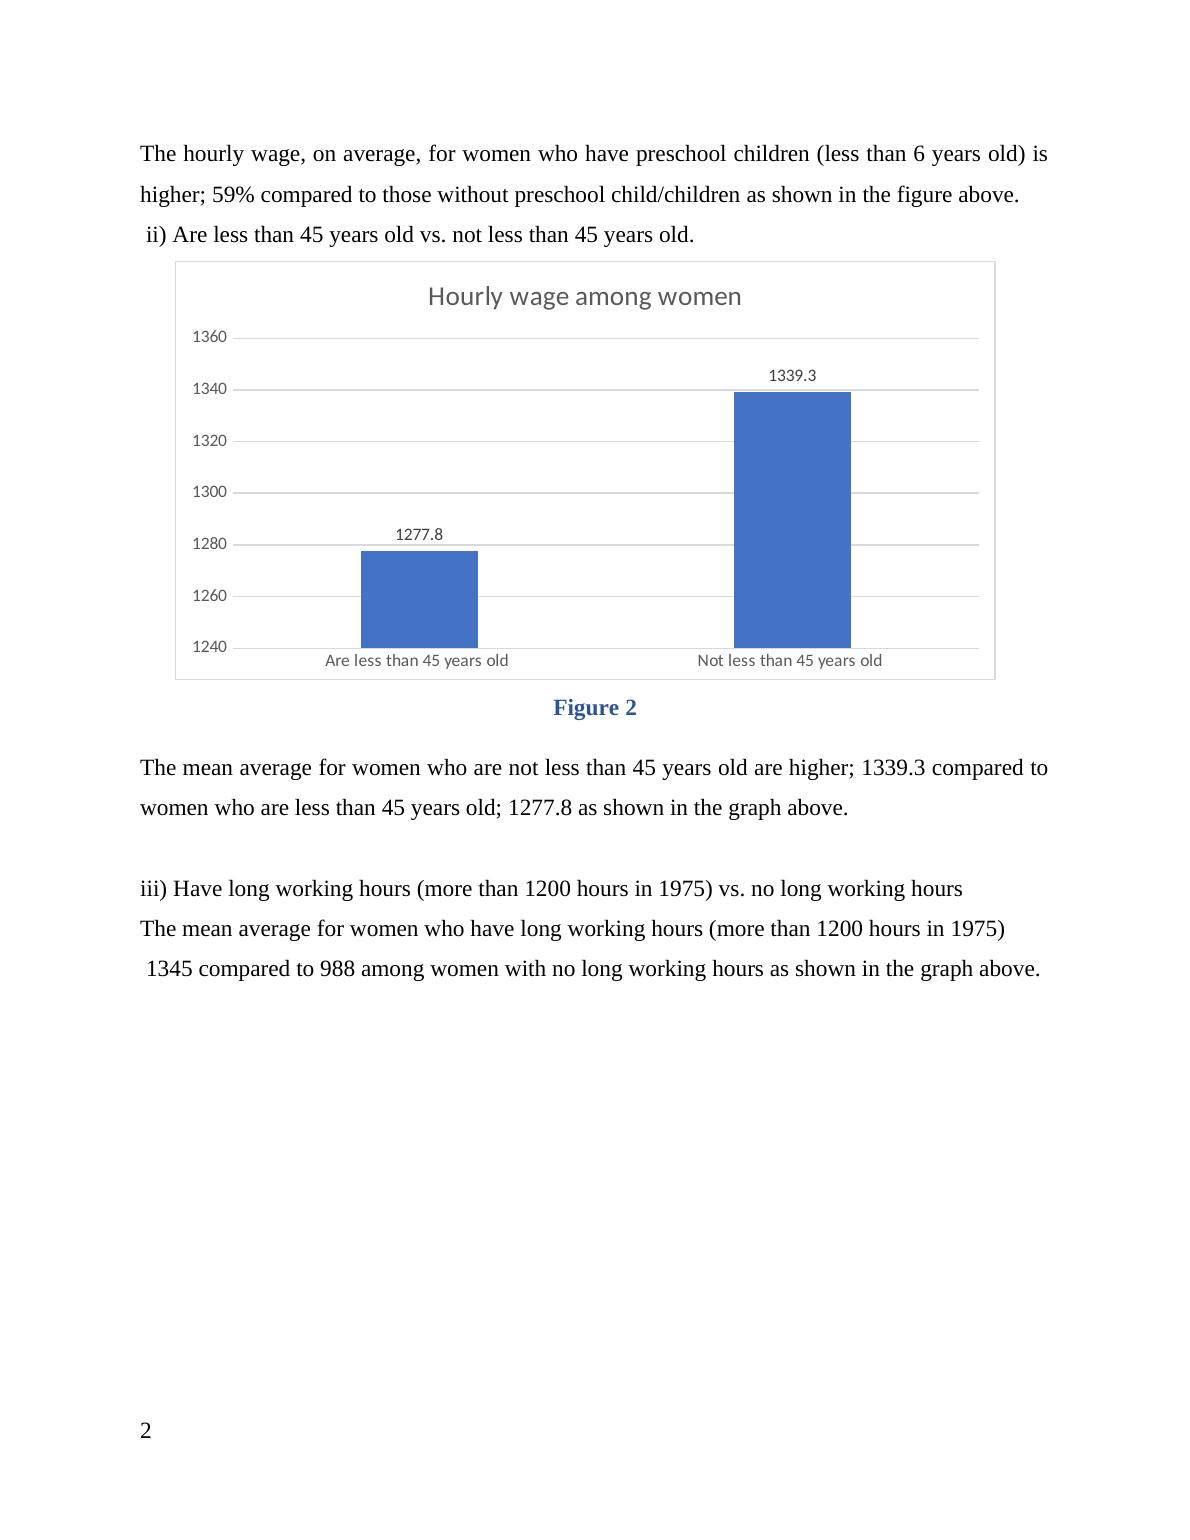
ii) Are less than 45 years old vs. not less than 45 years old.
Are less than 45 years old Not less than 45 years old
1240
1260
1280
1300
1320
1340
1360
1277.8
1339.3
Hourly wage among women
Figure 2
The mean average for women who are not less than 45 years old are higher; 1339.3 compared to
women who are less than 45 years old; 1277.8 as shown in the graph above.
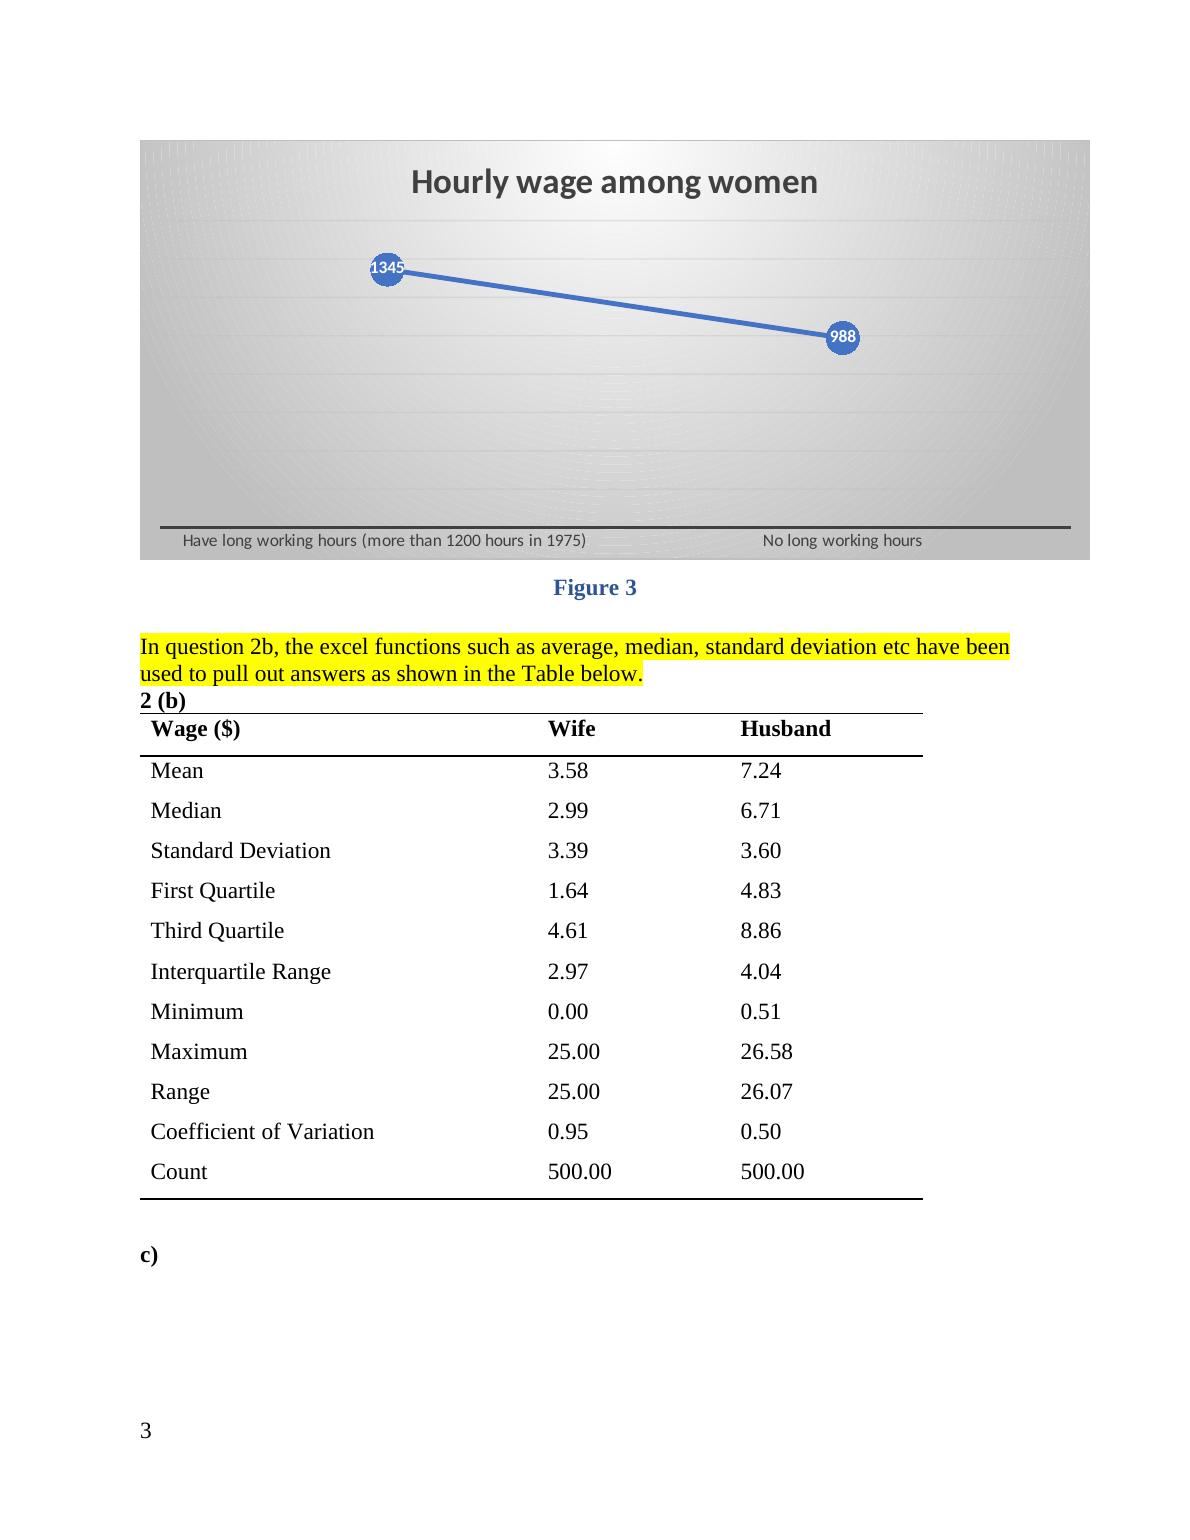
iii) Have long working hours (more than 1200 hours in 1975) vs. no long working hours
The mean average for women who have long working hours (more than 1200 hours in 1975)
1345 compared to 988 among women with no long working hours as shown in the graph above.
2
higher; 59% compared to those without preschool child/children as shown in the figure above.
ii) Are less than 45 years old vs. not less than 45 years old.
Are less than 45 years old Not less than 45 years old
1240
1260
1280
1300
1320
1340
1360
1277.8
1339.3
Hourly wage among women
Figure 2
The mean average for women who are not less than 45 years old are higher; 1339.3 compared to
women who are less than 45 years old; 1277.8 as shown in the graph above.
iii) Have long working hours (more than 1200 hours in 1975) vs. no long working hours
The mean average for women who have long working hours (more than 1200 hours in 1975)
1345 compared to 988 among women with no long working hours as shown in the graph above.
2
Have long working hours (more than 1200 hours in 1975) No long working hours
1345
988
Hourly wage among women
Figure 3
In question 2b, the excel functions such as average, median, standard deviation etc have been
used to pull out answers as shown in the Table below.
2 (b)
Wage ($) Wife Husband
Mean 3.58 7.24
Median 2.99 6.71
Standard Deviation 3.39 3.60
First Quartile 1.64 4.83
Third Quartile 4.61 8.86
Interquartile Range 2.97 4.04
Minimum 0.00 0.51
Maximum 25.00 26.58
Range 25.00 26.07
Coefficient of Variation 0.95 0.50
Count 500.00 500.00
c)
3
End of preview
Want to access all the pages? Upload your documents or become a member.