Statistics Report: Statistical Analysis of Domestic Beer Data
VerifiedAdded on 2020/07/22
|27
|2894
|88
Report
AI Summary
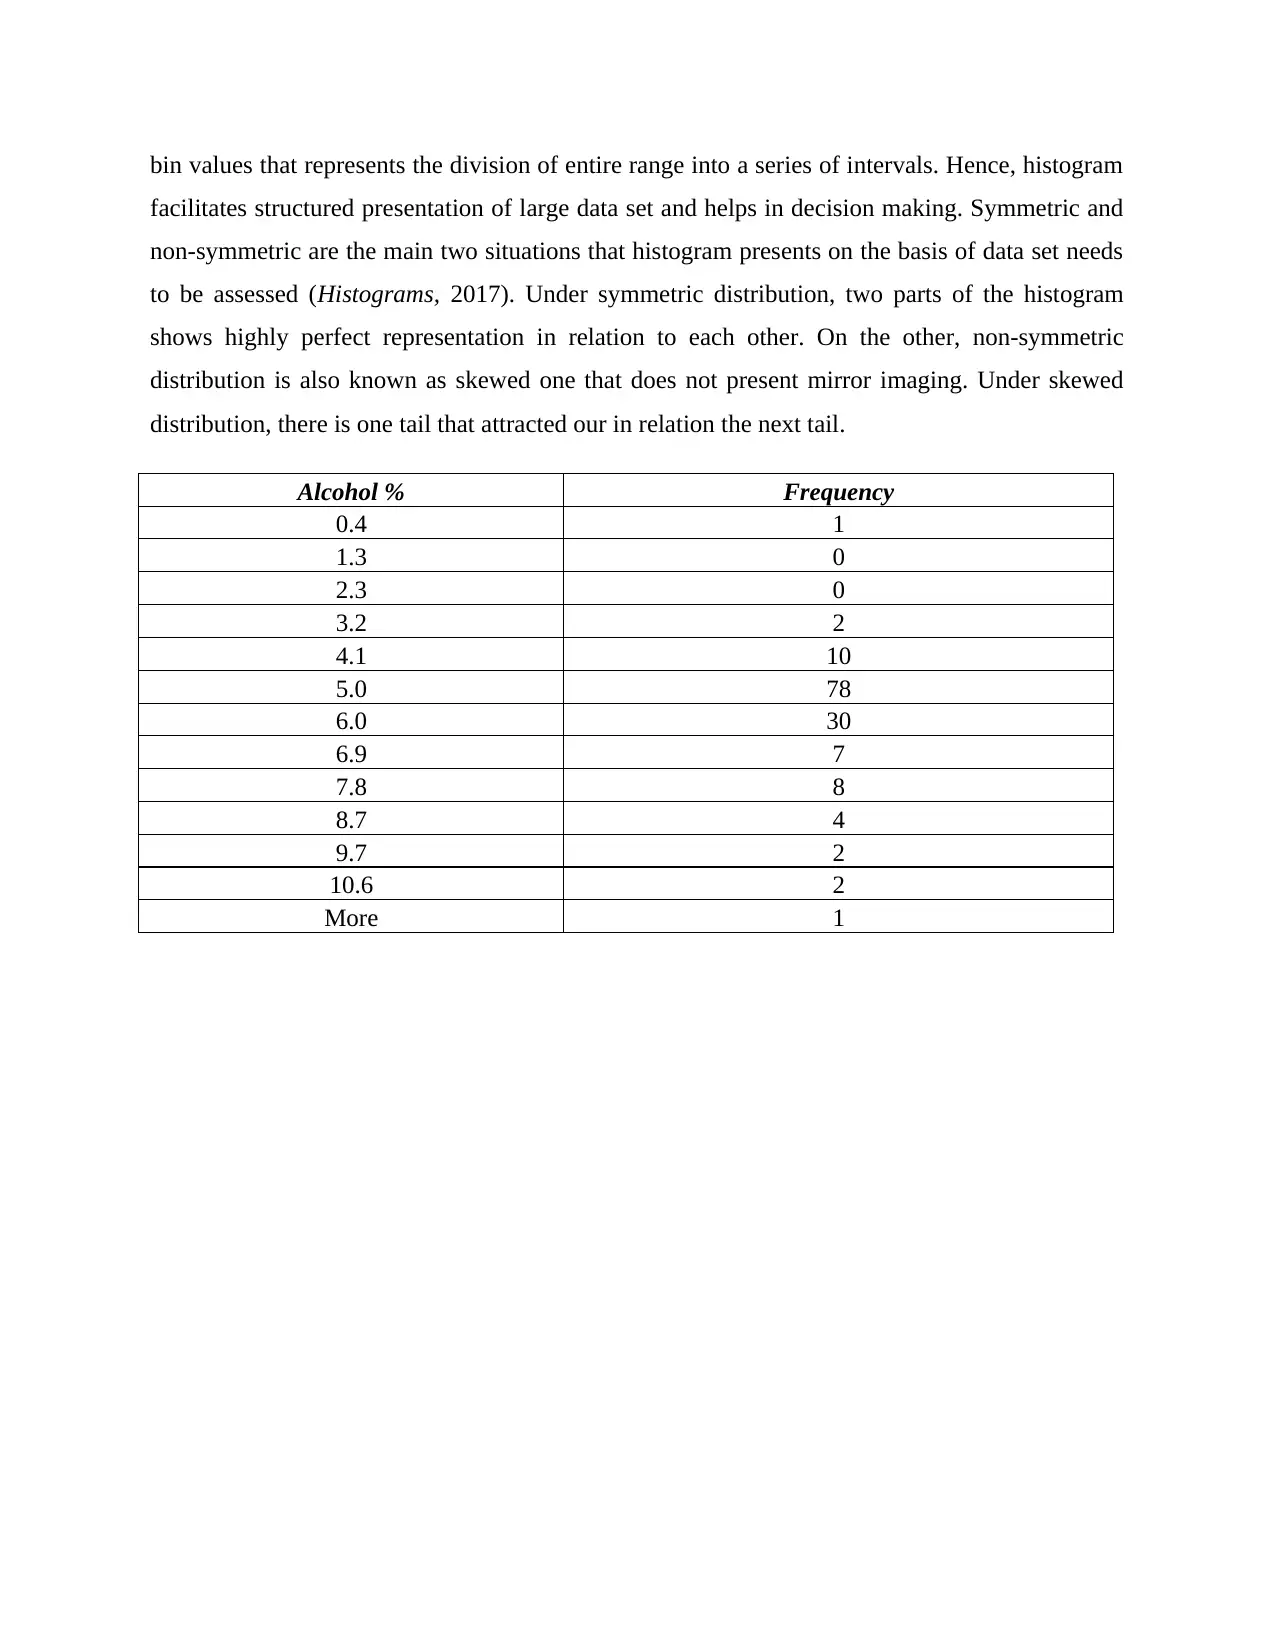
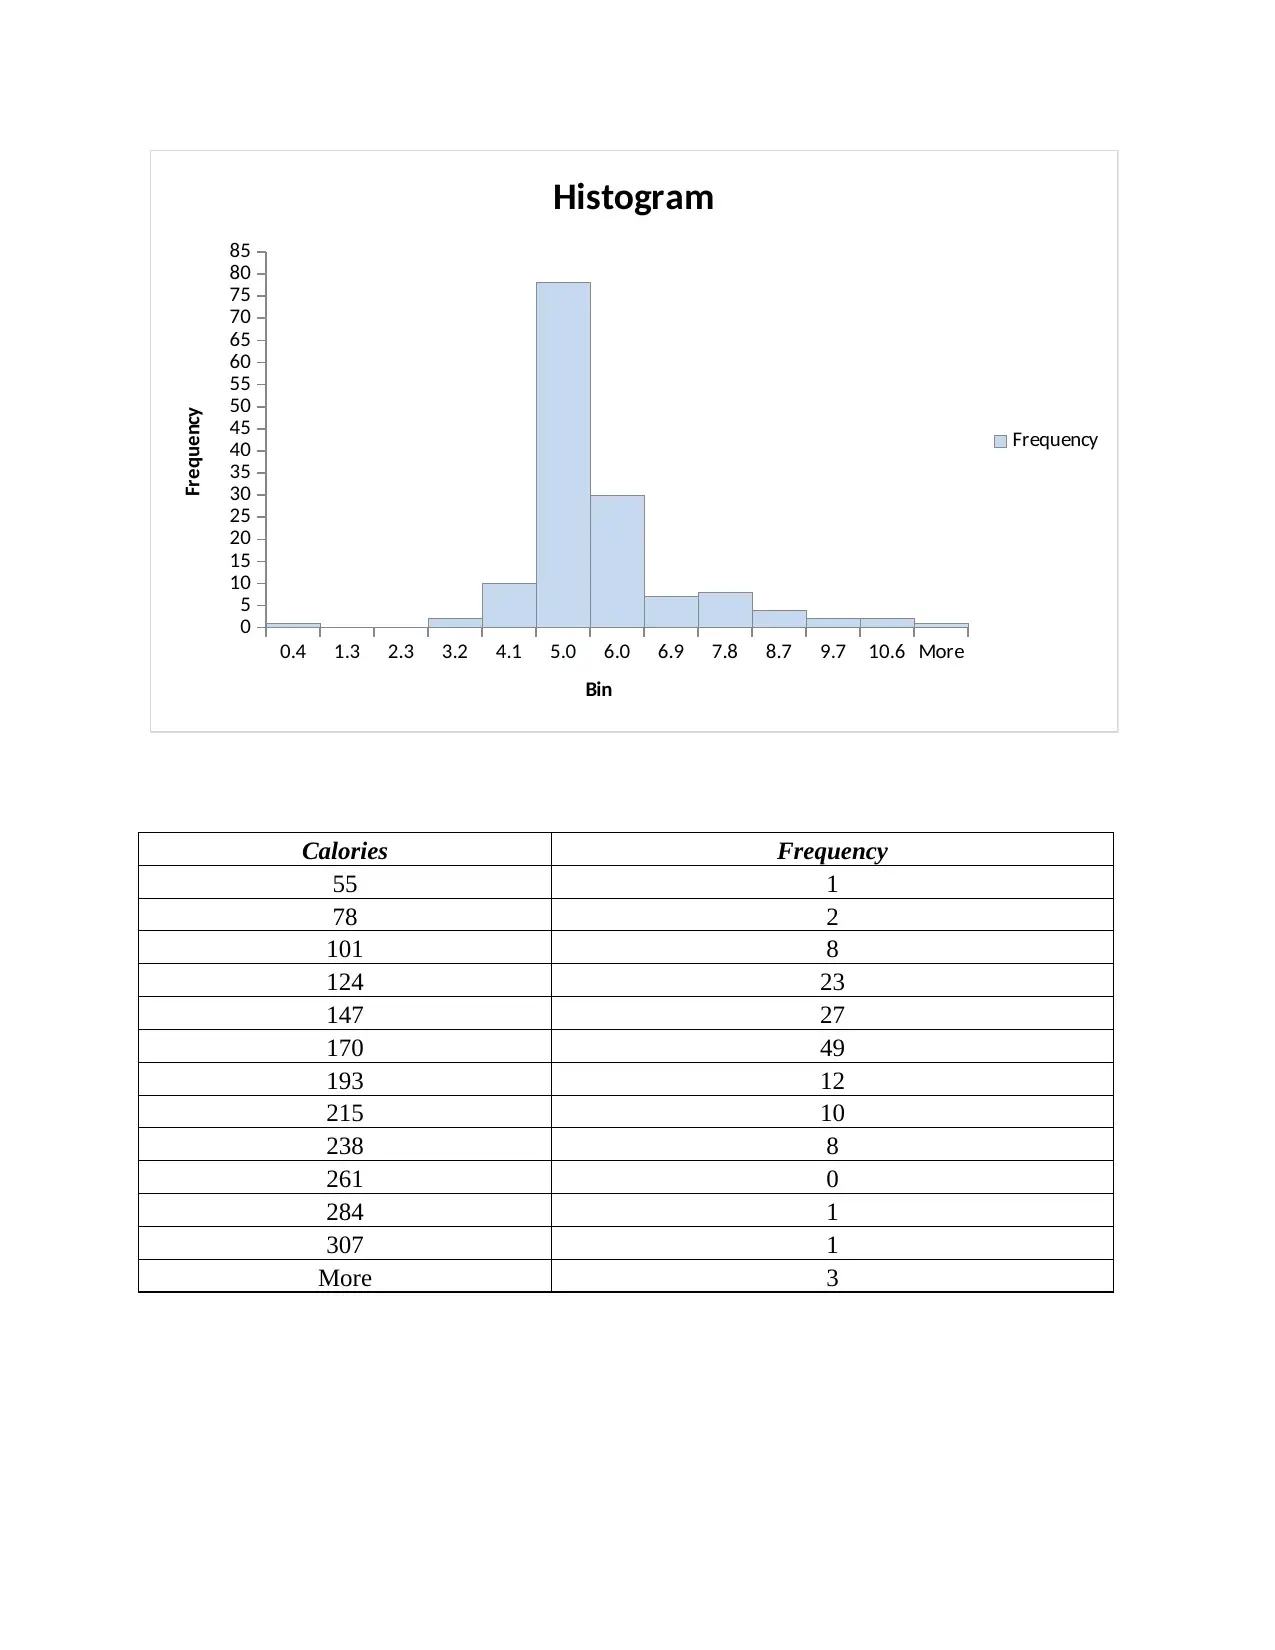
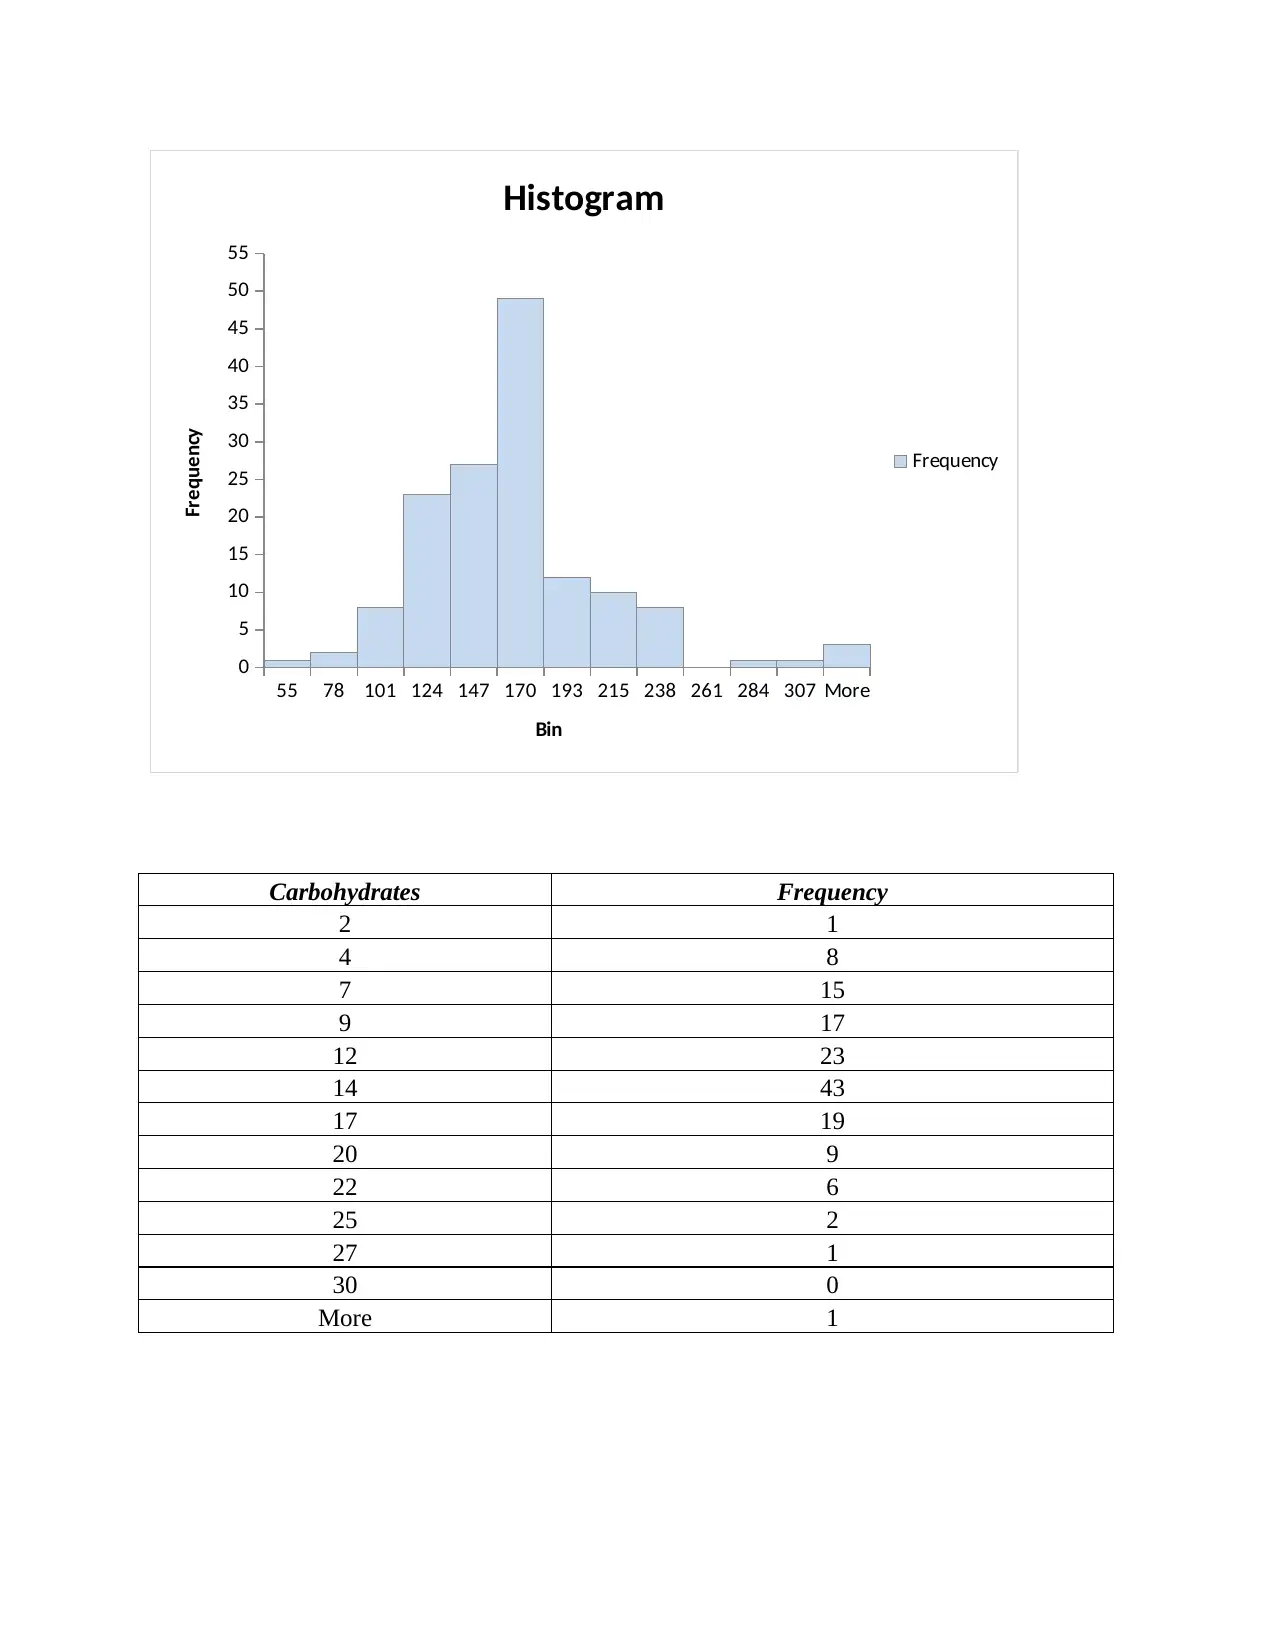
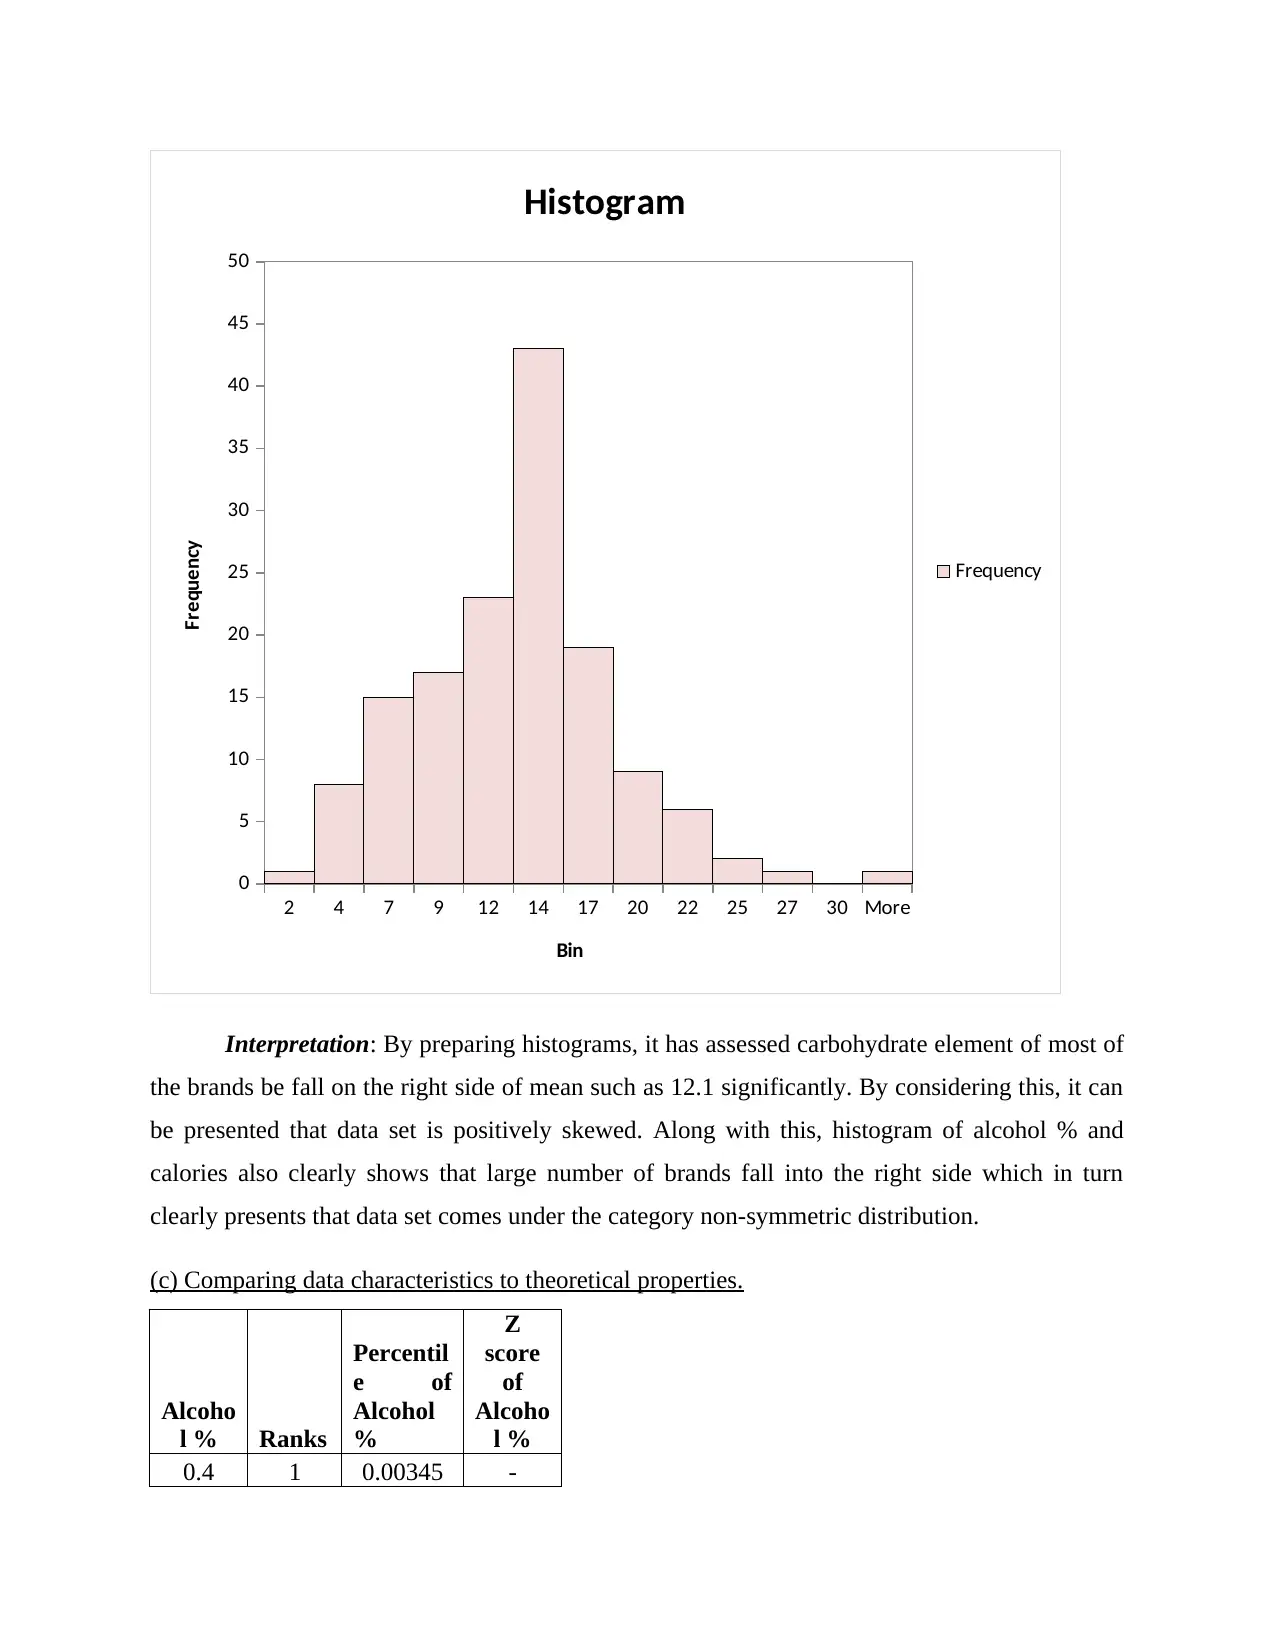
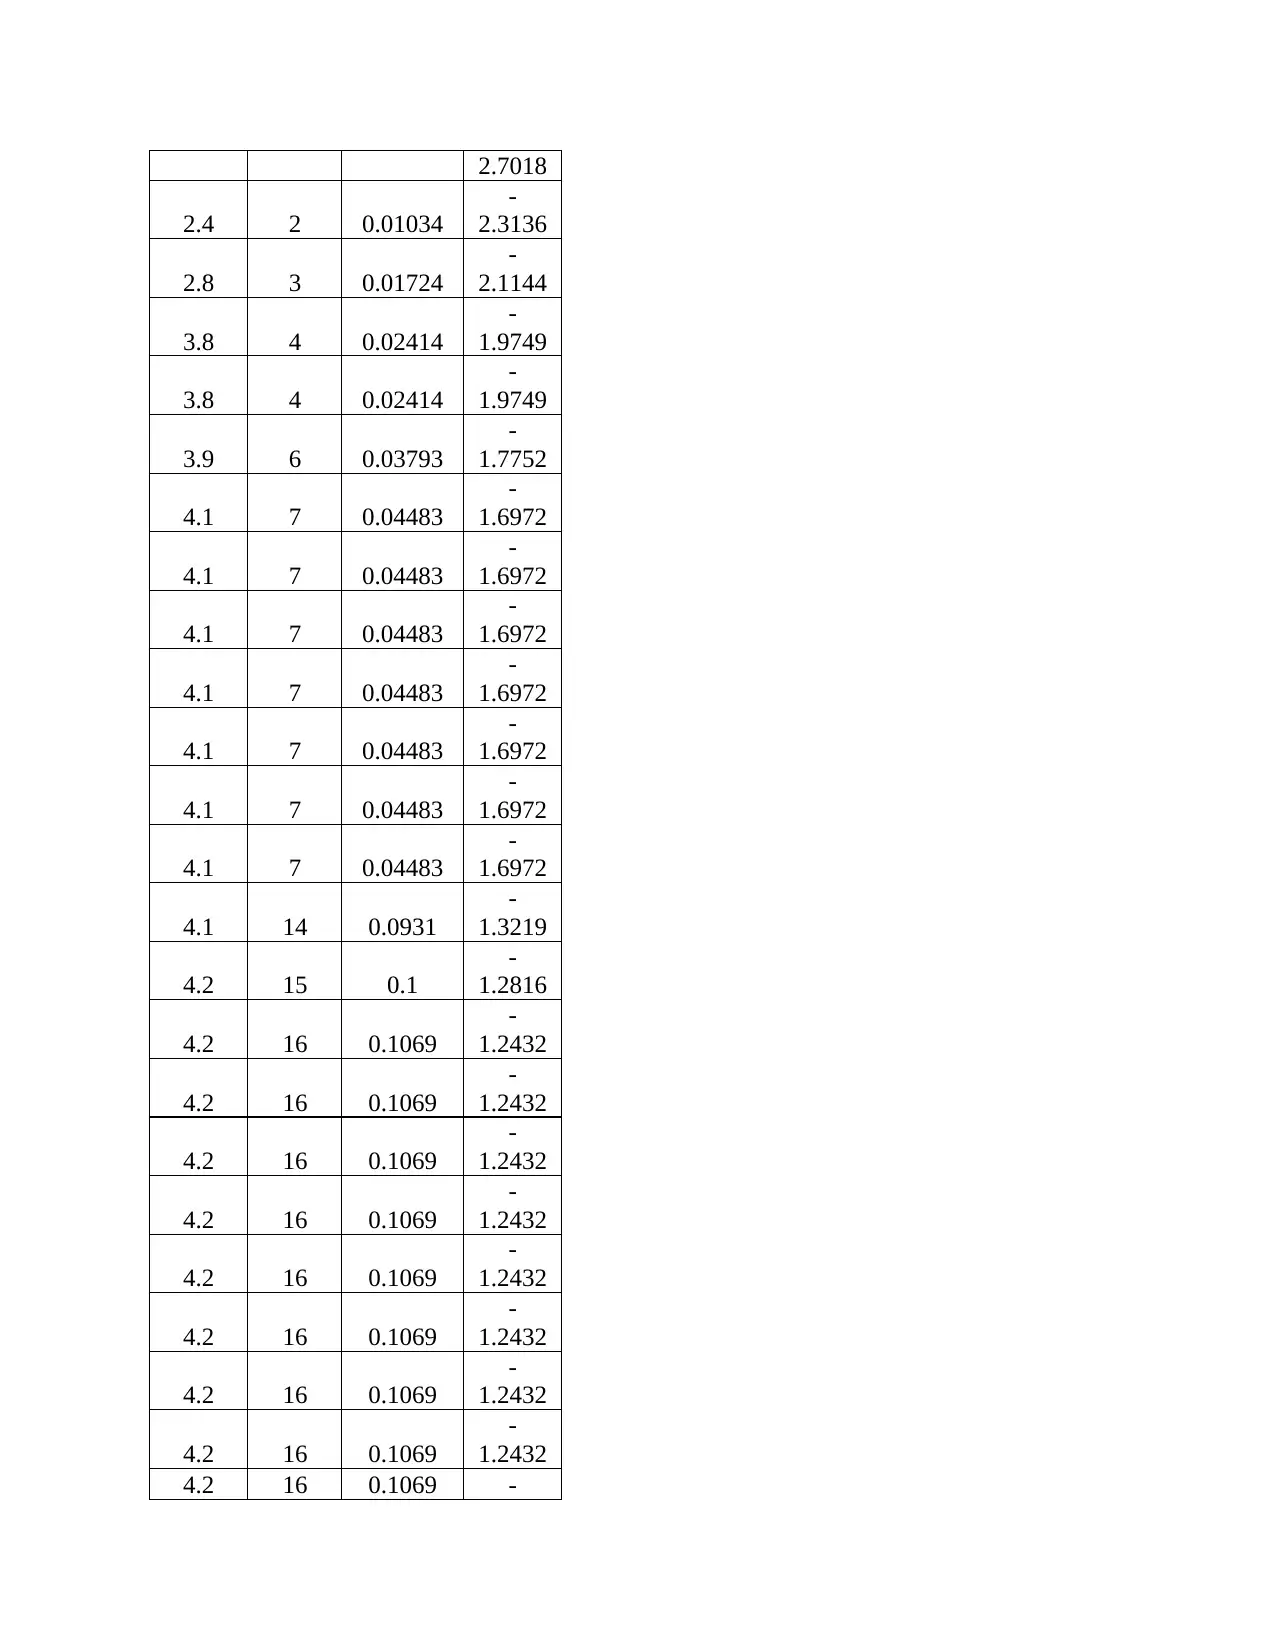
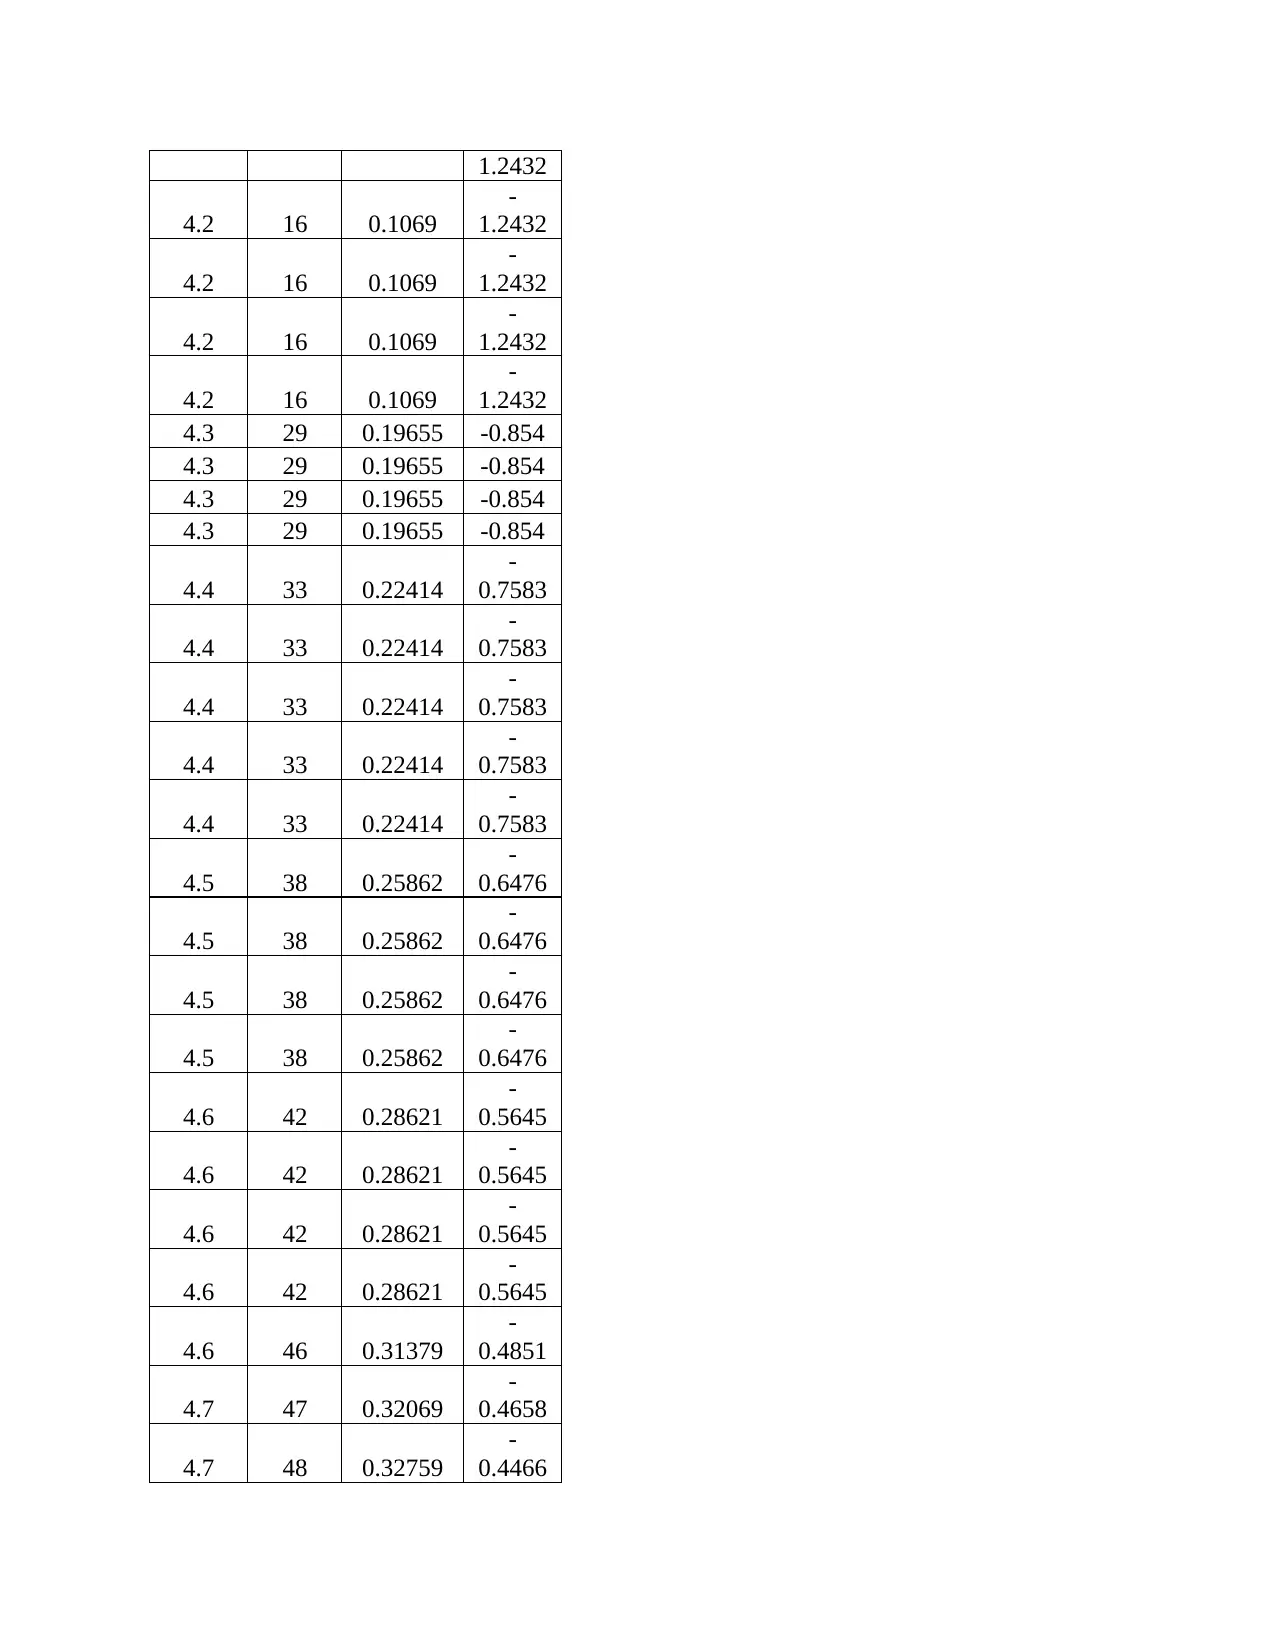
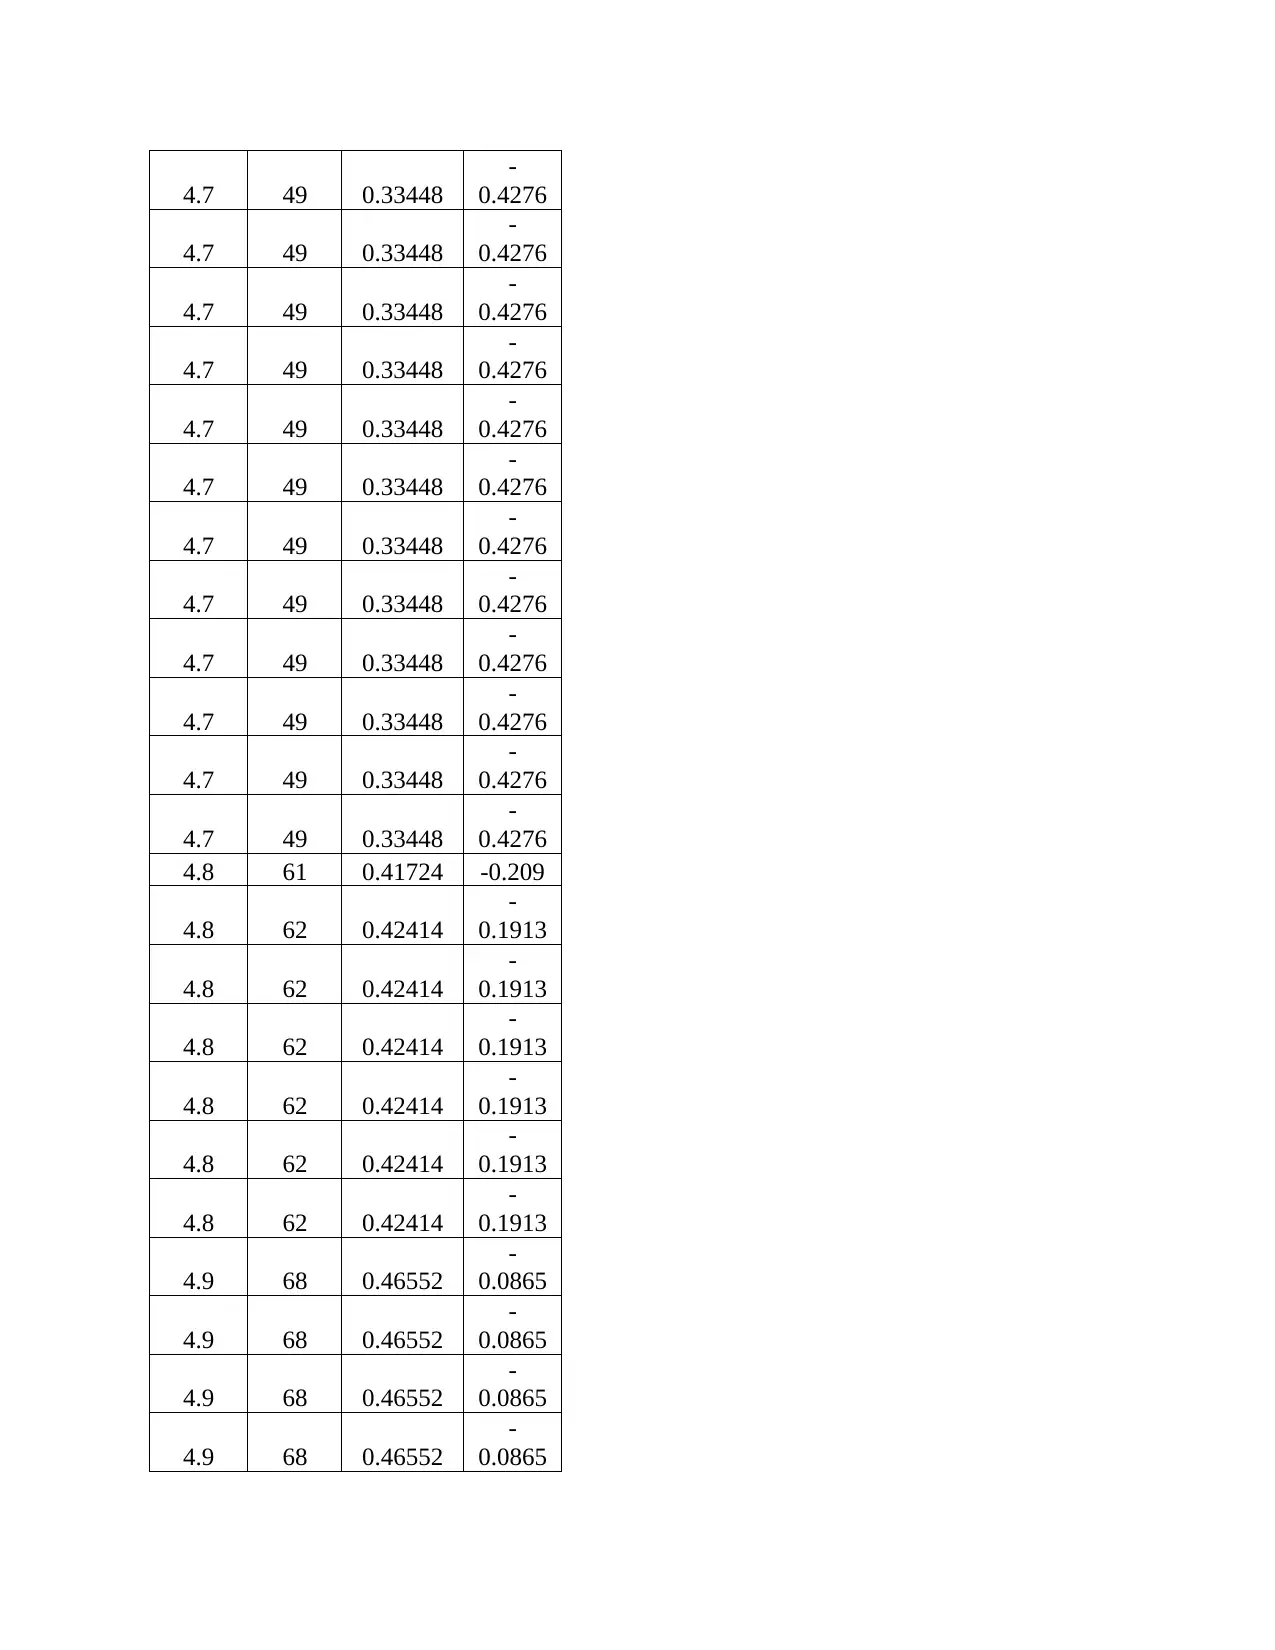
This report presents a statistical analysis of a domestic beer dataset, employing various statistical tools to understand the data's characteristics and distribution. The analysis begins with constructing and interpreting box plots to visualize data distribution based on key numerical values like minimum, maximum, quartiles, and median, revealing insights into the alcohol percentage, calorie content, and carbohydrate levels of different beer brands. The report then proceeds to construct and interpret histograms for the same variables, providing a visual representation of the frequency distribution and identifying whether the data follows a symmetric or skewed distribution. Finally, the report compares data characteristics to theoretical properties using rank, percentile, and Z-scores, constructing a normal probability plot (quantile-quantile plot) to assess the data's adherence to a normal distribution. The analysis aims to provide a comprehensive understanding of the dataset, highlighting the utility of these statistical tools in data interpretation and decision-making within the context of business statistics.

1 out of 27
Related Documents


Your All-in-One AI-Powered Toolkit for Academic Success.
+13062052269
info@desklib.com
Available 24*7 on WhatsApp / Email
![[object Object]](/_next/static/media/star-bottom.7253800d.svg)
Copyright © 2020–2026 A2Z Services. All Rights Reserved. Developed and managed by ZUCOL.