Schmeckt Gut's Energy Bar Sales Forecasting
VerifiedAdded on 2020/04/13
|9
|1214
|114
AI Summary
This assignment focuses on forecasting the sales of Schmeckt Gut's energy bars in 2016. It utilizes a regression analysis model based on historical data and economic indicators like GDP growth, price index, population growth, customer satisfaction, and advertising expenditure. The assignment also explores alternative forecasting techniques such as trend analysis and exponential smoothing for comparison.
Contribute Materials
Your contribution can guide someone’s learning journey. Share your
documents today.

Running Head: BUSINESS STATISTICS FOR FINANCIAL DECISION
Business Statistics for Financial Decision
Name of the Student
Name of the University
Author note
Business Statistics for Financial Decision
Name of the Student
Name of the University
Author note
Secure Best Marks with AI Grader
Need help grading? Try our AI Grader for instant feedback on your assignments.
1BUSINESS STATISTICS FOR FINANCIAL DECISION
Table of Contents
Task a...............................................................................................................................................2
Statistical Overview of data.........................................................................................................2
Task b...............................................................................................................................................2
Correlation Analysis....................................................................................................................2
Task c...............................................................................................................................................3
Time Series Regression...............................................................................................................3
Task d...............................................................................................................................................5
Task e...............................................................................................................................................6
Methods of forecasting................................................................................................................6
References........................................................................................................................................8
2BUSINESS STATISTICS FOR FINANCIAL DECISION
Task a
Statistical Overview of data
The report analyses sales figures of Schmeckt Gut for the last 25years (1991-2015)and
tries to forecast sales for the year2016. The first explanatory variable considers here is the Gross
Domestic Product in US dollar capture the income development. The trend in prices is indicated
in terms of average increase in the price index. Population is another important factor determined
the sales of energy bar. The data on population for the age limit 15 to 65 years are studied. A
survey is conducted to measure the level of satisfaction from the energy bar consumption. The
satisfaction level is ranked from 0 to 10 where 0 implies not satisfied and 10 implies very
satisfied. In order to promote products company makes advertisement. Advertisement of energy
bars that is number of advertisement on an average. The last variable consideris the number of
stores from where energy bars can be purchased. All the chosen explanatory variables are likely
to have large influence on sales.
Task b
Correlation Analysis
Sales US$
Survey
score
Advertisemen
t Stores
Sales US$ 1
Survey score
0.58860101
9 1
Advertisemen
t
0.98623691
7
0.5483308
2 1
Stores
0.97110928
4
0.5289029
7 0.970966786 1
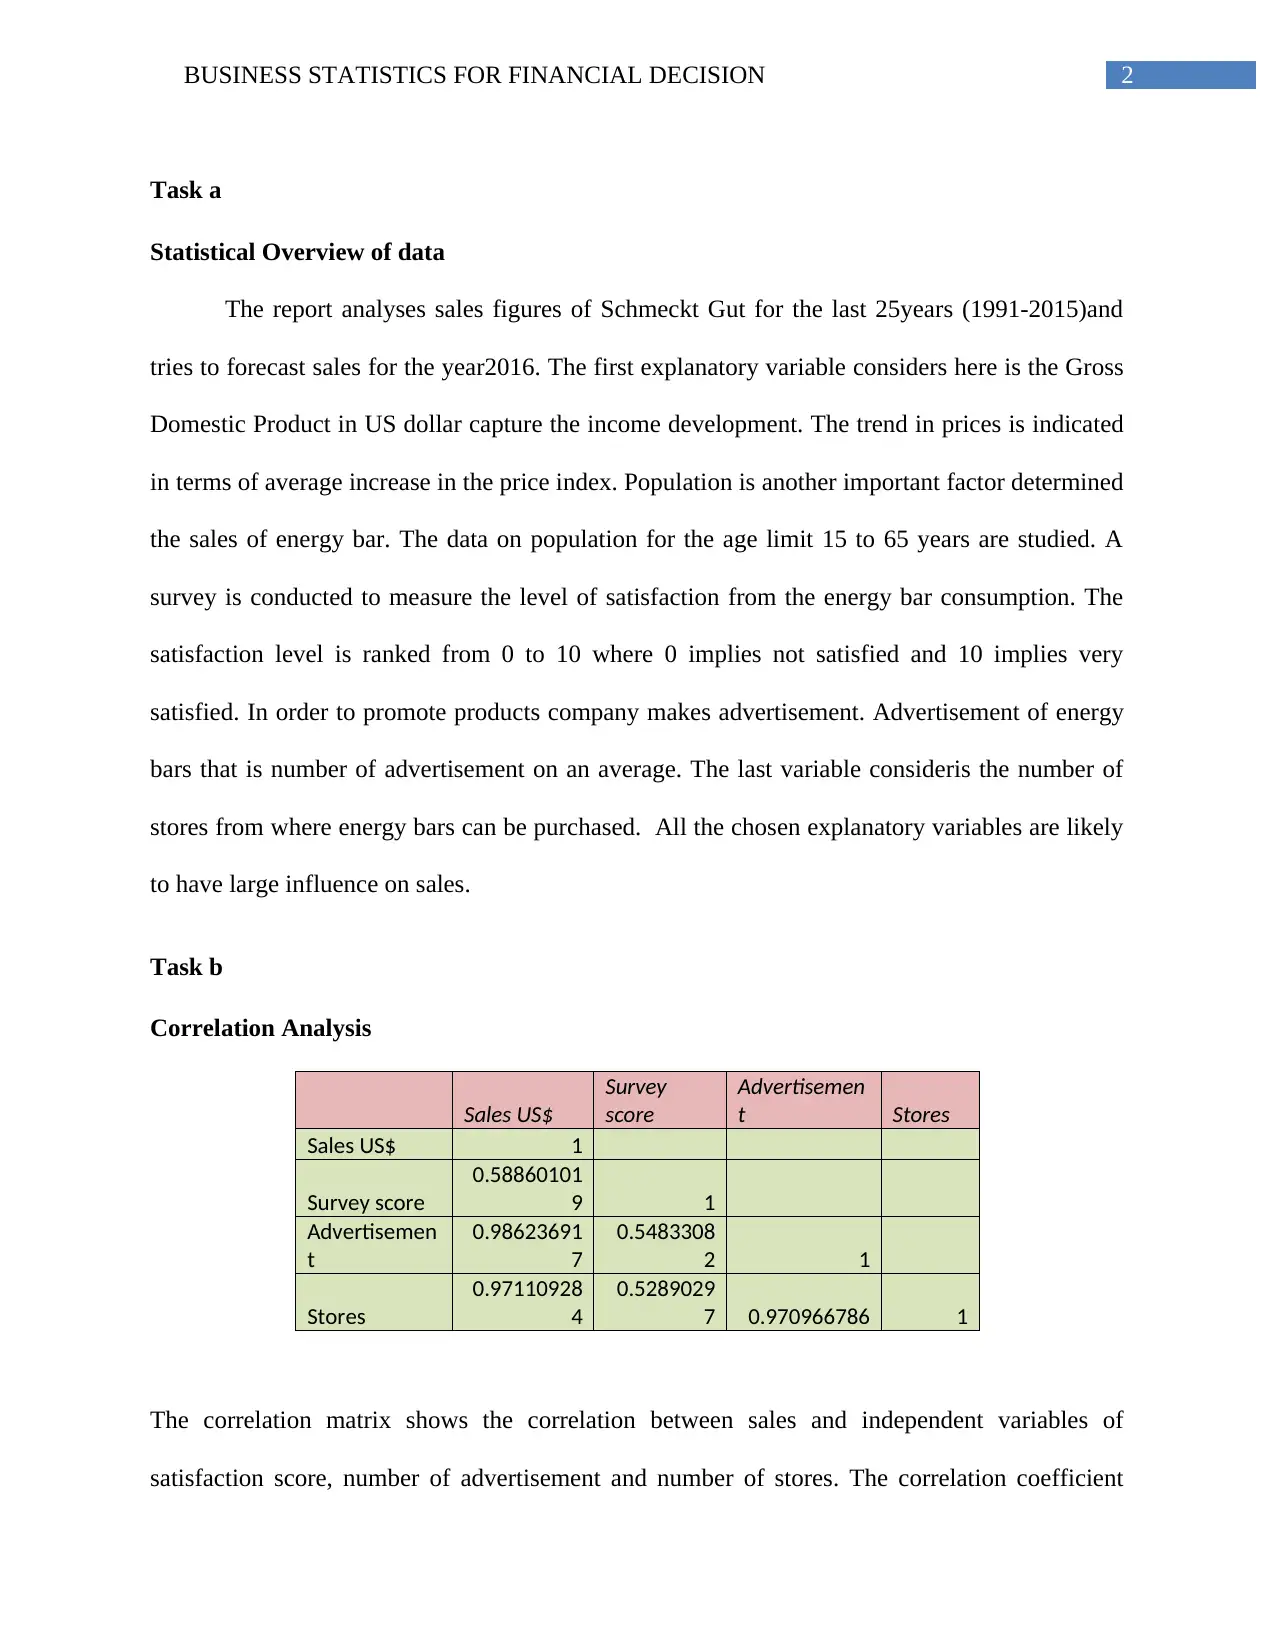
The correlation matrix shows the correlation between sales and independent variables of
satisfaction score, number of advertisement and number of stores. The correlation coefficient
Task a
Statistical Overview of data
The report analyses sales figures of Schmeckt Gut for the last 25years (1991-2015)and
tries to forecast sales for the year2016. The first explanatory variable considers here is the Gross
Domestic Product in US dollar capture the income development. The trend in prices is indicated
in terms of average increase in the price index. Population is another important factor determined
the sales of energy bar. The data on population for the age limit 15 to 65 years are studied. A
survey is conducted to measure the level of satisfaction from the energy bar consumption. The
satisfaction level is ranked from 0 to 10 where 0 implies not satisfied and 10 implies very
satisfied. In order to promote products company makes advertisement. Advertisement of energy
bars that is number of advertisement on an average. The last variable consideris the number of
stores from where energy bars can be purchased. All the chosen explanatory variables are likely
to have large influence on sales.
Task b
Correlation Analysis
Sales US$
Survey
score
Advertisemen
t Stores
Sales US$ 1
Survey score
0.58860101
9 1
Advertisemen
t
0.98623691
7
0.5483308
2 1
Stores
0.97110928
4
0.5289029
7 0.970966786 1
The correlation matrix shows the correlation between sales and independent variables of
satisfaction score, number of advertisement and number of stores. The correlation coefficient
3BUSINESS STATISTICS FOR FINANCIAL DECISION
between sales and satisfaction score is 0.59. The positive correlation implies a positive relation
between sales and survey score. The coefficient is high showing a strong correlation between the
two variables. The correlation coefficient between Sales and number of advertisement is 0.99. A
value of correlation coefficient close to 1 shows a perfect positive relation between the variables.
The correlation matrix gives value of correlation coefficientequals to 0.9711. This value is also
close to 1 implying perfect linear relationship between sales and stores.
Task c
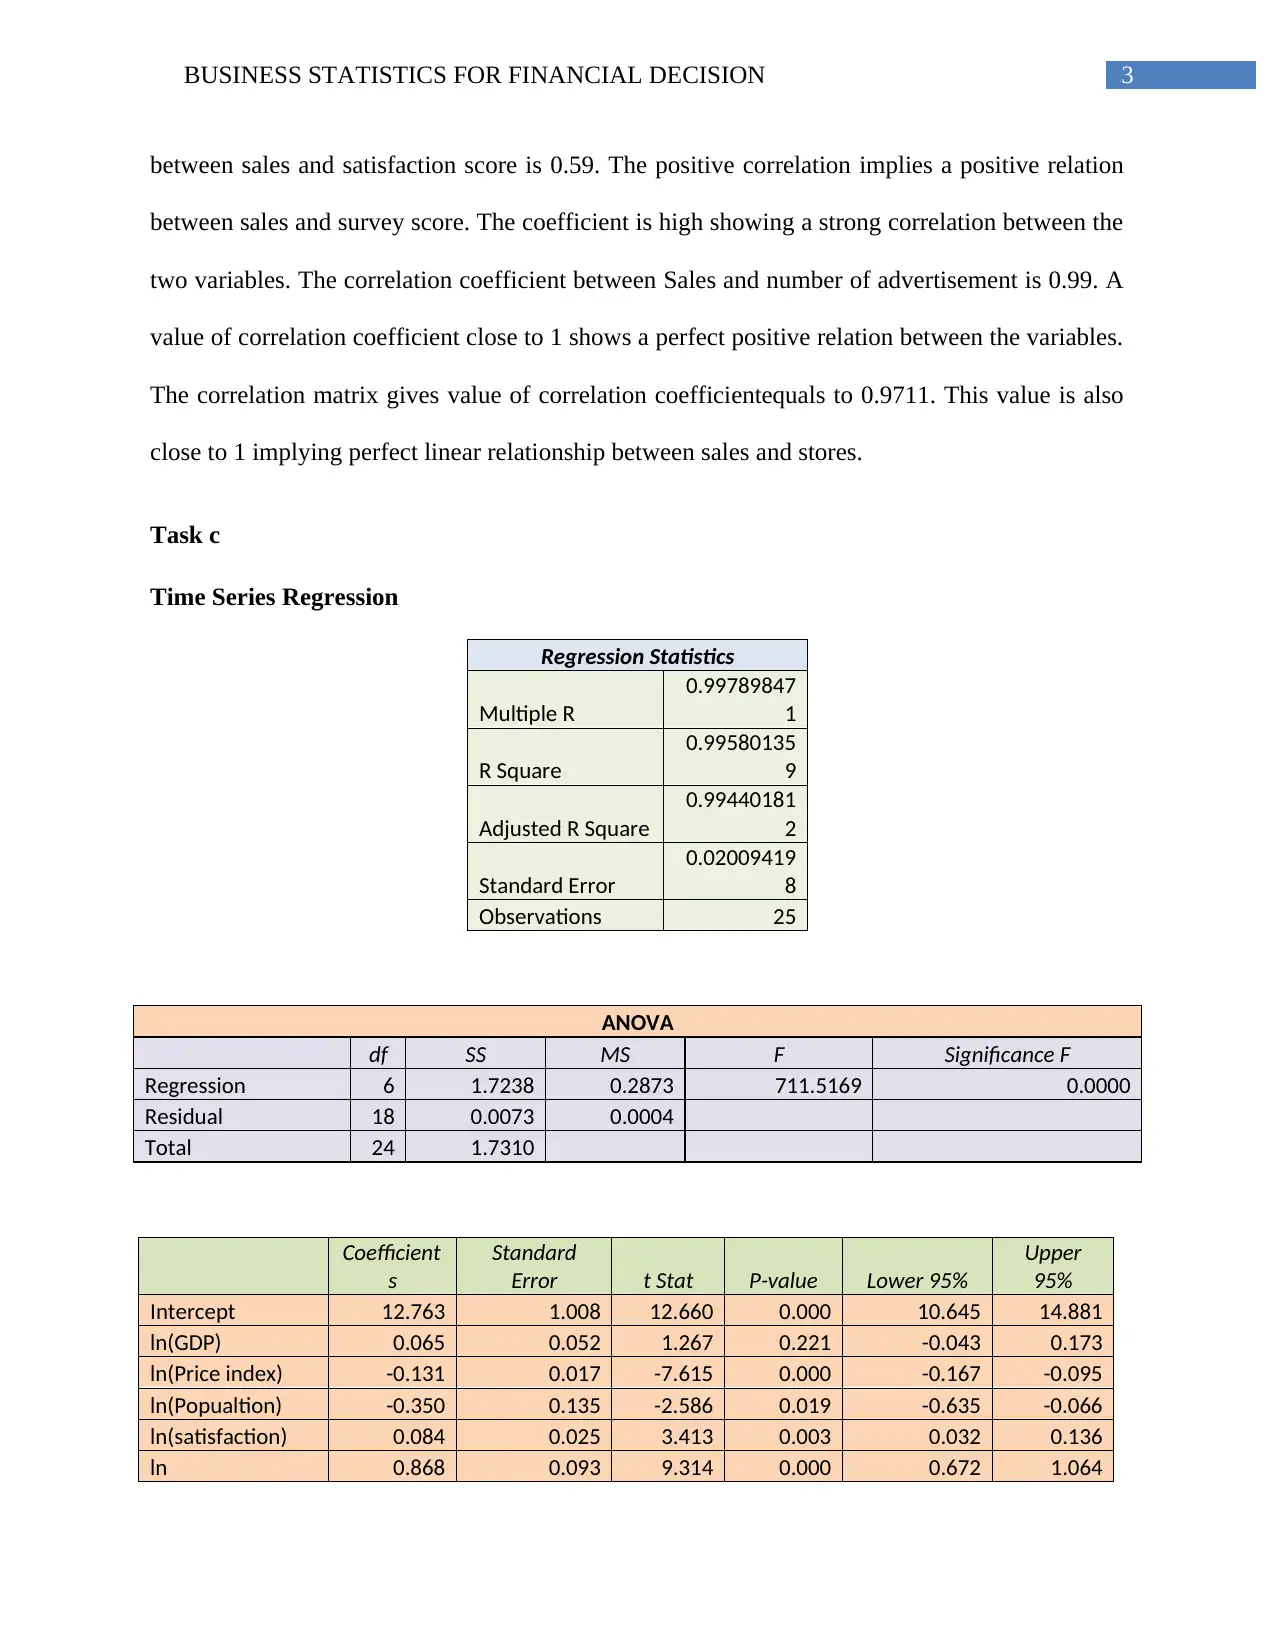
Time Series Regression
Regression Statistics
Multiple R
0.99789847
1
R Square
0.99580135
9
Adjusted R Square
0.99440181
2
Standard Error
0.02009419
8
Observations 25
ANOVA
df SS MS F Significance F
Regression 6 1.7238 0.2873 711.5169 0.0000
Residual 18 0.0073 0.0004
Total 24 1.7310
Coefficient
s
Standard
Error t Stat P-value Lower 95%
Upper
95%
Intercept 12.763 1.008 12.660 0.000 10.645 14.881
ln(GDP) 0.065 0.052 1.267 0.221 -0.043 0.173
ln(Price index) -0.131 0.017 -7.615 0.000 -0.167 -0.095
ln(Popualtion) -0.350 0.135 -2.586 0.019 -0.635 -0.066
ln(satisfaction) 0.084 0.025 3.413 0.003 0.032 0.136
ln 0.868 0.093 9.314 0.000 0.672 1.064
between sales and satisfaction score is 0.59. The positive correlation implies a positive relation
between sales and survey score. The coefficient is high showing a strong correlation between the
two variables. The correlation coefficient between Sales and number of advertisement is 0.99. A
value of correlation coefficient close to 1 shows a perfect positive relation between the variables.
The correlation matrix gives value of correlation coefficientequals to 0.9711. This value is also
close to 1 implying perfect linear relationship between sales and stores.
Task c
Time Series Regression
Regression Statistics
Multiple R
0.99789847
1
R Square
0.99580135
9
Adjusted R Square
0.99440181
2
Standard Error
0.02009419
8
Observations 25
ANOVA
df SS MS F Significance F
Regression 6 1.7238 0.2873 711.5169 0.0000
Residual 18 0.0073 0.0004
Total 24 1.7310
Coefficient
s
Standard
Error t Stat P-value Lower 95%
Upper
95%
Intercept 12.763 1.008 12.660 0.000 10.645 14.881
ln(GDP) 0.065 0.052 1.267 0.221 -0.043 0.173
ln(Price index) -0.131 0.017 -7.615 0.000 -0.167 -0.095
ln(Popualtion) -0.350 0.135 -2.586 0.019 -0.635 -0.066
ln(satisfaction) 0.084 0.025 3.413 0.003 0.032 0.136
ln 0.868 0.093 9.314 0.000 0.672 1.064
Secure Best Marks with AI Grader
Need help grading? Try our AI Grader for instant feedback on your assignments.
4BUSINESS STATISTICS FOR FINANCIAL DECISION
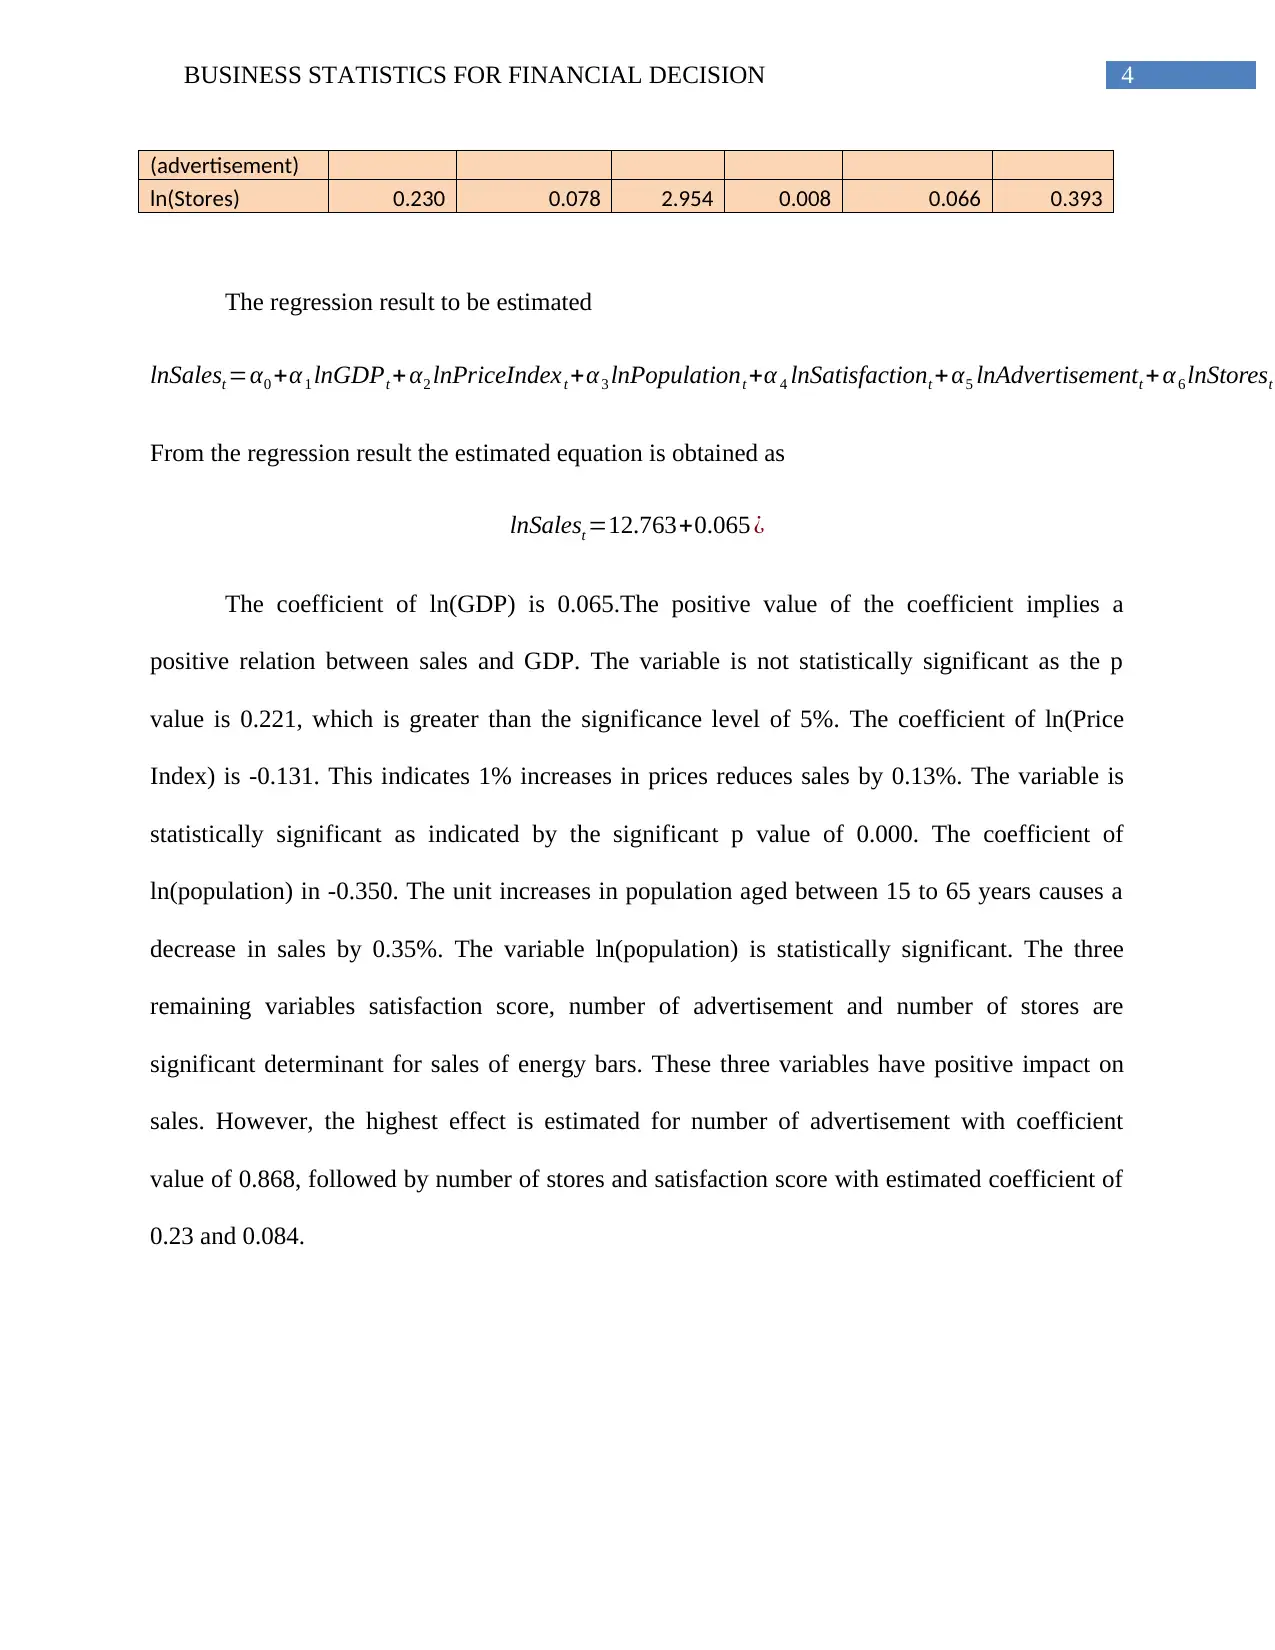
(advertisement)
ln(Stores) 0.230 0.078 2.954 0.008 0.066 0.393
The regression result to be estimated
lnSalest =α0 +α1 lnGDPt + α2 lnPriceIndext +α3 lnPopulationt +α 4 lnSatisfactiont +α5 lnAdvertisementt +α 6 lnStorest +
From the regression result the estimated equation is obtained as
lnSalest =12.763+0.065 ¿
The coefficient of ln(GDP) is 0.065.The positive value of the coefficient implies a
positive relation between sales and GDP. The variable is not statistically significant as the p
value is 0.221, which is greater than the significance level of 5%. The coefficient of ln(Price
Index) is -0.131. This indicates 1% increases in prices reduces sales by 0.13%. The variable is
statistically significant as indicated by the significant p value of 0.000. The coefficient of
ln(population) in -0.350. The unit increases in population aged between 15 to 65 years causes a
decrease in sales by 0.35%. The variable ln(population) is statistically significant. The three
remaining variables satisfaction score, number of advertisement and number of stores are
significant determinant for sales of energy bars. These three variables have positive impact on
sales. However, the highest effect is estimated for number of advertisement with coefficient
value of 0.868, followed by number of stores and satisfaction score with estimated coefficient of
0.23 and 0.084.
5BUSINESS STATISTICS FOR FINANCIAL DECISION
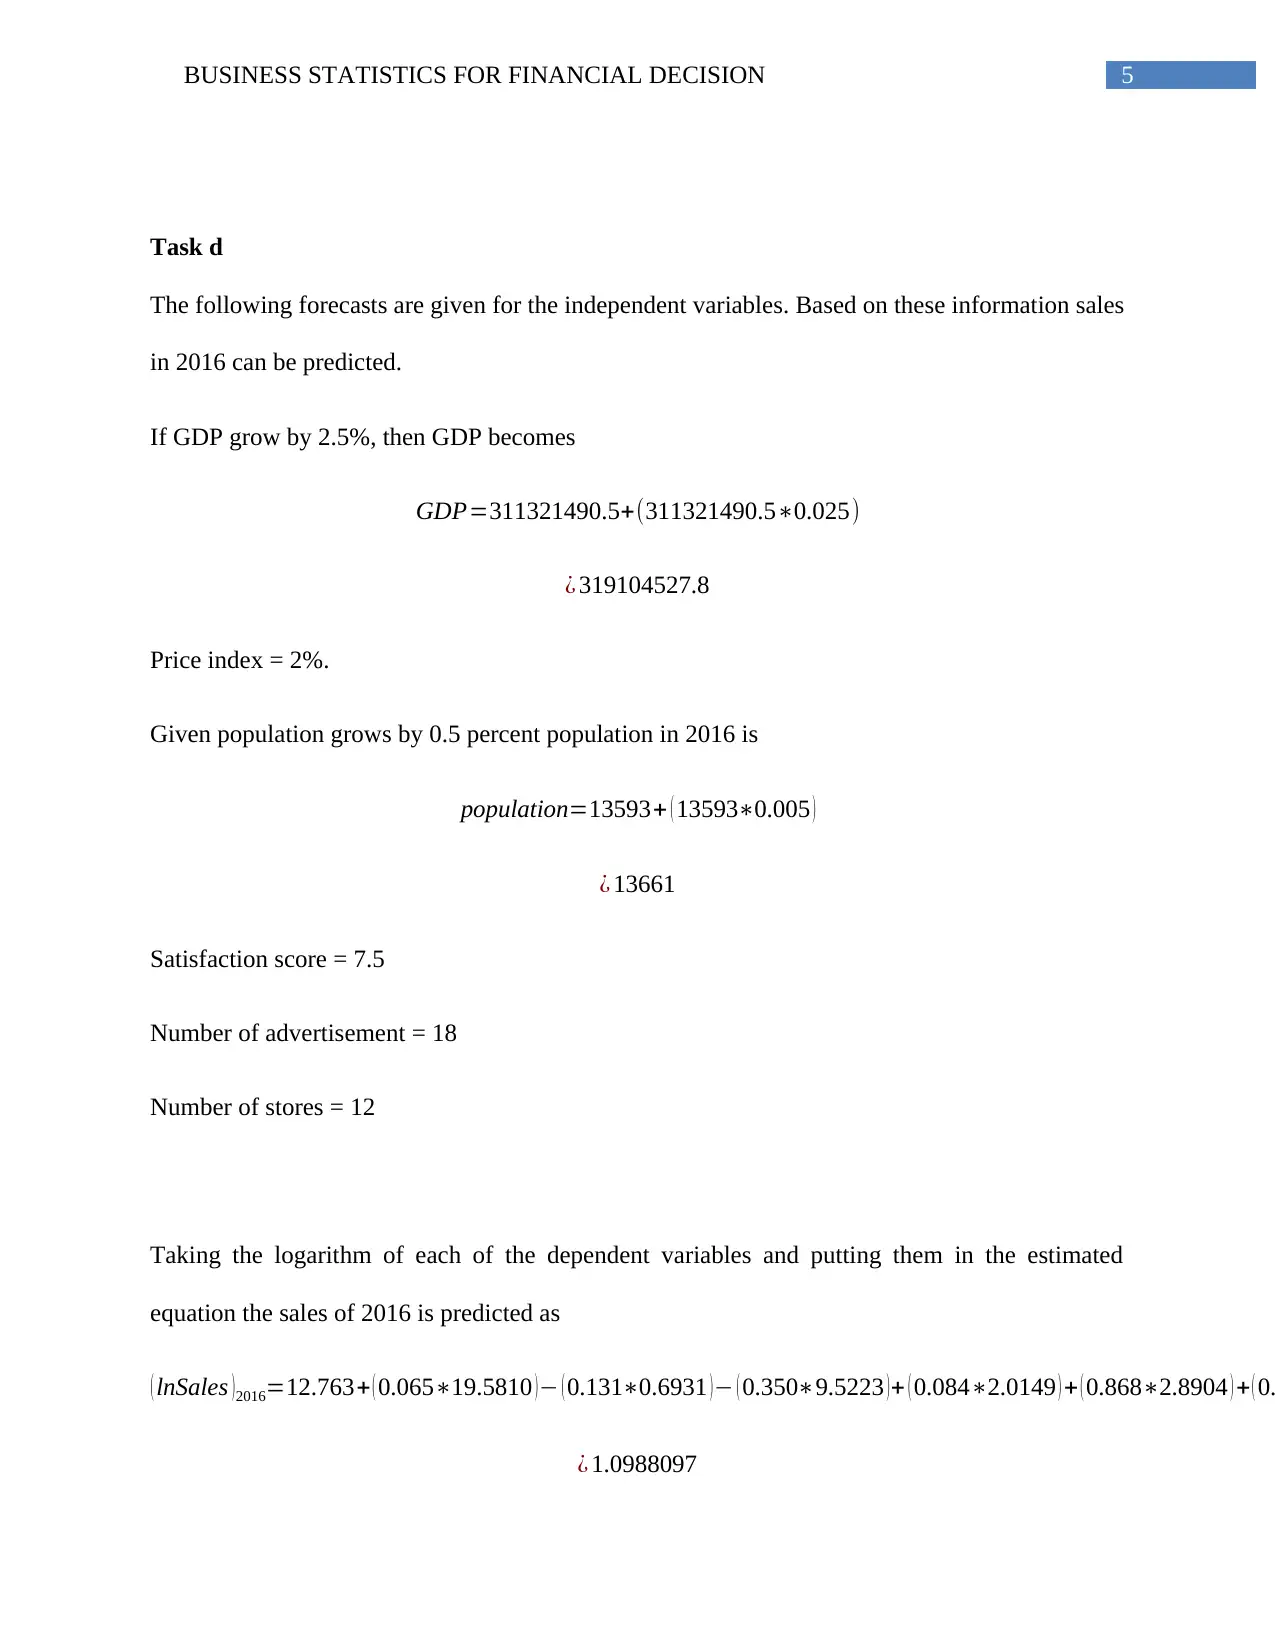
Task d
The following forecasts are given for the independent variables. Based on these information sales
in 2016 can be predicted.
If GDP grow by 2.5%, then GDP becomes
GDP=311321490.5+(311321490.5∗0.025)
¿ 319104527.8
Price index = 2%.
Given population grows by 0.5 percent population in 2016 is
population=13593+ ( 13593∗0.005 )
¿ 13661
Satisfaction score = 7.5
Number of advertisement = 18
Number of stores = 12
Taking the logarithm of each of the dependent variables and putting them in the estimated
equation the sales of 2016 is predicted as
( lnSales )2016=12.763+ ( 0.065∗19.5810 )− ( 0.131∗0.6931 )− ( 0.350∗9.5223 )+ ( 0.084∗2.0149 ) + ( 0.868∗2.8904 ) + ( 0.
¿ 1.0988097
6BUSINESS STATISTICS FOR FINANCIAL DECISION
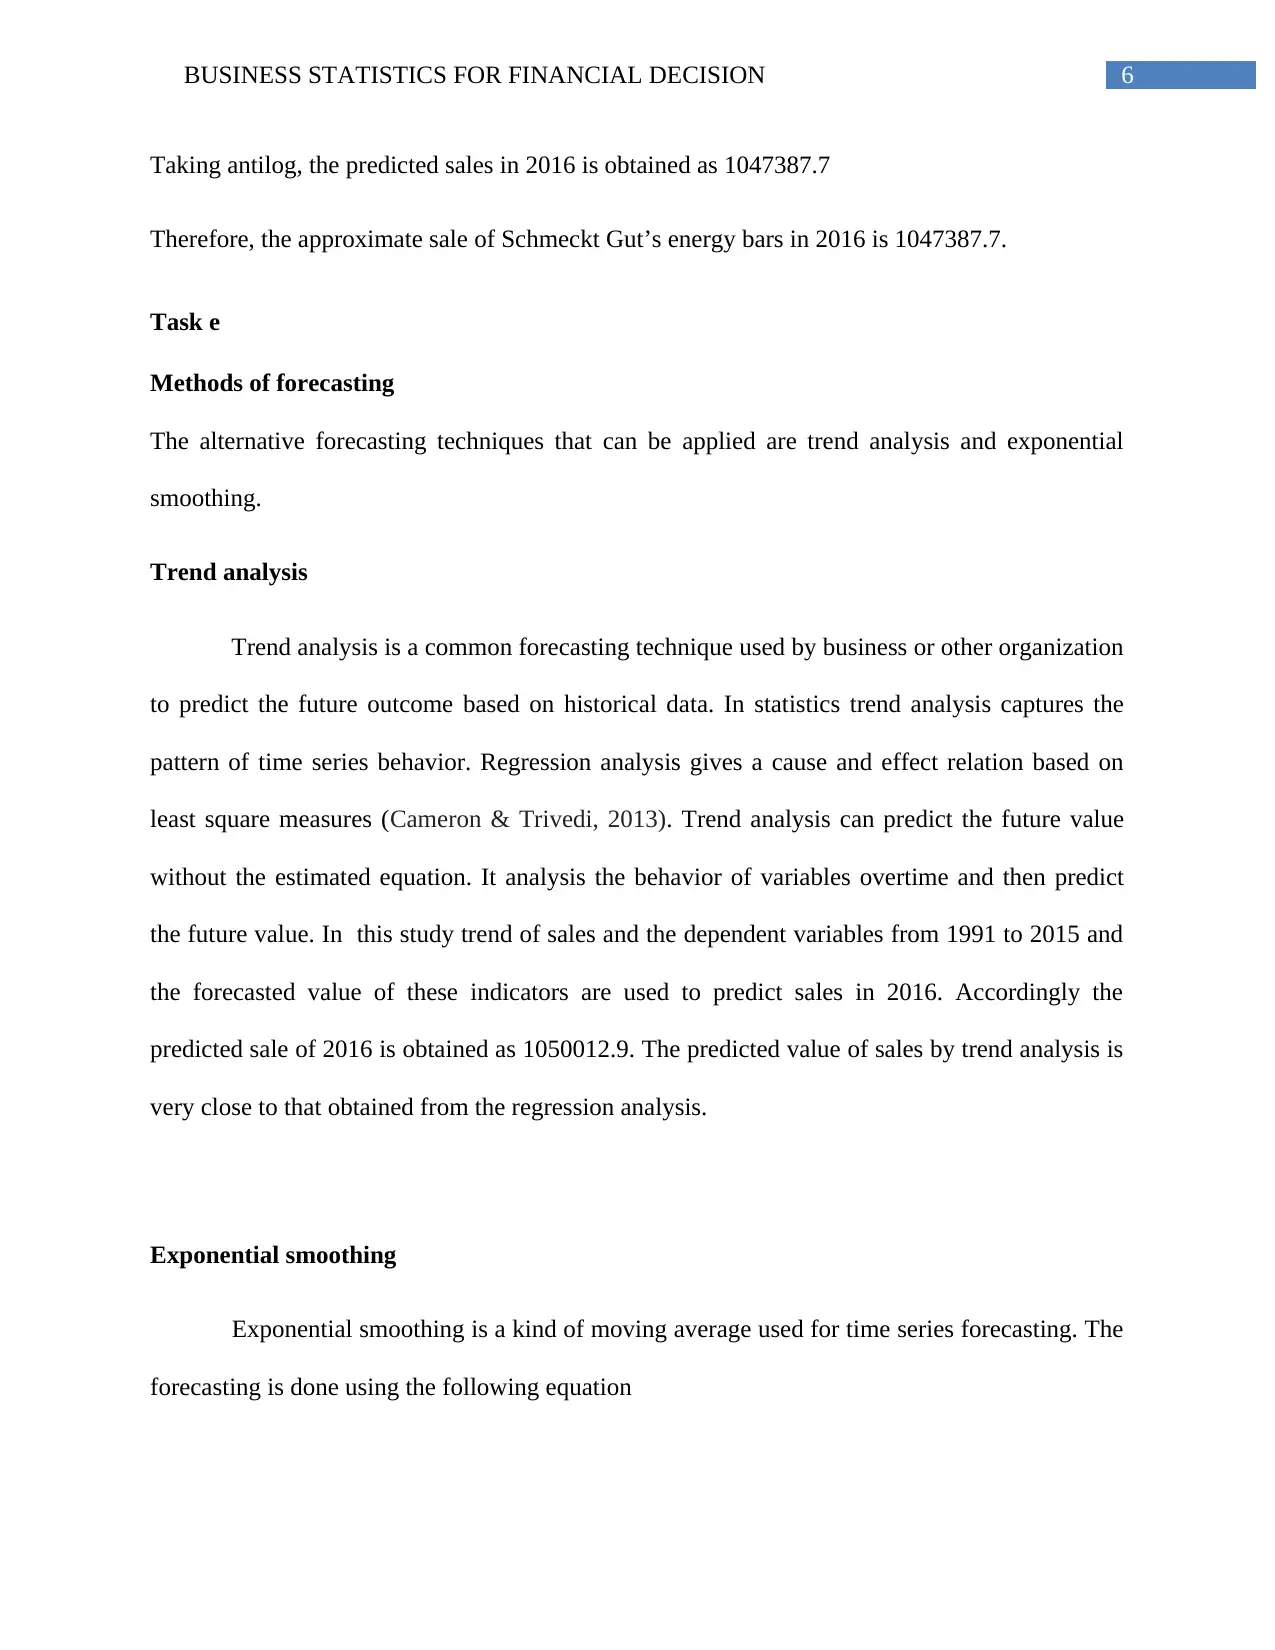
Taking antilog, the predicted sales in 2016 is obtained as 1047387.7
Therefore, the approximate sale of Schmeckt Gut’s energy bars in 2016 is 1047387.7.
Task e
Methods of forecasting
The alternative forecasting techniques that can be applied are trend analysis and exponential
smoothing.
Trend analysis
Trend analysis is a common forecasting technique used by business or other organization
to predict the future outcome based on historical data. In statistics trend analysis captures the
pattern of time series behavior. Regression analysis gives a cause and effect relation based on
least square measures (Cameron & Trivedi, 2013). Trend analysis can predict the future value
without the estimated equation. It analysis the behavior of variables overtime and then predict
the future value. In this study trend of sales and the dependent variables from 1991 to 2015 and
the forecasted value of these indicators are used to predict sales in 2016. Accordingly the
predicted sale of 2016 is obtained as 1050012.9. The predicted value of sales by trend analysis is
very close to that obtained from the regression analysis.
Exponential smoothing
Exponential smoothing is a kind of moving average used for time series forecasting. The
forecasting is done using the following equation
Paraphrase This Document
Need a fresh take? Get an instant paraphrase of this document with our AI Paraphraser
7BUSINESS STATISTICS FOR FINANCIAL DECISION
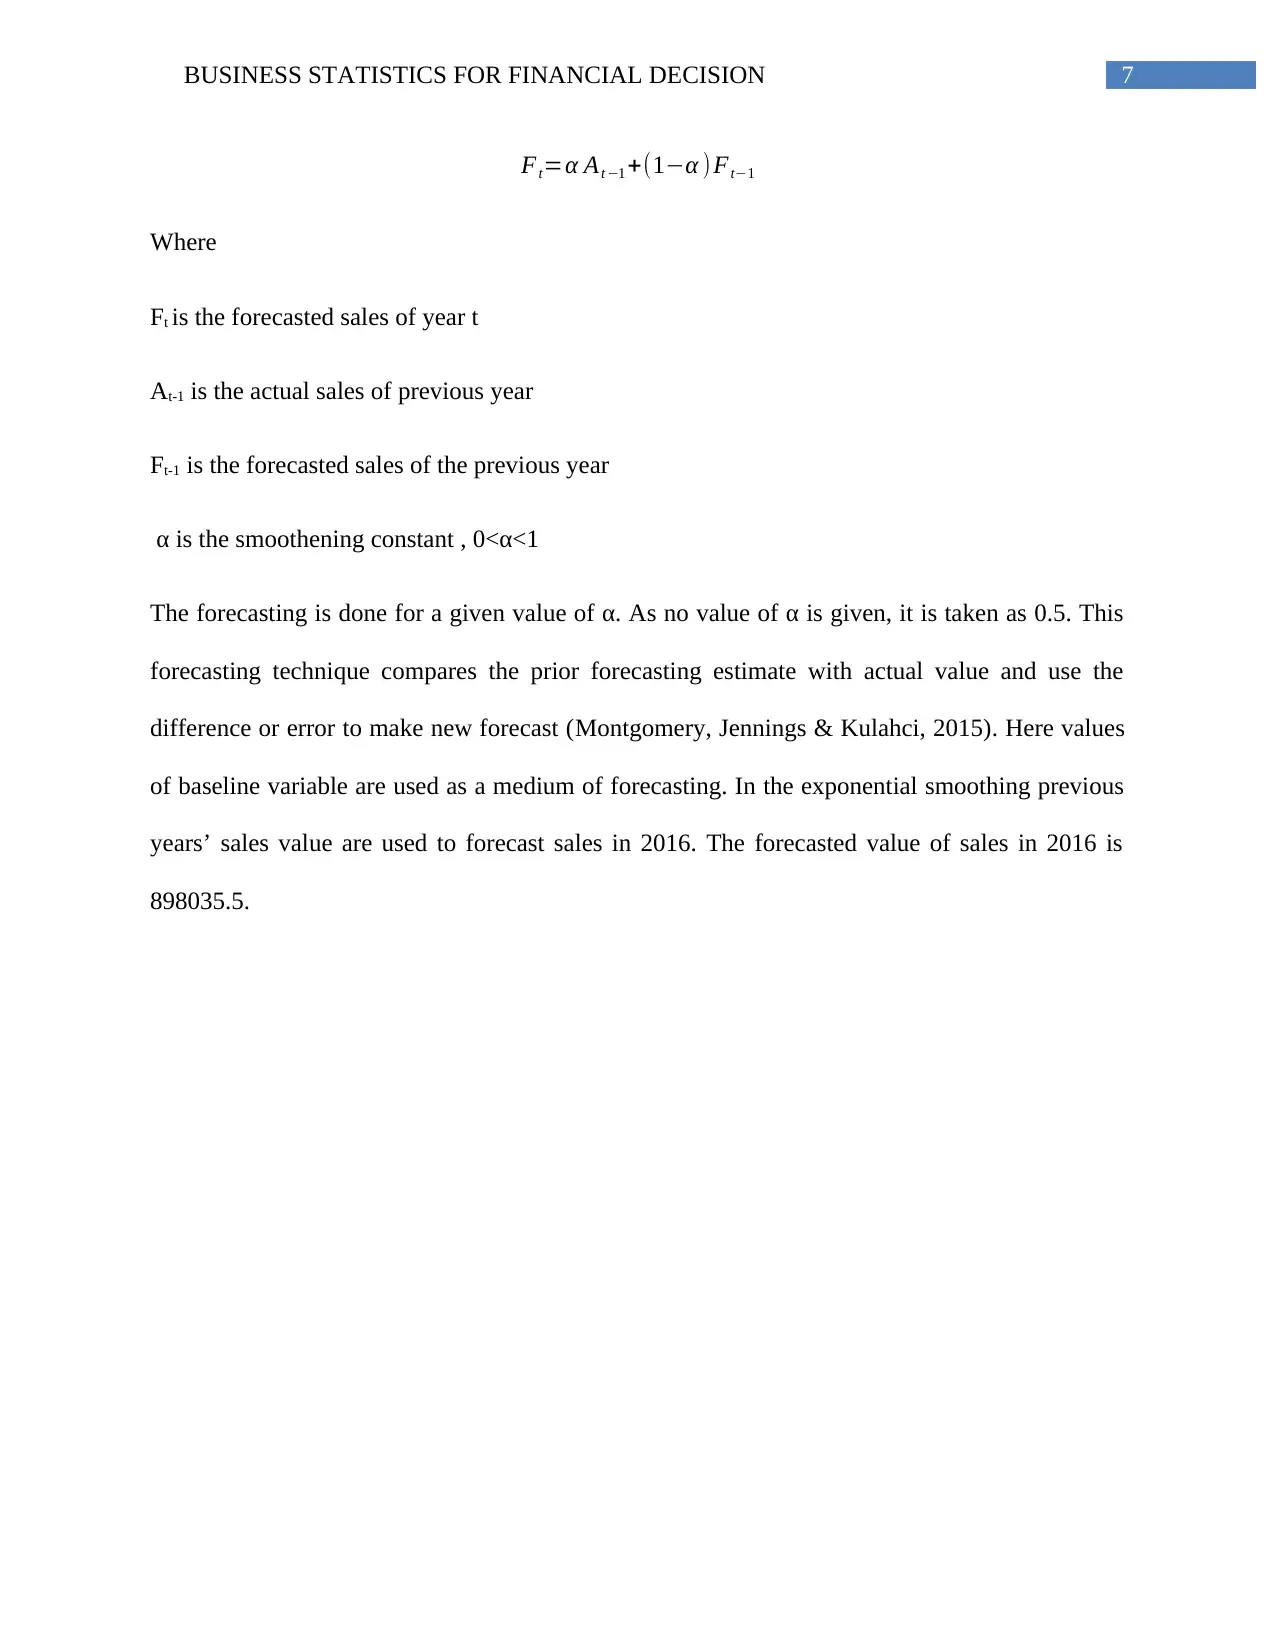
Ft=α At −1 +(1−α )Ft−1
Where
Ft is the forecasted sales of year t
At-1 is the actual sales of previous year
Ft-1 is the forecasted sales of the previous year
α is the smoothening constant , 0<α<1
The forecasting is done for a given value of α. As no value of α is given, it is taken as 0.5. This
forecasting technique compares the prior forecasting estimate with actual value and use the
difference or error to make new forecast (Montgomery, Jennings & Kulahci, 2015). Here values
of baseline variable are used as a medium of forecasting. In the exponential smoothing previous
years’ sales value are used to forecast sales in 2016. The forecasted value of sales in 2016 is
898035.5.
8BUSINESS STATISTICS FOR FINANCIAL DECISION
References
Cameron, A. C., & Trivedi, P. K. (2013). Regression analysis of count data (Vol. 53).
Cambridge university press.
Montgomery, D. C., Jennings, C. L., & Kulahci, M. (2015). Introduction to time series analysis
and forecasting. John Wiley & Sons.
References
Cameron, A. C., & Trivedi, P. K. (2013). Regression analysis of count data (Vol. 53).
Cambridge university press.
Montgomery, D. C., Jennings, C. L., & Kulahci, M. (2015). Introduction to time series analysis
and forecasting. John Wiley & Sons.
1 out of 9
Related Documents


Your All-in-One AI-Powered Toolkit for Academic Success.
+13062052269
info@desklib.com
Available 24*7 on WhatsApp / Email
![[object Object]](/_next/static/media/star-bottom.7253800d.svg)
Unlock your academic potential
© 2024 | Zucol Services PVT LTD | All rights reserved.