Business Statistics & Forecasting Report: Time Series Data Analysis
VerifiedAdded on 2023/06/15
|13
|1784
|115
Report
AI Summary
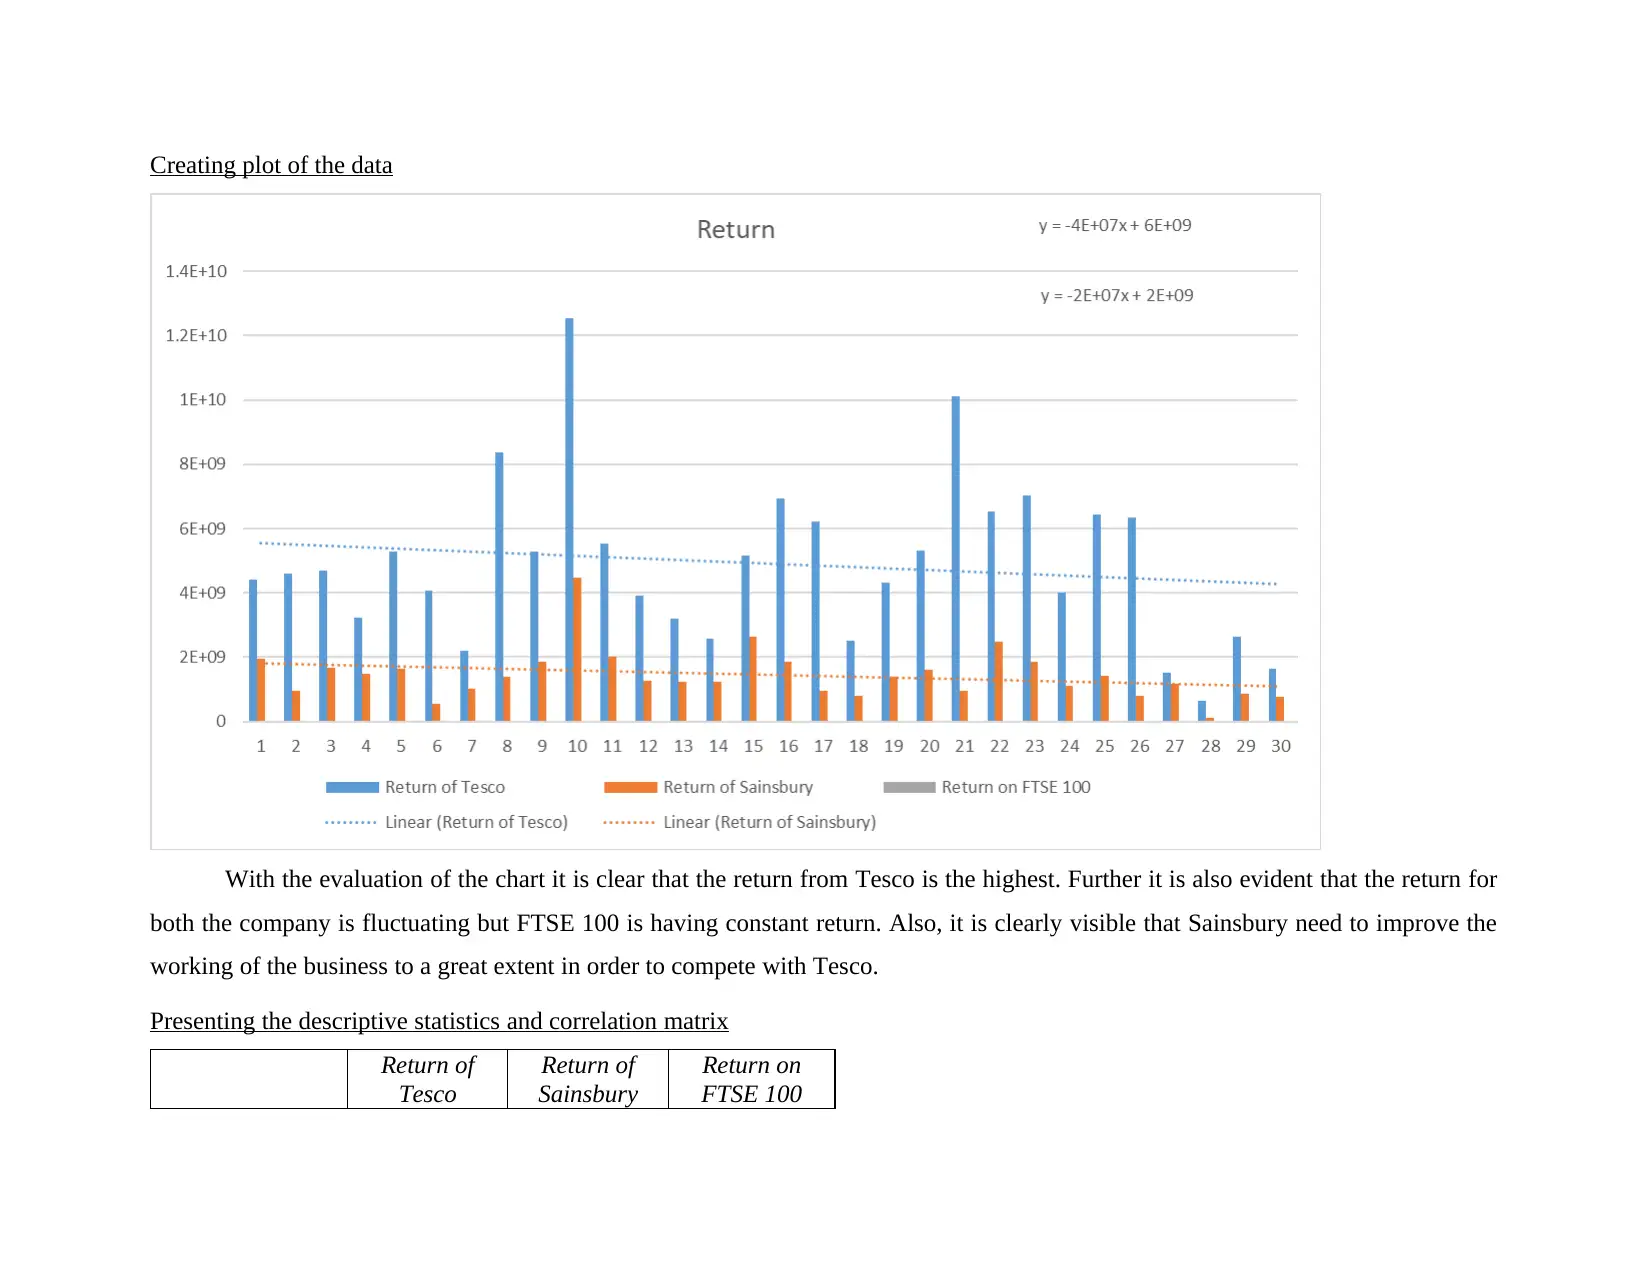
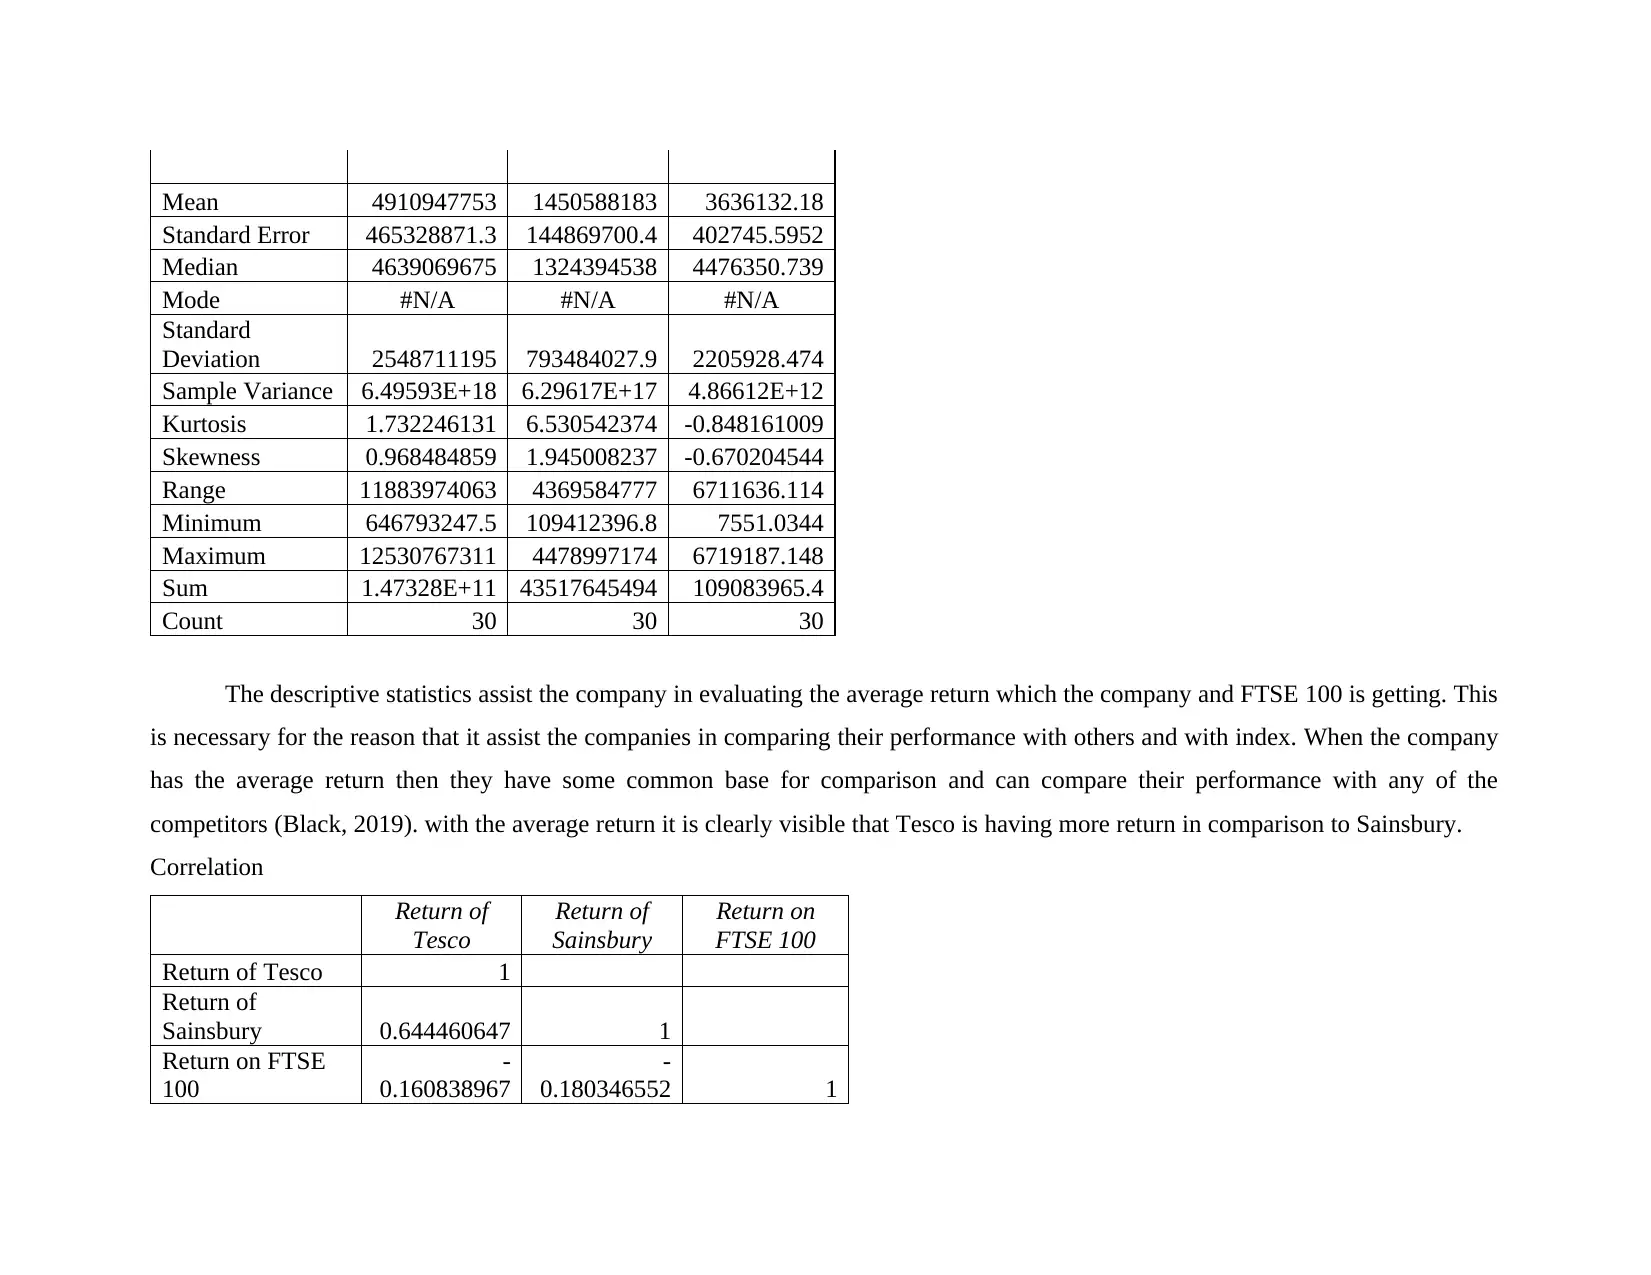
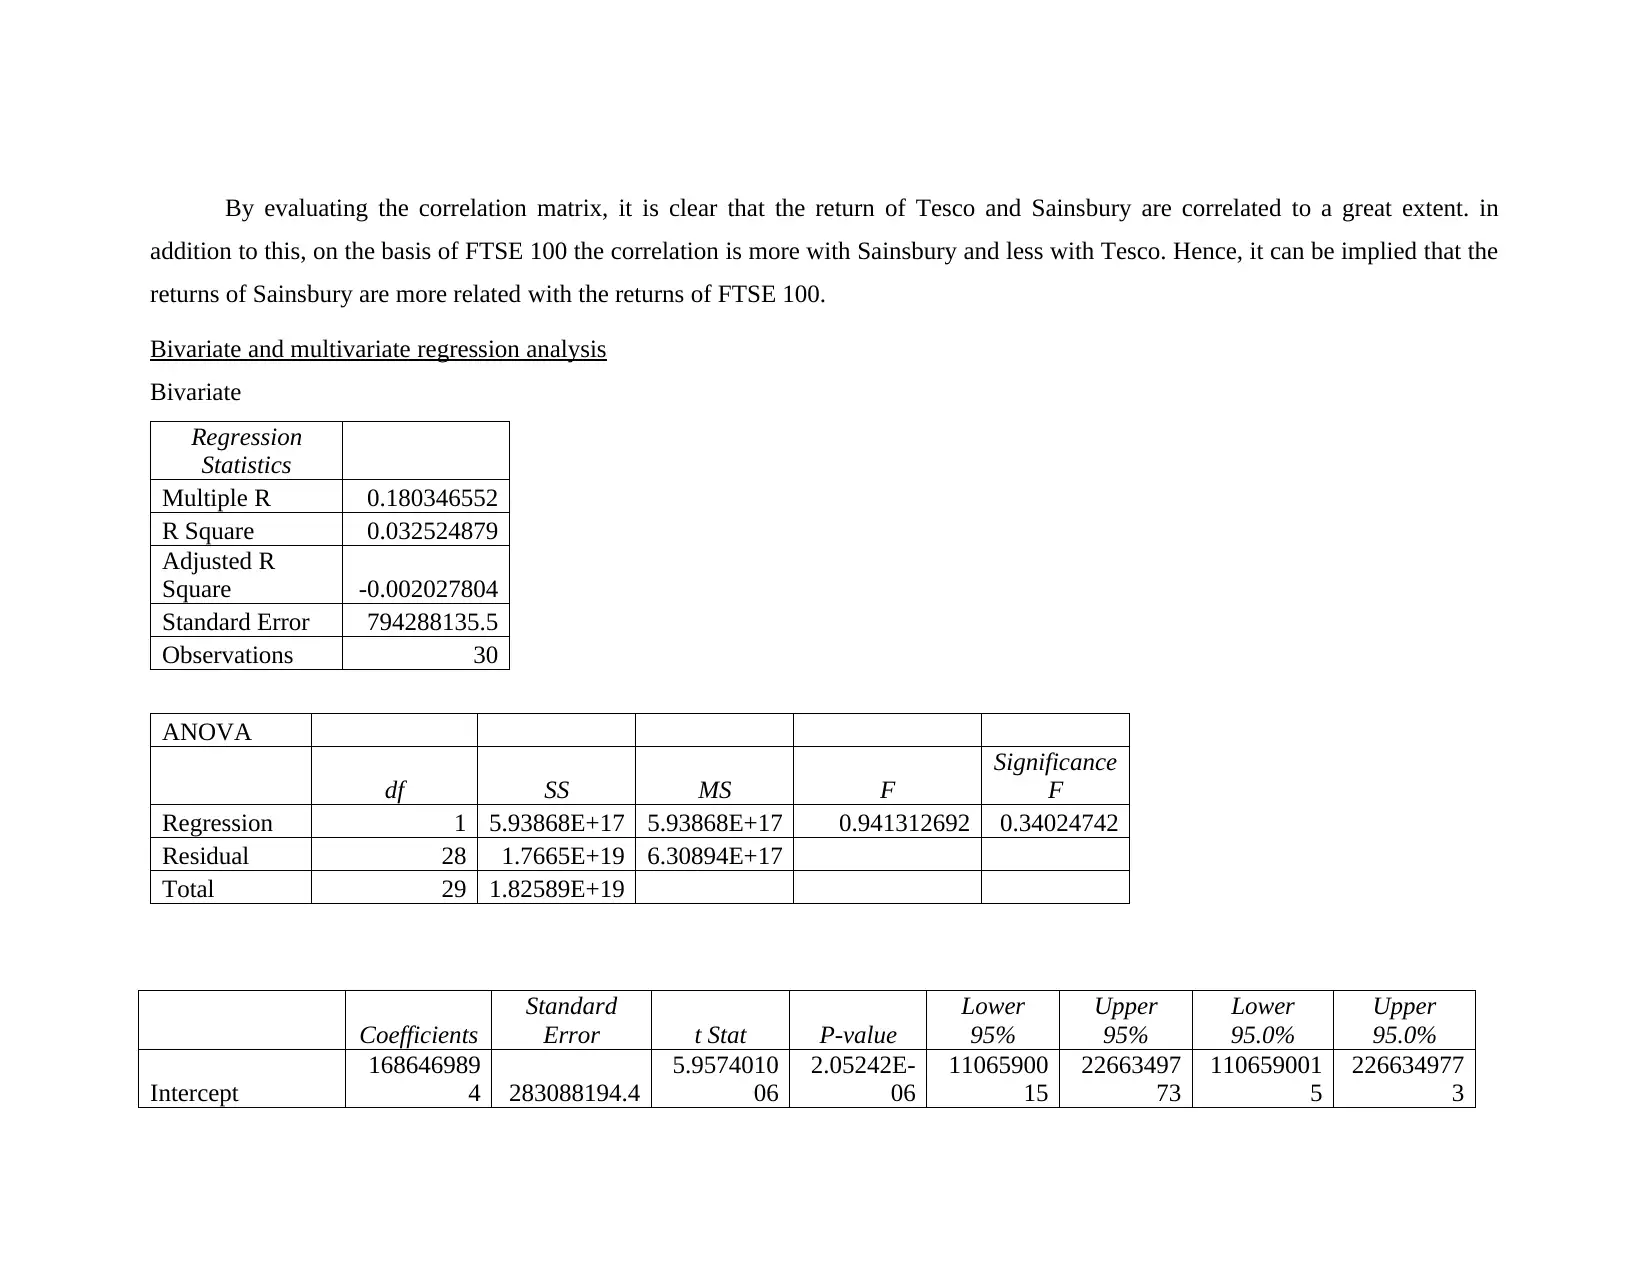
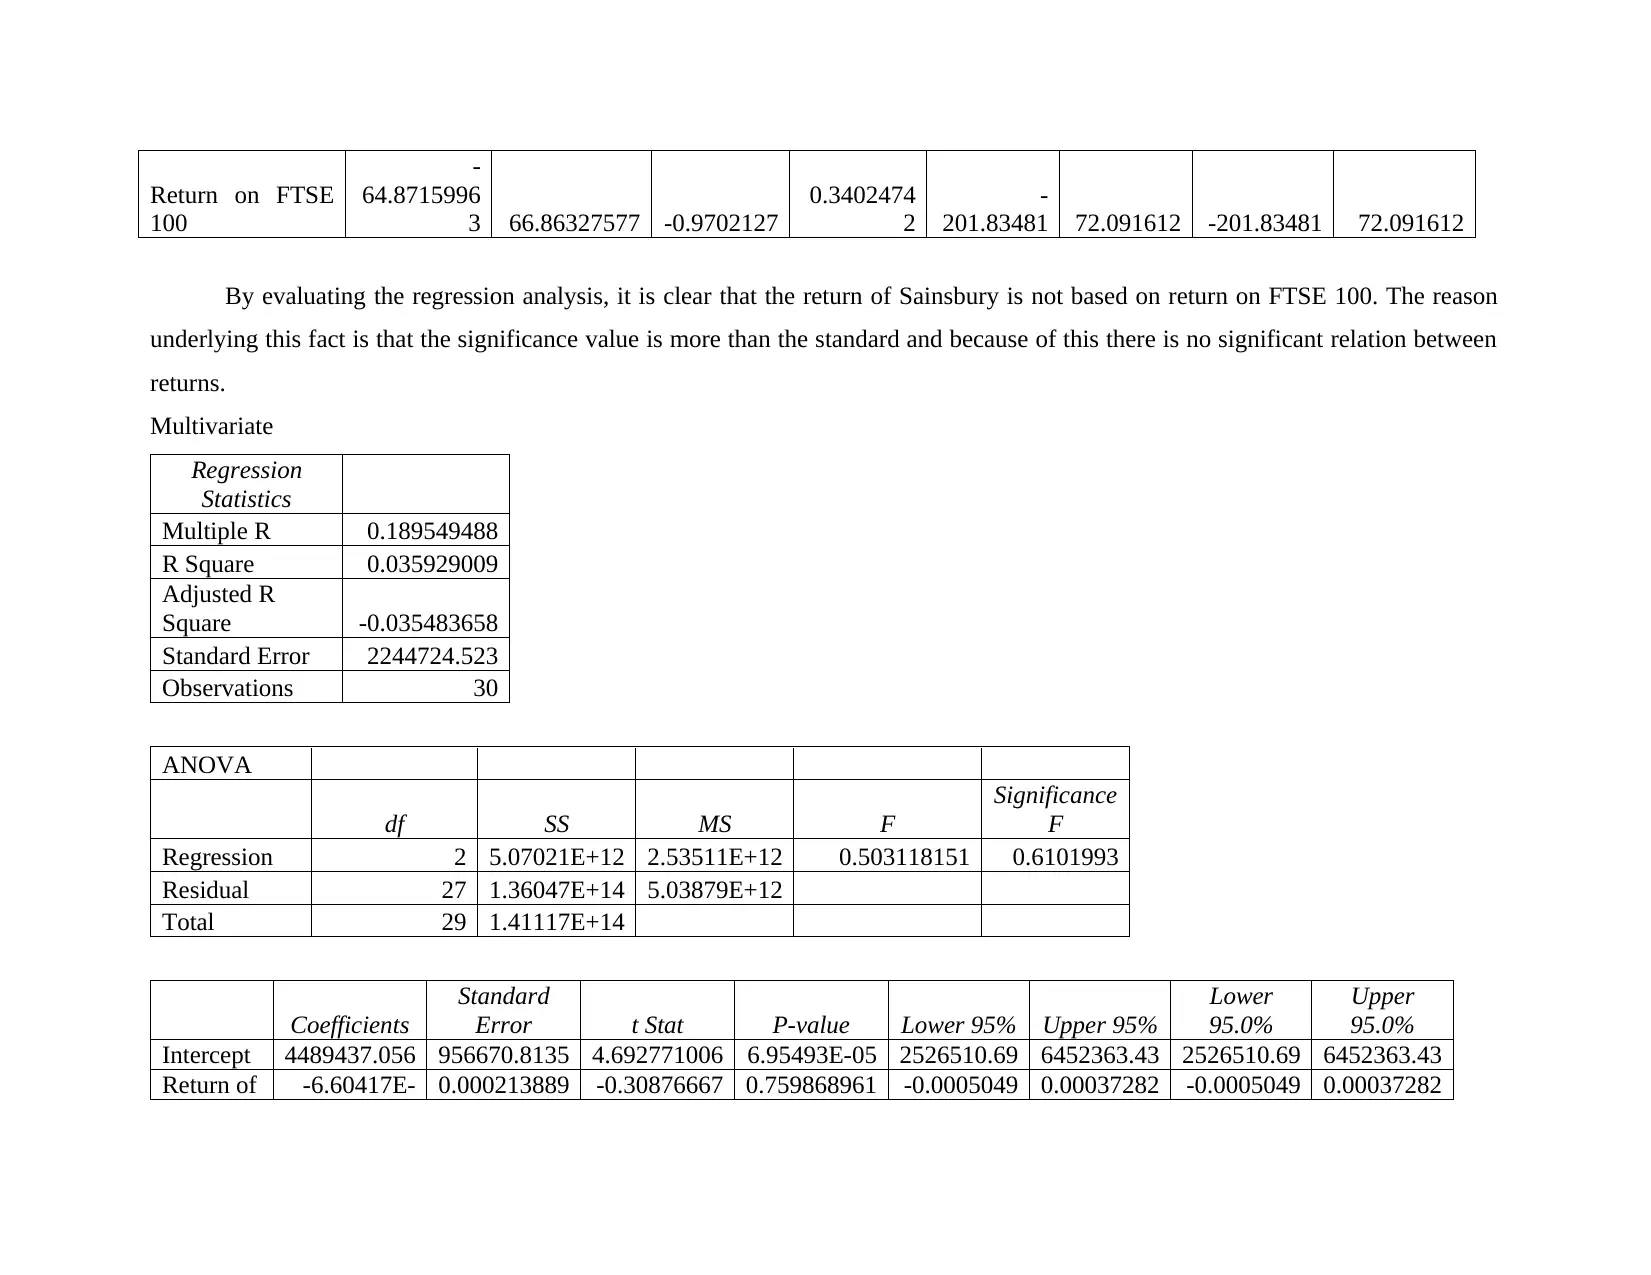
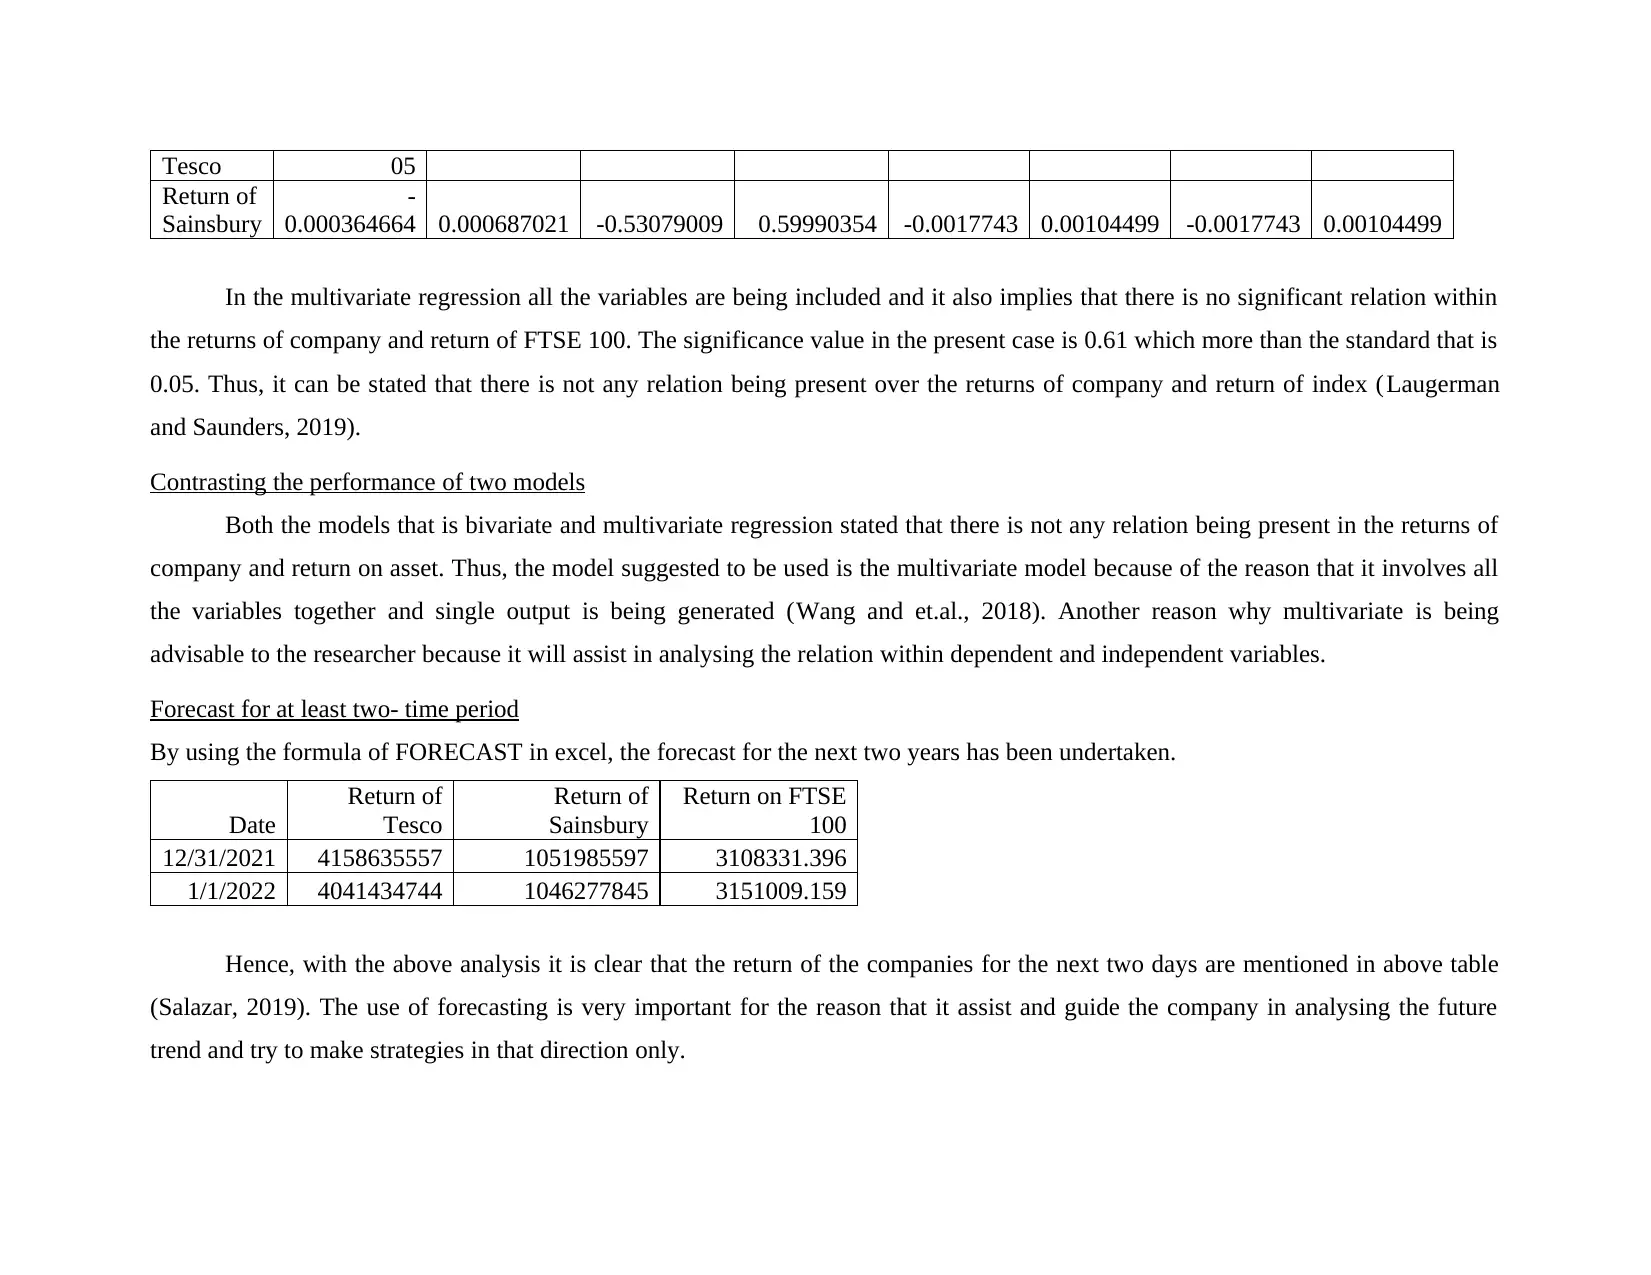
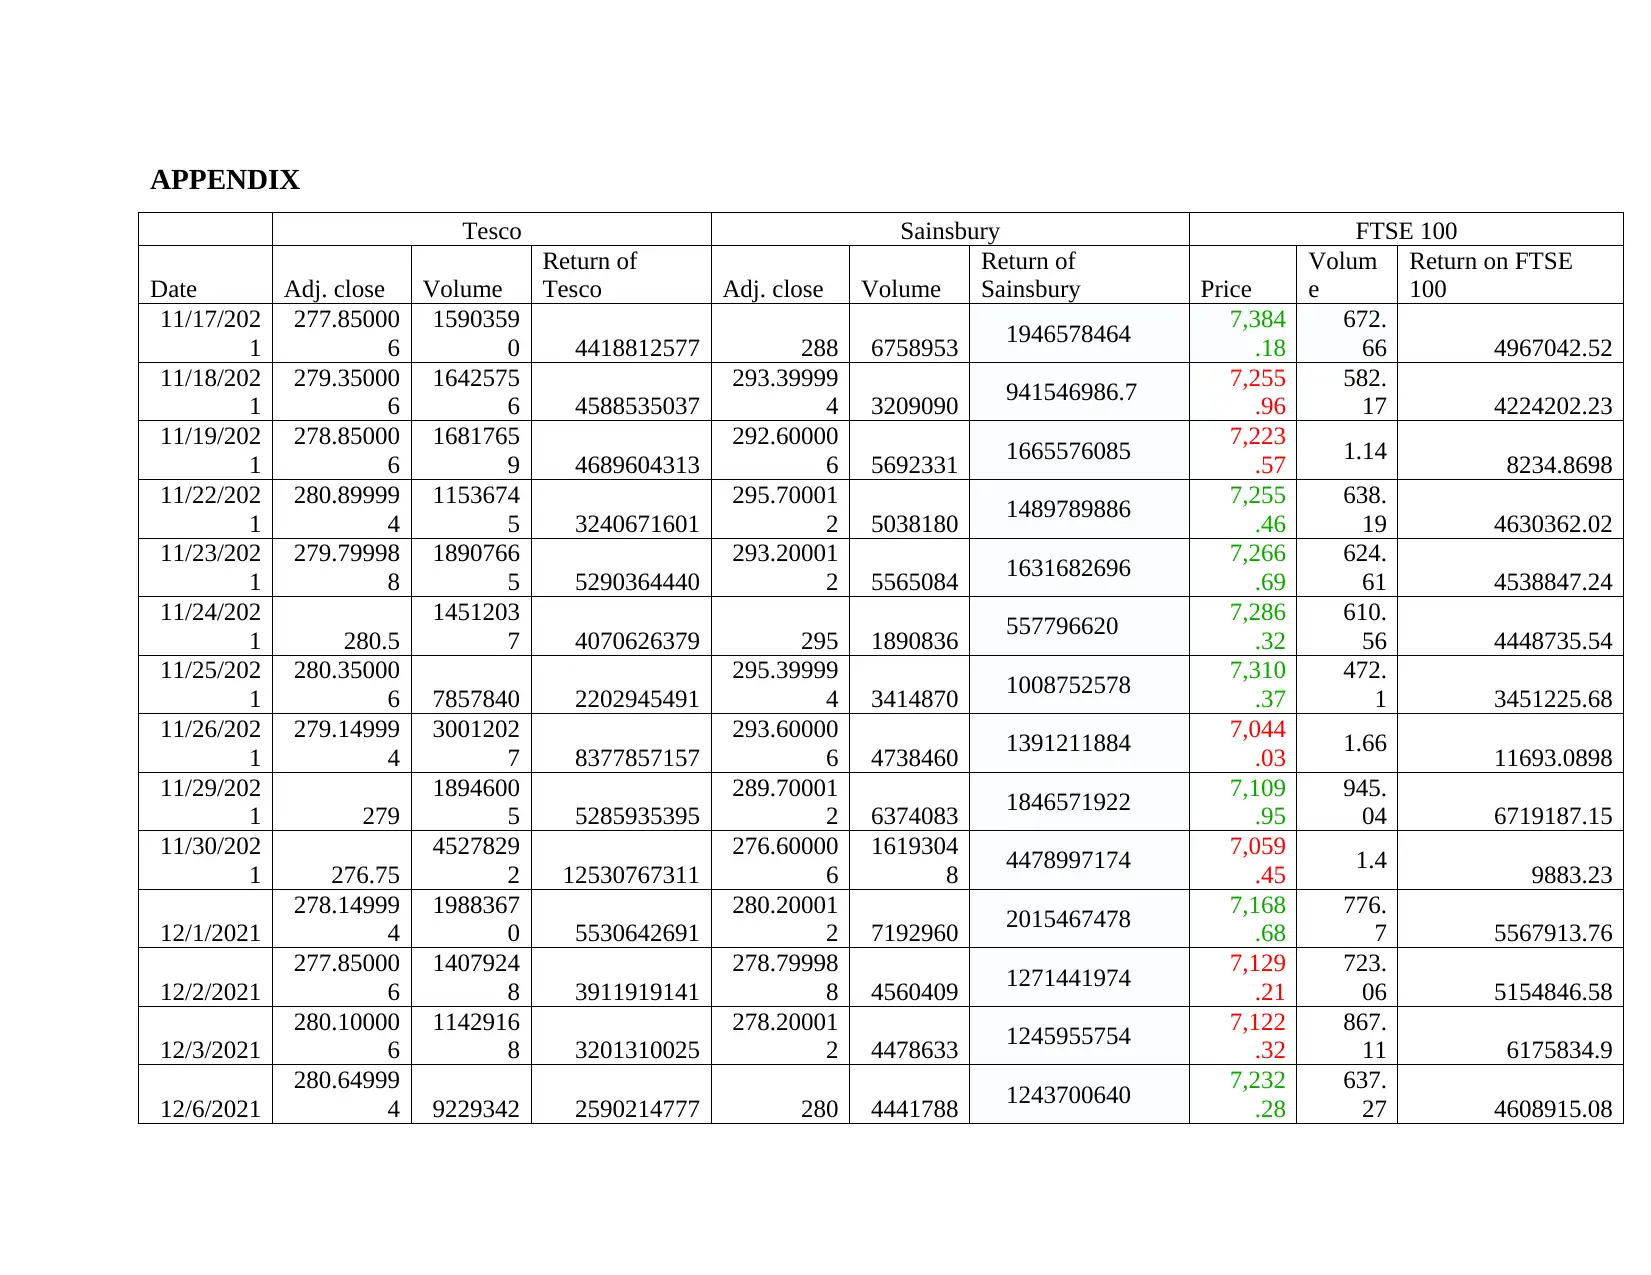
This report provides a comprehensive analysis of business statistics and forecasting, utilizing time series data for Tesco, Sainsbury, and the FTSE 100 index. It employs various statistical tools such as descriptive statistics, correlation matrix, and regression analysis to evaluate the relationships between the return of stocks and the return of the index. The report includes a detailed examination of time series data, plots of the data, descriptive statistics, and correlation matrix. Bivariate and multivariate regression analyses are performed, and the performance of the two models is contrasted. The report concludes that there is no significant relation within the return of companies and return of index. Finally, the report presents a forecast for the next two time periods using the FORECAST function in Excel.

Business Statistics and Forecasting -
Written
Written
Paraphrase This Document
Need a fresh take? Get an instant paraphrase of this document with our AI Paraphraser


TABLE OF CONTENTS
INTRODUCTION...........................................................................................................................3
MAIN BODY...................................................................................................................................3
Time series data..........................................................................................................................3
Creating plot of the data..............................................................................................................4
Presenting the descriptive statistics and correlation matrix........................................................4
Bivariate and multivariate regression analysis............................................................................6
Contrasting the performance of two models...............................................................................8
Forecast for at least two- time period..........................................................................................8
CONCLUSION................................................................................................................................8
REFERENCES..............................................................................................................................10
APPENDIX....................................................................................................................................11
⊘ This is a preview!⊘
Do you want full access?
Subscribe today to unlock all pages.

Trusted by 1+ million students worldwide

INTRODUCTION
Business statistics is being defined as the use of various tools which can be used in order to take some decision relating to
business. The use of these tools will assist the company in taking decision relating to better working and evaluate the current
performance. The present report will include the use of time series data and will involve application of different tools like descriptive
statistics, regression, correlation and others.
MAIN BODY
Time series data
The time series data is being referred to as the analysis which comprises of tracking the same set of data for large period of
time. In the present study, the time series of data is taken for Tesco, Sainsbury and FTSE 100 index. The use of data is very assistive
because of the reason that it helps in effectively applying the statistical tool and to reach to some conclusion.
Data attached in appendix.
Paraphrase This Document
Need a fresh take? Get an instant paraphrase of this document with our AI Paraphraser

Creating plot of the data
With the evaluation of the chart it is clear that the return from Tesco is the highest. Further it is also evident that the return for
both the company is fluctuating but FTSE 100 is having constant return. Also, it is clearly visible that Sainsbury need to improve the
working of the business to a great extent in order to compete with Tesco.
Presenting the descriptive statistics and correlation matrix
Return of
Tesco
Return of
Sainsbury
Return on
FTSE 100

Mean 4910947753 1450588183 3636132.18
Standard Error 465328871.3 144869700.4 402745.5952
Median 4639069675 1324394538 4476350.739
Mode #N/A #N/A #N/A
Standard
Deviation 2548711195 793484027.9 2205928.474
Sample Variance 6.49593E+18 6.29617E+17 4.86612E+12
Kurtosis 1.732246131 6.530542374 -0.848161009
Skewness 0.968484859 1.945008237 -0.670204544
Range 11883974063 4369584777 6711636.114
Minimum 646793247.5 109412396.8 7551.0344
Maximum 12530767311 4478997174 6719187.148
Sum 1.47328E+11 43517645494 109083965.4
Count 30 30 30
The descriptive statistics assist the company in evaluating the average return which the company and FTSE 100 is getting. This
is necessary for the reason that it assist the companies in comparing their performance with others and with index. When the company
has the average return then they have some common base for comparison and can compare their performance with any of the
competitors (Black, 2019). with the average return it is clearly visible that Tesco is having more return in comparison to Sainsbury.
Correlation
Return of
Tesco
Return of
Sainsbury
Return on
FTSE 100
Return of Tesco 1
Return of
Sainsbury 0.644460647 1
Return on FTSE
100
-
0.160838967
-
0.180346552 1
⊘ This is a preview!⊘
Do you want full access?
Subscribe today to unlock all pages.

Trusted by 1+ million students worldwide

By evaluating the correlation matrix, it is clear that the return of Tesco and Sainsbury are correlated to a great extent. in
addition to this, on the basis of FTSE 100 the correlation is more with Sainsbury and less with Tesco. Hence, it can be implied that the
returns of Sainsbury are more related with the returns of FTSE 100.
Bivariate and multivariate regression analysis
Bivariate
Regression
Statistics
Multiple R 0.180346552
R Square 0.032524879
Adjusted R
Square -0.002027804
Standard Error 794288135.5
Observations 30
ANOVA
df SS MS F
Significance
F
Regression 1 5.93868E+17 5.93868E+17 0.941312692 0.34024742
Residual 28 1.7665E+19 6.30894E+17
Total 29 1.82589E+19
Coefficients
Standard
Error t Stat P-value
Lower
95%
Upper
95%
Lower
95.0%
Upper
95.0%
Intercept
168646989
4 283088194.4
5.9574010
06
2.05242E-
06
11065900
15
22663497
73
110659001
5
226634977
3
Paraphrase This Document
Need a fresh take? Get an instant paraphrase of this document with our AI Paraphraser

Return on FTSE
100
-
64.8715996
3 66.86327577 -0.9702127
0.3402474
2
-
201.83481 72.091612 -201.83481 72.091612
By evaluating the regression analysis, it is clear that the return of Sainsbury is not based on return on FTSE 100. The reason
underlying this fact is that the significance value is more than the standard and because of this there is no significant relation between
returns.
Multivariate
Regression
Statistics
Multiple R 0.189549488
R Square 0.035929009
Adjusted R
Square -0.035483658
Standard Error 2244724.523
Observations 30
ANOVA
df SS MS F
Significance
F
Regression 2 5.07021E+12 2.53511E+12 0.503118151 0.6101993
Residual 27 1.36047E+14 5.03879E+12
Total 29 1.41117E+14
Coefficients
Standard
Error t Stat P-value Lower 95% Upper 95%
Lower
95.0%
Upper
95.0%
Intercept 4489437.056 956670.8135 4.692771006 6.95493E-05 2526510.69 6452363.43 2526510.69 6452363.43
Return of -6.60417E- 0.000213889 -0.30876667 0.759868961 -0.0005049 0.00037282 -0.0005049 0.00037282

Tesco 05
Return of
Sainsbury
-
0.000364664 0.000687021 -0.53079009 0.59990354 -0.0017743 0.00104499 -0.0017743 0.00104499
In the multivariate regression all the variables are being included and it also implies that there is no significant relation within
the returns of company and return of FTSE 100. The significance value in the present case is 0.61 which more than the standard that is
0.05. Thus, it can be stated that there is not any relation being present over the returns of company and return of index (Laugerman
and Saunders, 2019).
Contrasting the performance of two models
Both the models that is bivariate and multivariate regression stated that there is not any relation being present in the returns of
company and return on asset. Thus, the model suggested to be used is the multivariate model because of the reason that it involves all
the variables together and single output is being generated (Wang and et.al., 2018). Another reason why multivariate is being
advisable to the researcher because it will assist in analysing the relation within dependent and independent variables.
Forecast for at least two- time period
By using the formula of FORECAST in excel, the forecast for the next two years has been undertaken.
Date
Return of
Tesco
Return of
Sainsbury
Return on FTSE
100
12/31/2021 4158635557 1051985597 3108331.396
1/1/2022 4041434744 1046277845 3151009.159
Hence, with the above analysis it is clear that the return of the companies for the next two days are mentioned in above table
(Salazar, 2019). The use of forecasting is very important for the reason that it assist and guide the company in analysing the future
trend and try to make strategies in that direction only.
Return of
Sainsbury
-
0.000364664 0.000687021 -0.53079009 0.59990354 -0.0017743 0.00104499 -0.0017743 0.00104499
In the multivariate regression all the variables are being included and it also implies that there is no significant relation within
the returns of company and return of FTSE 100. The significance value in the present case is 0.61 which more than the standard that is
0.05. Thus, it can be stated that there is not any relation being present over the returns of company and return of index (Laugerman
and Saunders, 2019).
Contrasting the performance of two models
Both the models that is bivariate and multivariate regression stated that there is not any relation being present in the returns of
company and return on asset. Thus, the model suggested to be used is the multivariate model because of the reason that it involves all
the variables together and single output is being generated (Wang and et.al., 2018). Another reason why multivariate is being
advisable to the researcher because it will assist in analysing the relation within dependent and independent variables.
Forecast for at least two- time period
By using the formula of FORECAST in excel, the forecast for the next two years has been undertaken.
Date
Return of
Tesco
Return of
Sainsbury
Return on FTSE
100
12/31/2021 4158635557 1051985597 3108331.396
1/1/2022 4041434744 1046277845 3151009.159
Hence, with the above analysis it is clear that the return of the companies for the next two days are mentioned in above table
(Salazar, 2019). The use of forecasting is very important for the reason that it assist and guide the company in analysing the future
trend and try to make strategies in that direction only.
⊘ This is a preview!⊘
Do you want full access?
Subscribe today to unlock all pages.

Trusted by 1+ million students worldwide

CONCLUSION
The above report evaluated the fact that use of business statistics is very important for the reason that all these tools assist in
taking proper decision. Thus, the use various tools above like descriptive statistics, correlation, regression and others was assistive in
analysing the relation between return of stock and return of index. With the analysis it was evaluated that there is no significant
relation within the return of companies and return of index.
Paraphrase This Document
Need a fresh take? Get an instant paraphrase of this document with our AI Paraphraser

REFERENCES
Books and Journals
Black, K., 2019. Business statistics: for contemporary decision making. John Wiley & Sons.
Laugerman, M. R. and Saunders, K. P., 2019. Supporting student learning through instructional videos in business statistics. Decision
Sciences Journal of Innovative Education. 17(4). pp.387-404.
Salazar, L. R., 2019. EXPLORING THE EFFECT OF COLORING MANDALAS ON STUDENTS’MATH ANXIETY IN
BUSINESS STATISTICS COURSES. Business, Management and Education. 17(2). pp.134-151.
Wang, P., and et.al., 2018. Examining undergraduate students’ attitudes toward business statistics in the United States and
China. Decision Sciences Journal of Innovative Education. 16(3). pp.197-216.

APPENDIX
Tesco Sainsbury FTSE 100
Date Adj. close Volume
Return of
Tesco Adj. close Volume
Return of
Sainsbury Price
Volum
e
Return on FTSE
100
11/17/202
1
277.85000
6
1590359
0 4418812577 288 6758953 1946578464 7,384
.18
672.
66 4967042.52
11/18/202
1
279.35000
6
1642575
6 4588535037
293.39999
4 3209090 941546986.7 7,255
.96
582.
17 4224202.23
11/19/202
1
278.85000
6
1681765
9 4689604313
292.60000
6 5692331 1665576085 7,223
.57 1.14 8234.8698
11/22/202
1
280.89999
4
1153674
5 3240671601
295.70001
2 5038180 1489789886 7,255
.46
638.
19 4630362.02
11/23/202
1
279.79998
8
1890766
5 5290364440
293.20001
2 5565084 1631682696 7,266
.69
624.
61 4538847.24
11/24/202
1 280.5
1451203
7 4070626379 295 1890836 557796620 7,286
.32
610.
56 4448735.54
11/25/202
1
280.35000
6 7857840 2202945491
295.39999
4 3414870 1008752578 7,310
.37
472.
1 3451225.68
11/26/202
1
279.14999
4
3001202
7 8377857157
293.60000
6 4738460 1391211884 7,044
.03 1.66 11693.0898
11/29/202
1 279
1894600
5 5285935395
289.70001
2 6374083 1846571922 7,109
.95
945.
04 6719187.15
11/30/202
1 276.75
4527829
2 12530767311
276.60000
6
1619304
8 4478997174 7,059
.45 1.4 9883.23
12/1/2021
278.14999
4
1988367
0 5530642691
280.20001
2 7192960 2015467478 7,168
.68
776.
7 5567913.76
12/2/2021
277.85000
6
1407924
8 3911919141
278.79998
8 4560409 1271441974 7,129
.21
723.
06 5154846.58
12/3/2021
280.10000
6
1142916
8 3201310025
278.20001
2 4478633 1245955754 7,122
.32
867.
11 6175834.9
12/6/2021
280.64999
4 9229342 2590214777 280 4441788 1243700640 7,232
.28
637.
27 4608915.08
⊘ This is a preview!⊘
Do you want full access?
Subscribe today to unlock all pages.

Trusted by 1+ million students worldwide
1 out of 13