Ask a question from expert

Ask now

MA508 - Business Statistics - Assignment

8 Pages1485 Words227 Views
   

Melbourne Institute of Technology


MA508 Business Statistics (MA508)


Added on  2020-03-01

About This Document

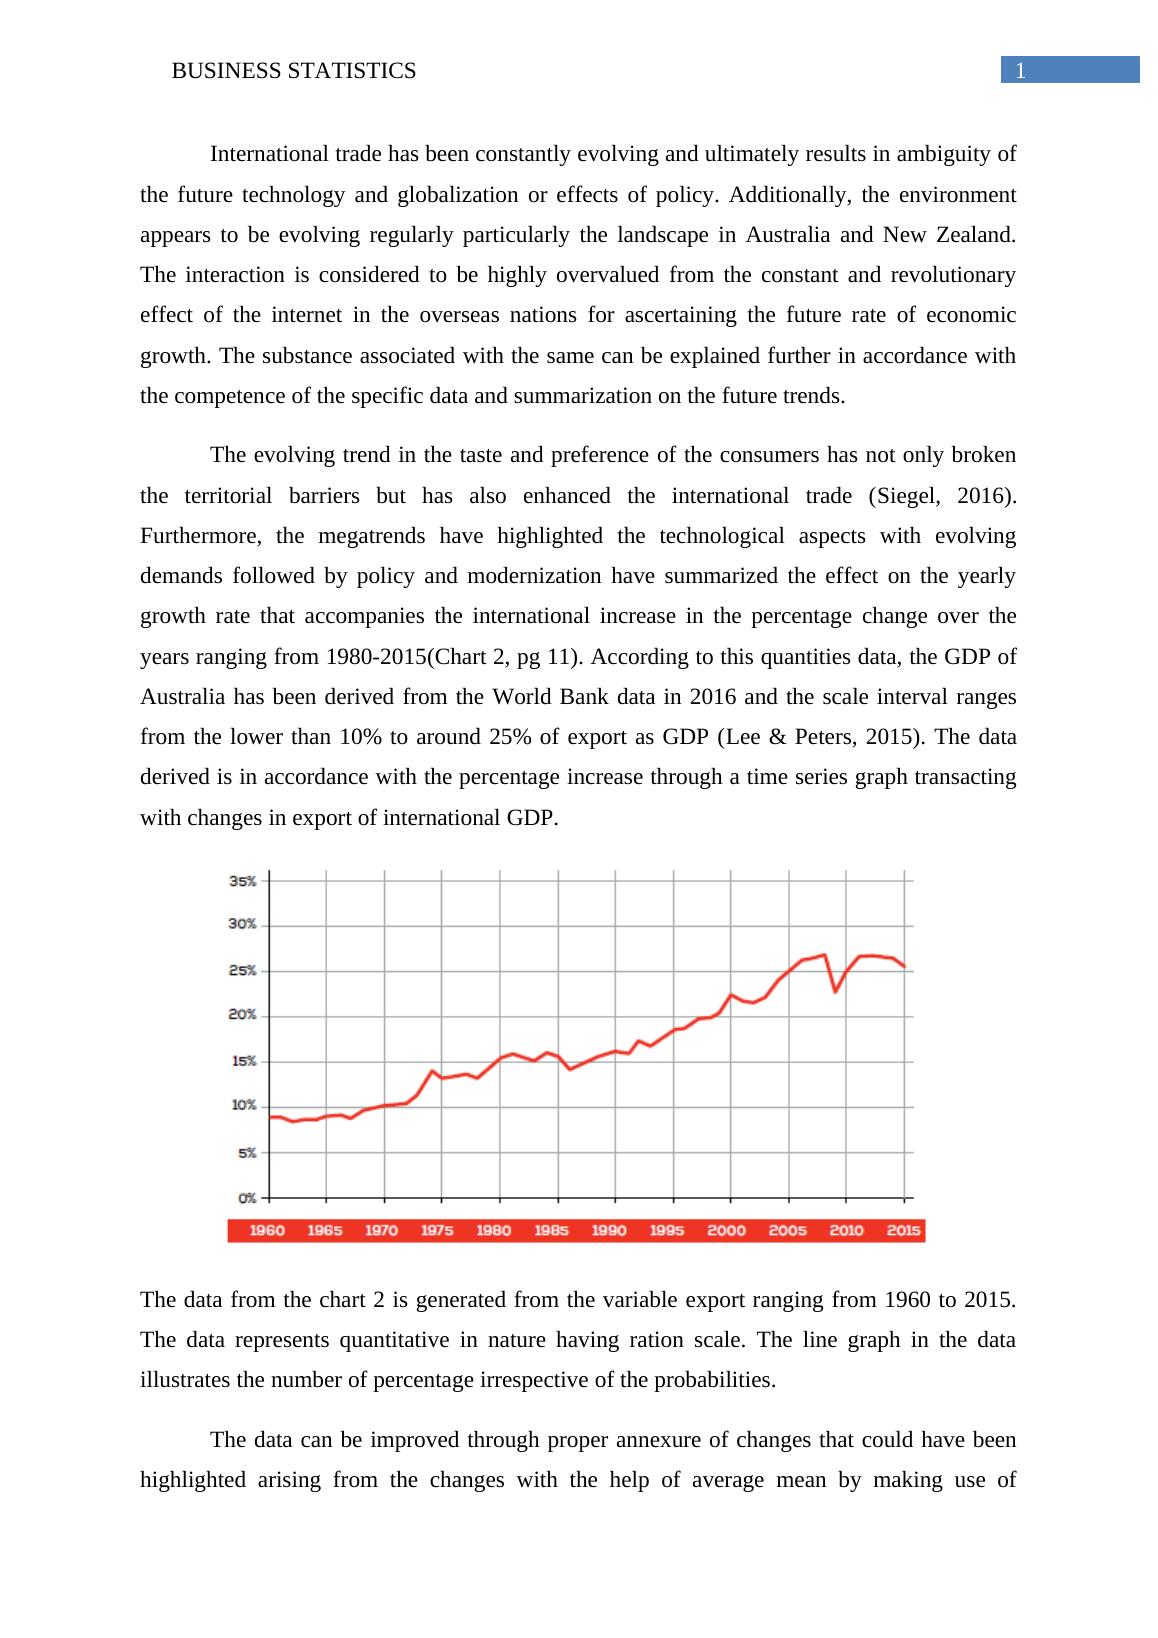
This assignment will discuss international trade constantly evolves and ultimately results in the ambiguity of the future technology and globalization or effects of policy. This assignment will discuss the effect of the internet on overseas nations for ascertaining the future rate of economic growth. It will highlight the technological aspects with evolving demands that followed by policy and modernization have summarized the effect on the yearly growth rate that accompanies the international increase in the percentage change over the years ranging.

MA508 - Business Statistics - Assignment


Melbourne Institute of Technology


MA508 Business Statistics (MA508)

   Added on 2020-03-01

BookmarkShareRelated Documents
Running head: BUSINESS STATISTICSUnit Code: MA 508 Business StatisticsName of the StudentName of the UniversityStudent IDCourse ID
MA508 -  Business Statistics - Assignment_1
1BUSINESS STATISTICSInternational trade has been constantly evolving and ultimately results in ambiguity ofthe future technology and globalization or effects of policy. Additionally, the environmentappears to be evolving regularly particularly the landscape in Australia and New Zealand.The interaction is considered to be highly overvalued from the constant and revolutionaryeffect of the internet in the overseas nations for ascertaining the future rate of economicgrowth. The substance associated with the same can be explained further in accordance withthe competence of the specific data and summarization on the future trends. The evolving trend in the taste and preference of the consumers has not only brokenthe territorial barriers but has also enhanced the international trade (Siegel, 2016).Furthermore, the megatrends have highlighted the technological aspects with evolvingdemands followed by policy and modernization have summarized the effect on the yearlygrowth rate that accompanies the international increase in the percentage change over theyears ranging from 1980-2015(Chart 2, pg 11). According to this quantities data, the GDP ofAustralia has been derived from the World Bank data in 2016 and the scale interval rangesfrom the lower than 10% to around 25% of export as GDP (Lee & Peters, 2015). The dataderived is in accordance with the percentage increase through a time series graph transactingwith changes in export of international GDP. The data from the chart 2 is generated from the variable export ranging from 1960 to 2015.The data represents quantitative in nature having ration scale. The line graph in the dataillustrates the number of percentage irrespective of the probabilities. The data can be improved through proper annexure of changes that could have beenhighlighted arising from the changes with the help of average mean by making use of
MA508 -  Business Statistics - Assignment_2
2BUSINESS STATISTICSstandard deviation of GDP growth. The description can be followed with the help of actualdata derived from the Department of Foreign Affairs and Trade for Australia stating the top 5exporters in the interval of 5 years beginning from 1995 (Black, 2016). Ever since the year1990 Japan has one of the better export market after China. Therefore, it can be predicted thatin the later part of years Japan and China would have strong grip on the market. The studycan be experimented and subjected to change in terms of the different factors that create aninfluence in the markets. The data chart 3 is generated from the from Department of Foreign Affairs and Tradefor Australia from 1995-2015. The data presented is categorical with no probabilities underthe nominal scale.Subsequently, the exports are required to be figured due to the rise in the globaldemand of primary products from the Chinese markets (Rhodes, 2015). The data from theAustralian and New Zealand has been undertaken from the Australian Bureau of Statisticsfrom June 2016 which represents the scale in accordance with the value amongst the goodsand services. The Australian exports have been illustrated with the help of more goods (75%)however the composition of GDP have represented a constant growth with more percentageof contribution from the services (77%) and the identical composition going to with NewZealand together with the export of NZ $70.9 billion. The doughnut chart states that thepopulations with the help of subset of export the composition of GDP (Keller, 2016). Thefuture of the trade forms the vital aspect of the lower process in order to have a bettercomposition among the products than services. According to the analysis of the OECD it hasbeen found that an increase of 10% in trade in the areas of both exports and imports as theproportion of GDP is linked with a 4% increase in the output per working age person.
MA508 -  Business Statistics - Assignment_3

End of preview

Want to access all the pages? Upload your documents or become a member.

Related Documents
MA508 - Business Statistics
|4
|1214
|77

MA508 - Business Statistics - Case Study
|10
|1586
|48

MA508 - Business Statistics - Assignment
|10
|1700
|60

Business Statistical Techniques : Essay
|4
|1216
|425

Statistics and Research Methods for Business Decision Making
|12
|1274
|210

Statistics and Research Methods for Business Decision Making
|9
|1227
|100