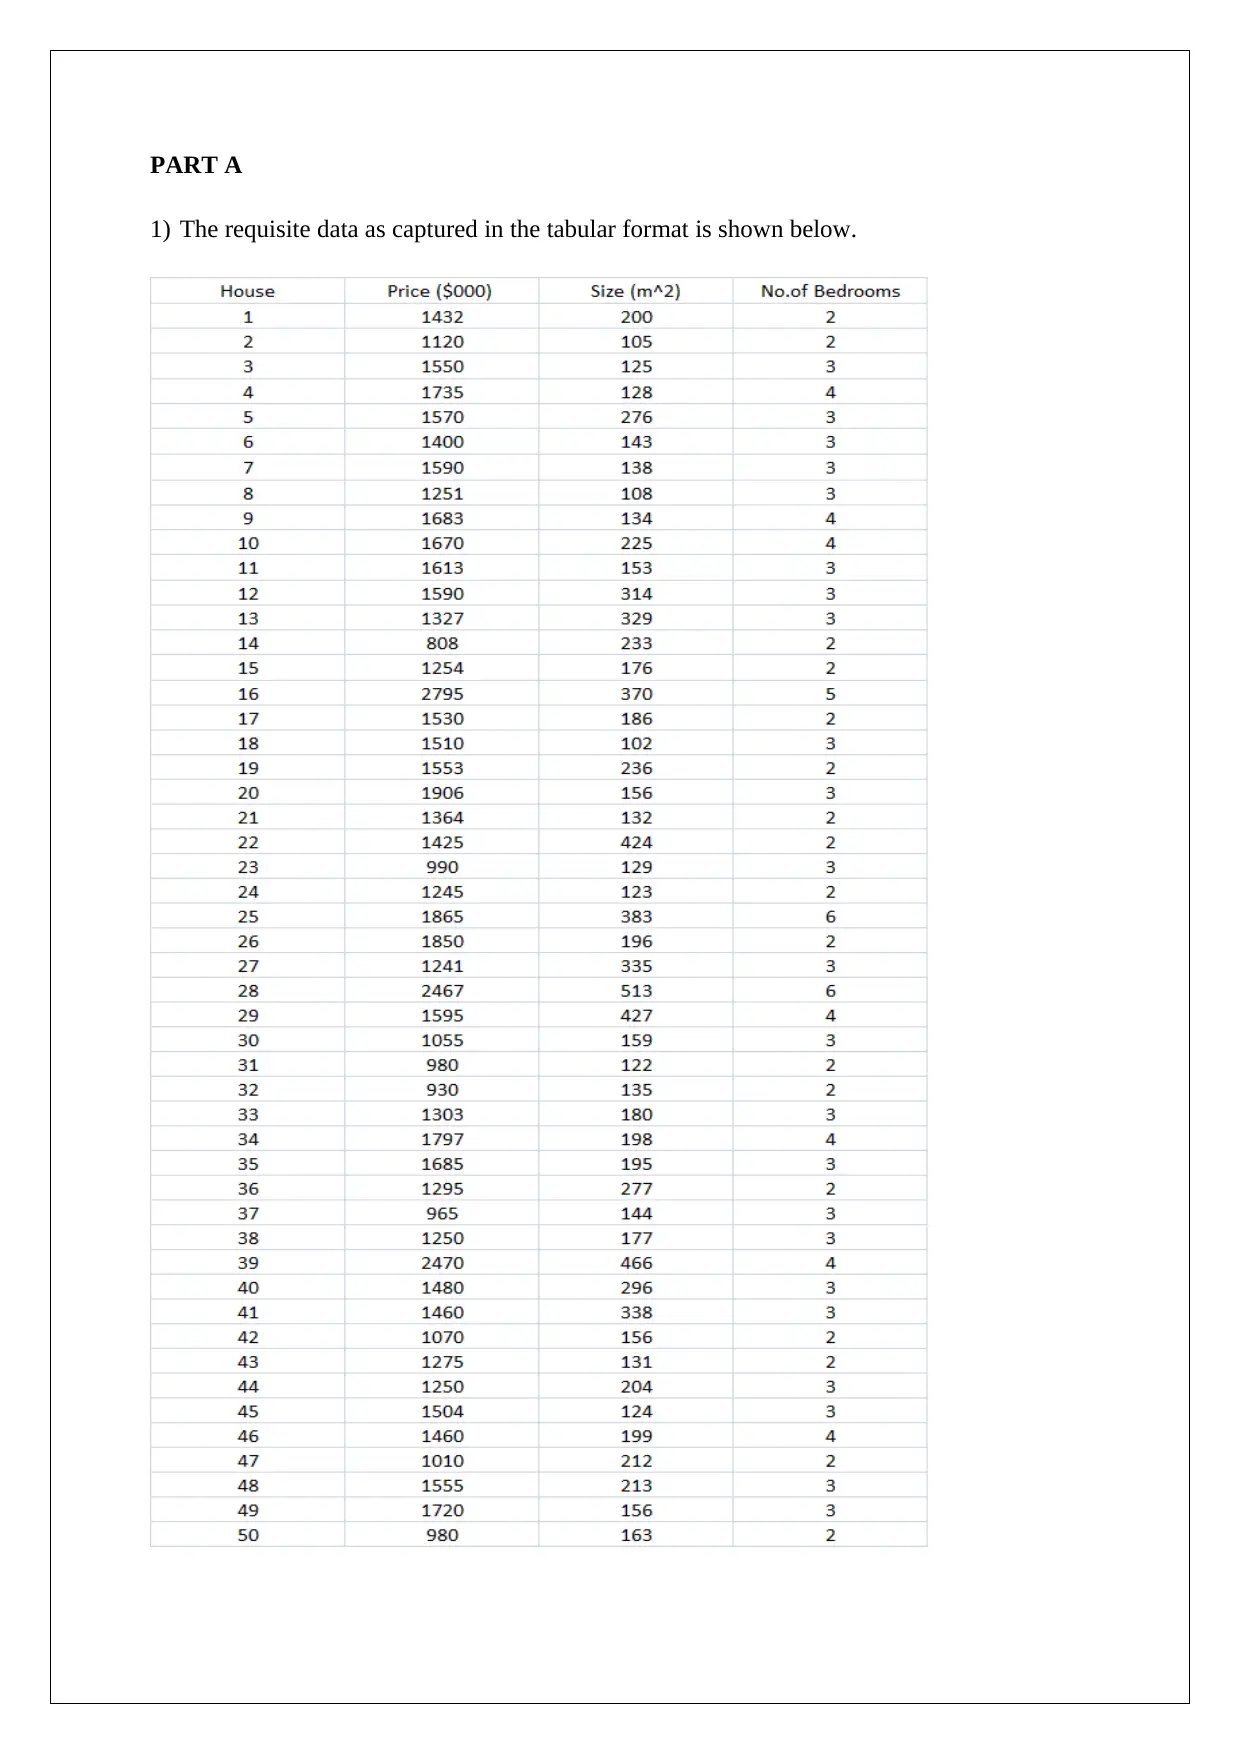
Business Report: House Price Appraisal in Melbourne Suburbs
VerifiedAdded on 2022/07/28
|16
|2098
|44
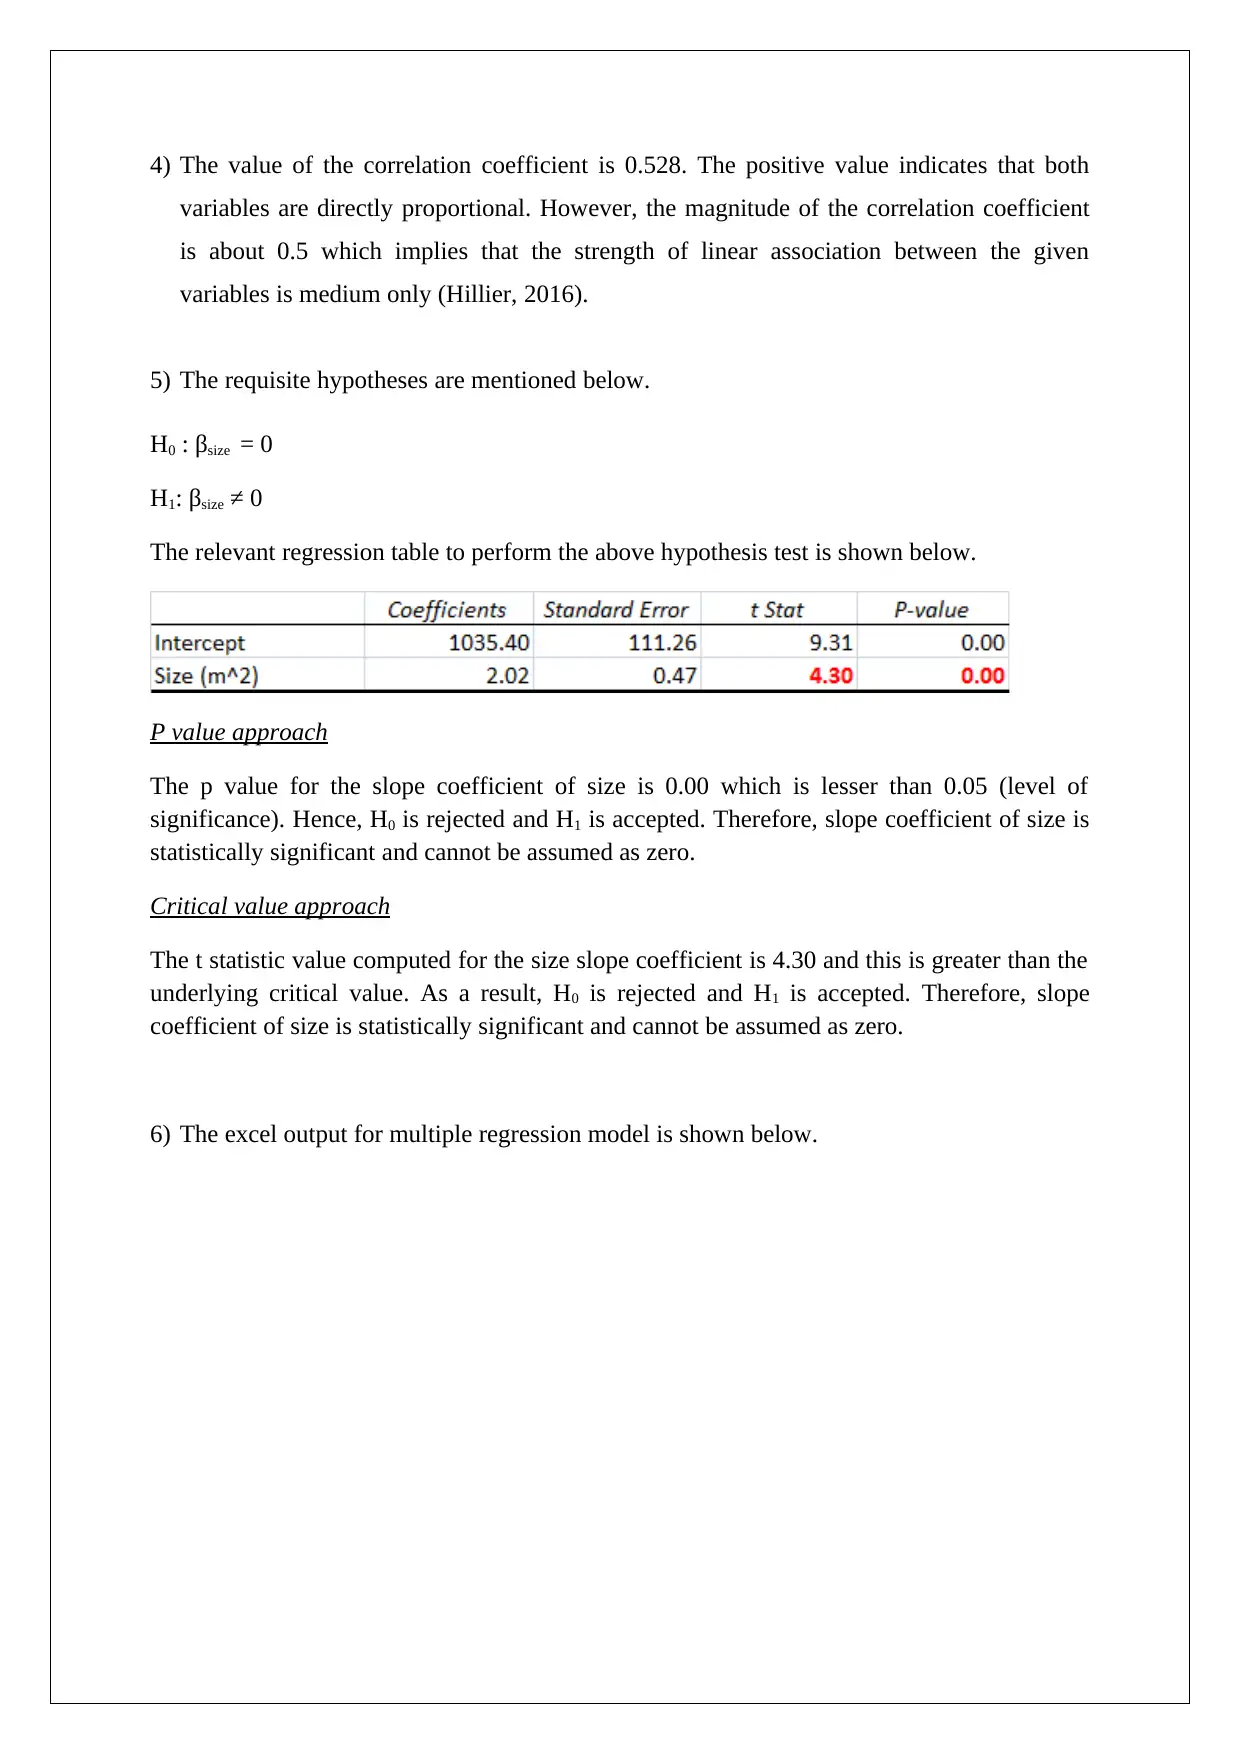
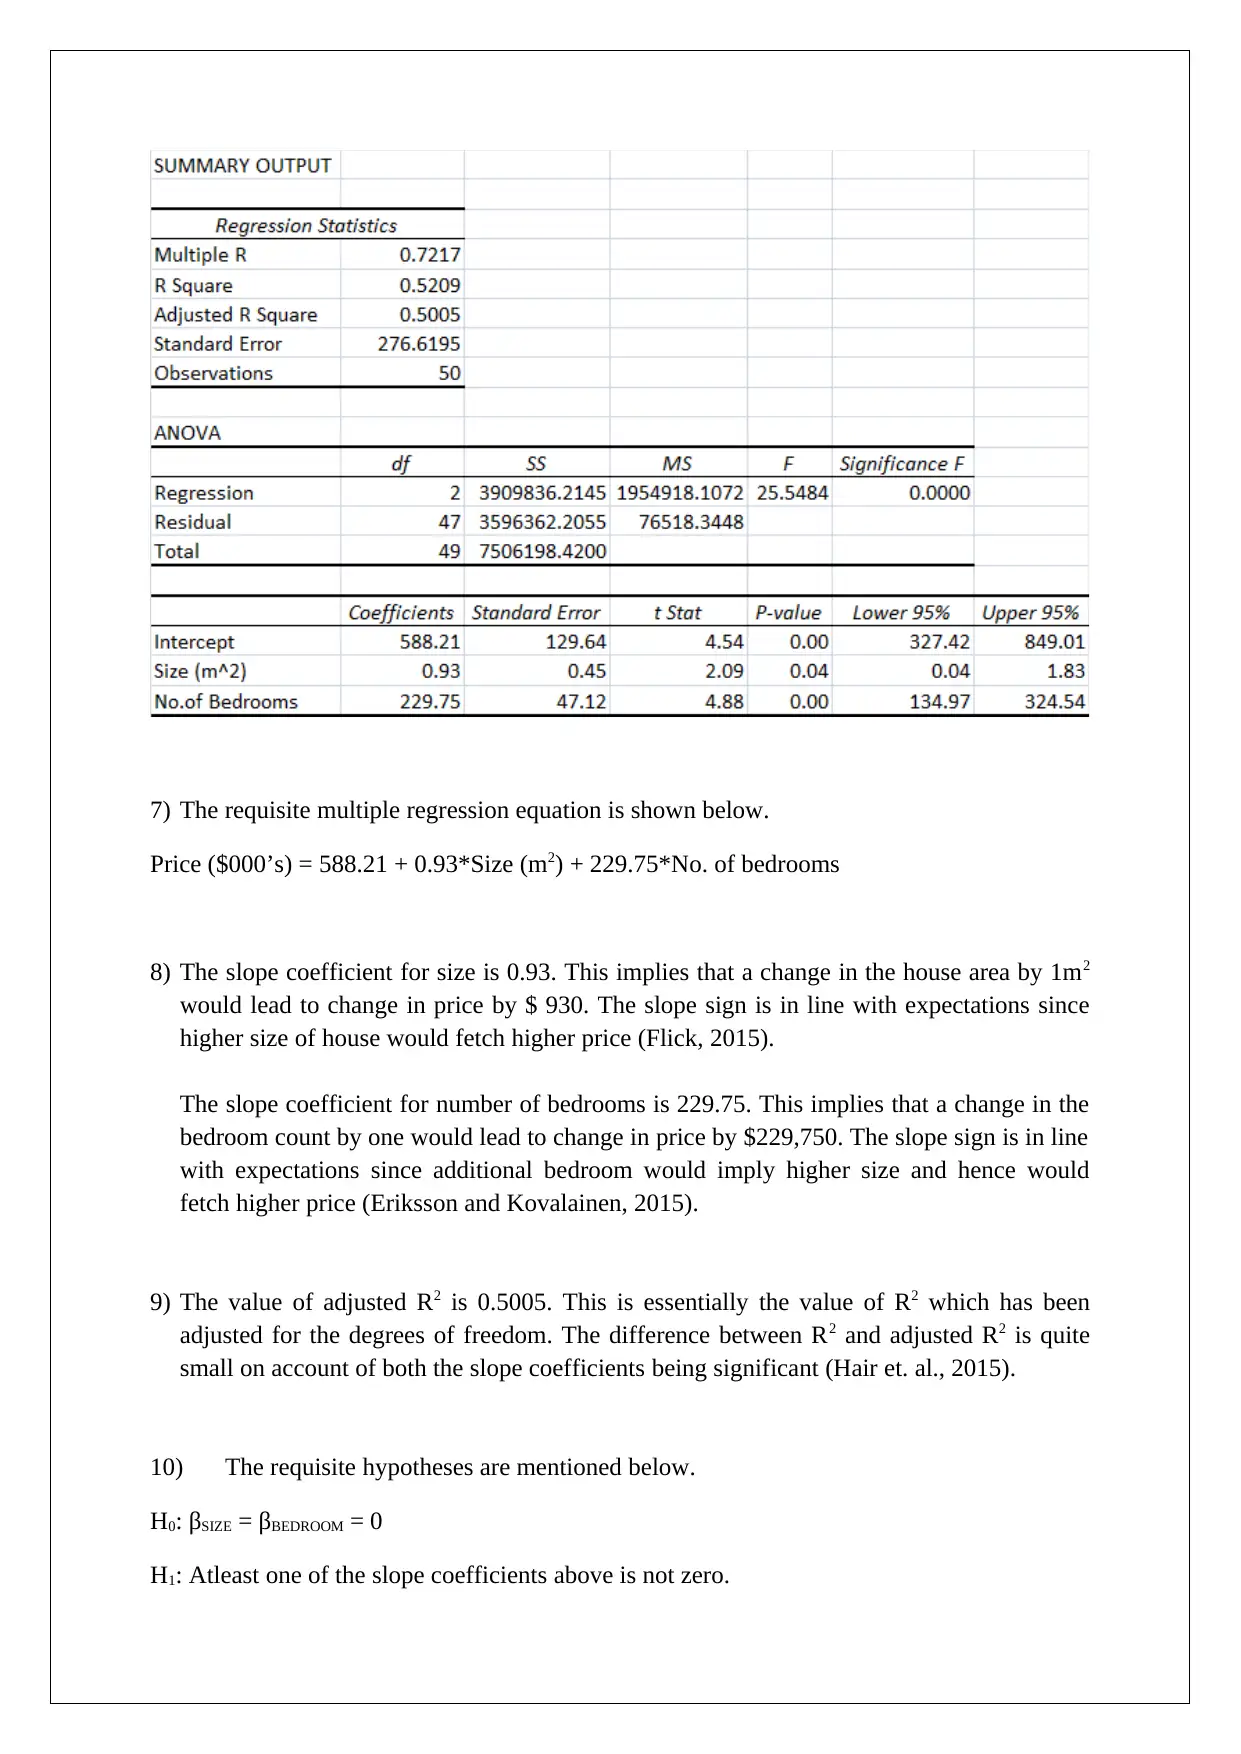
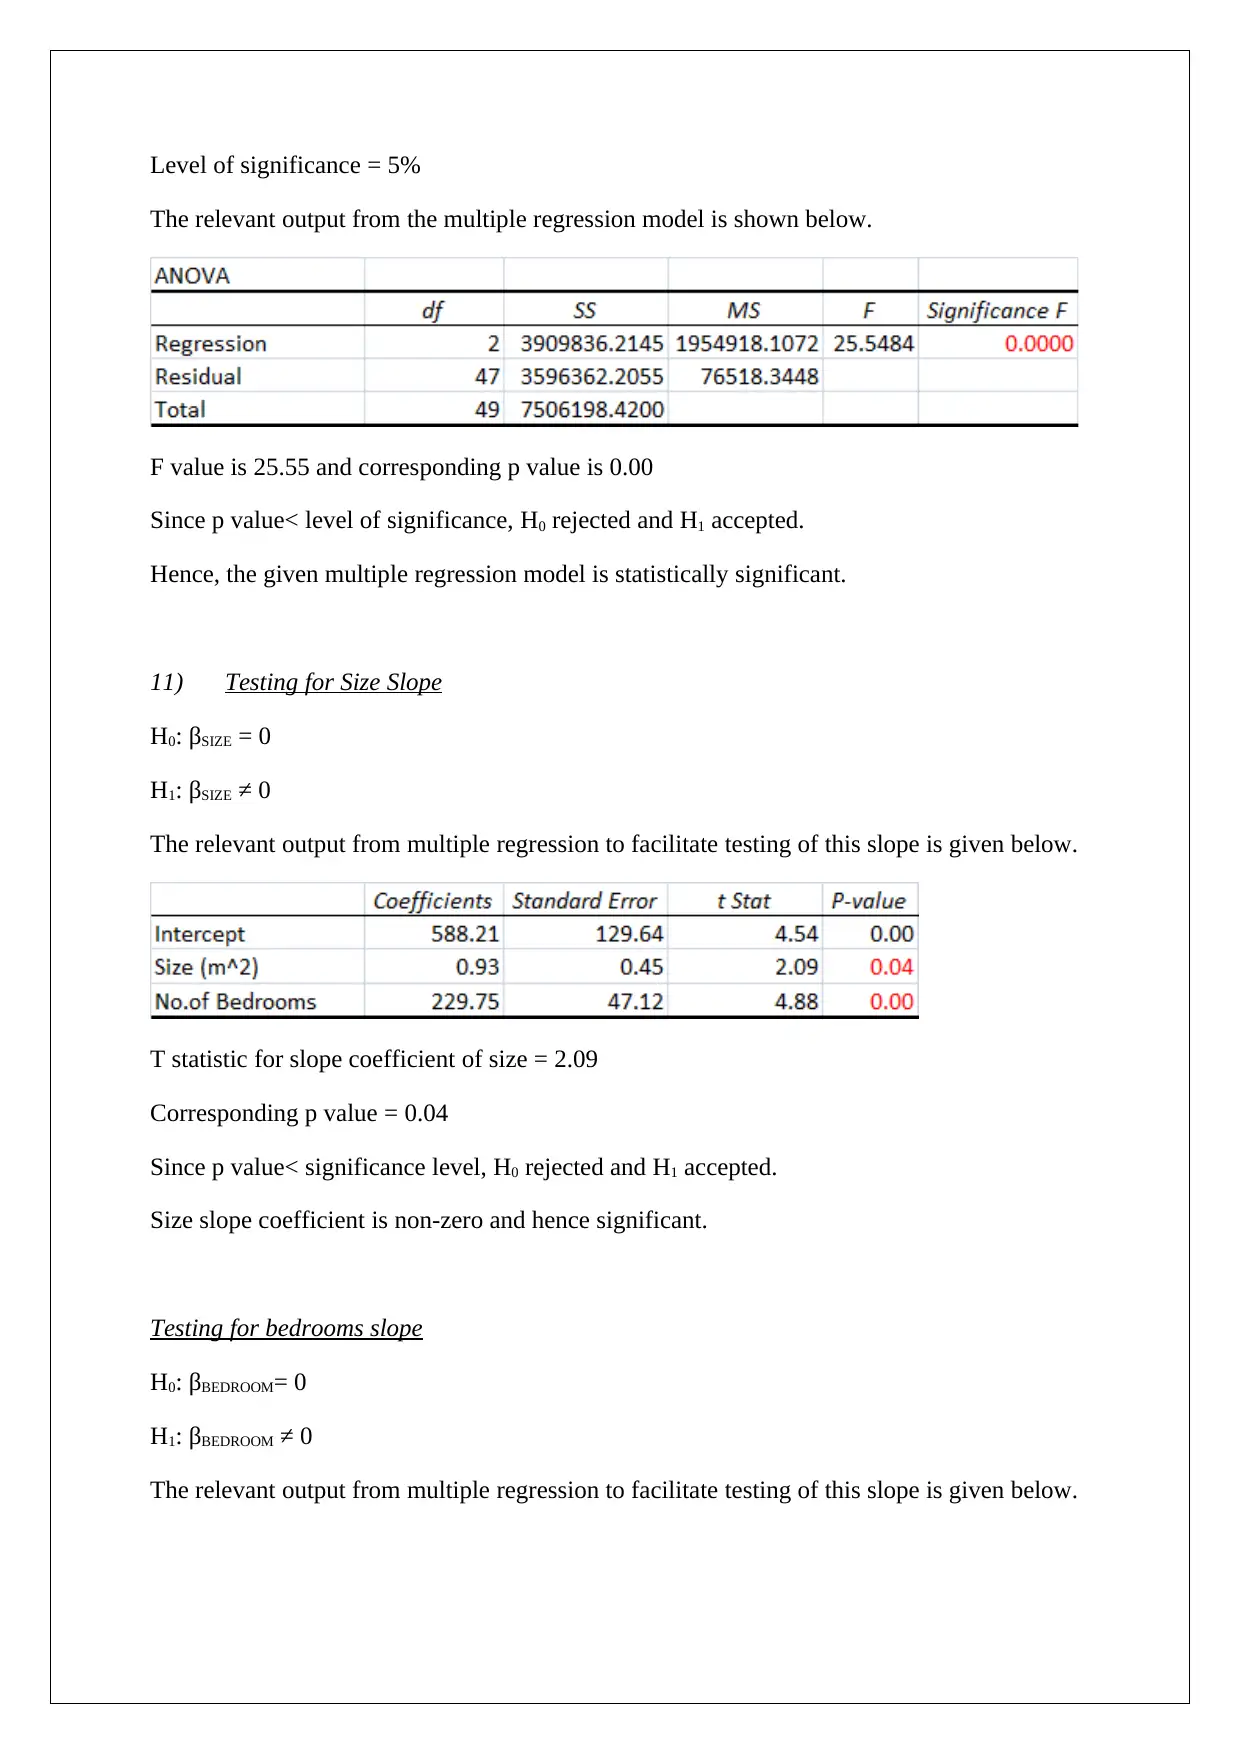
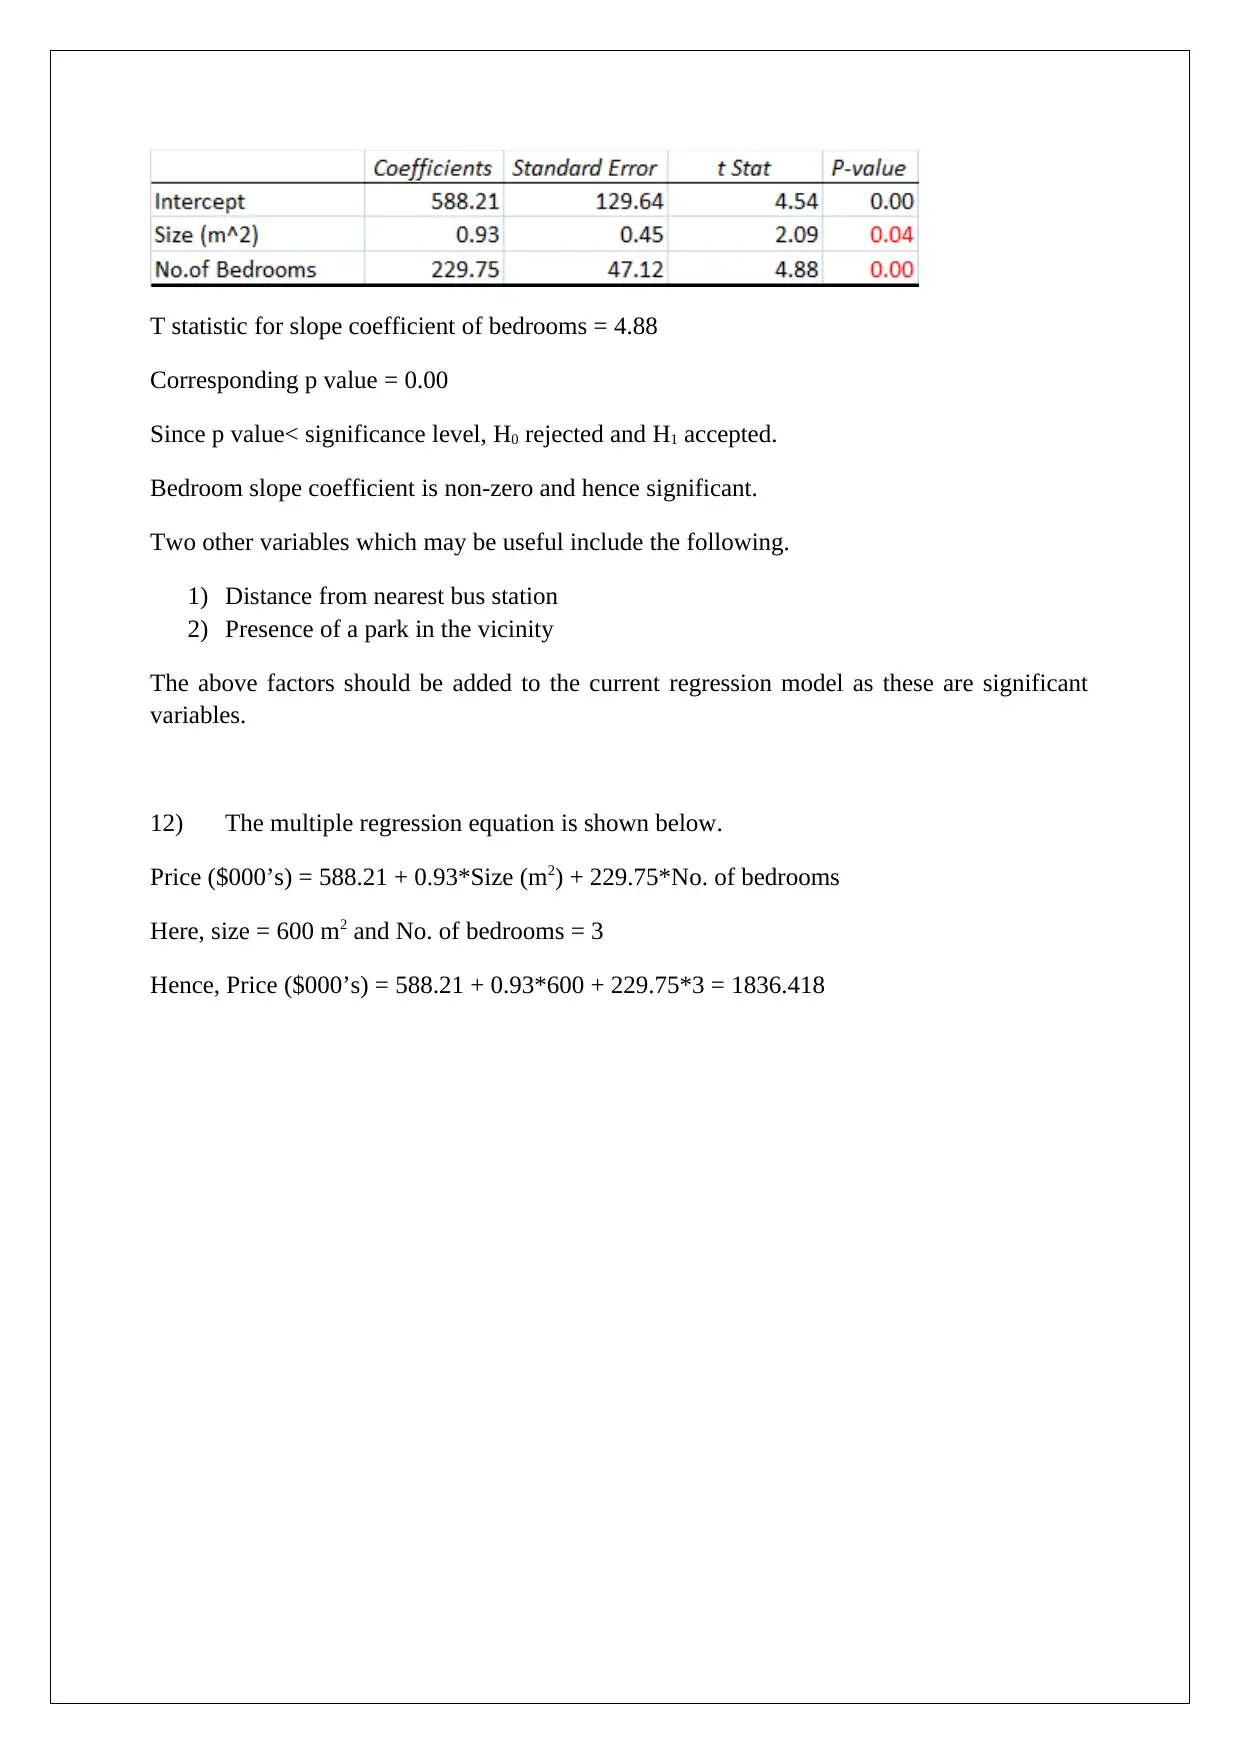
Report
AI Summary
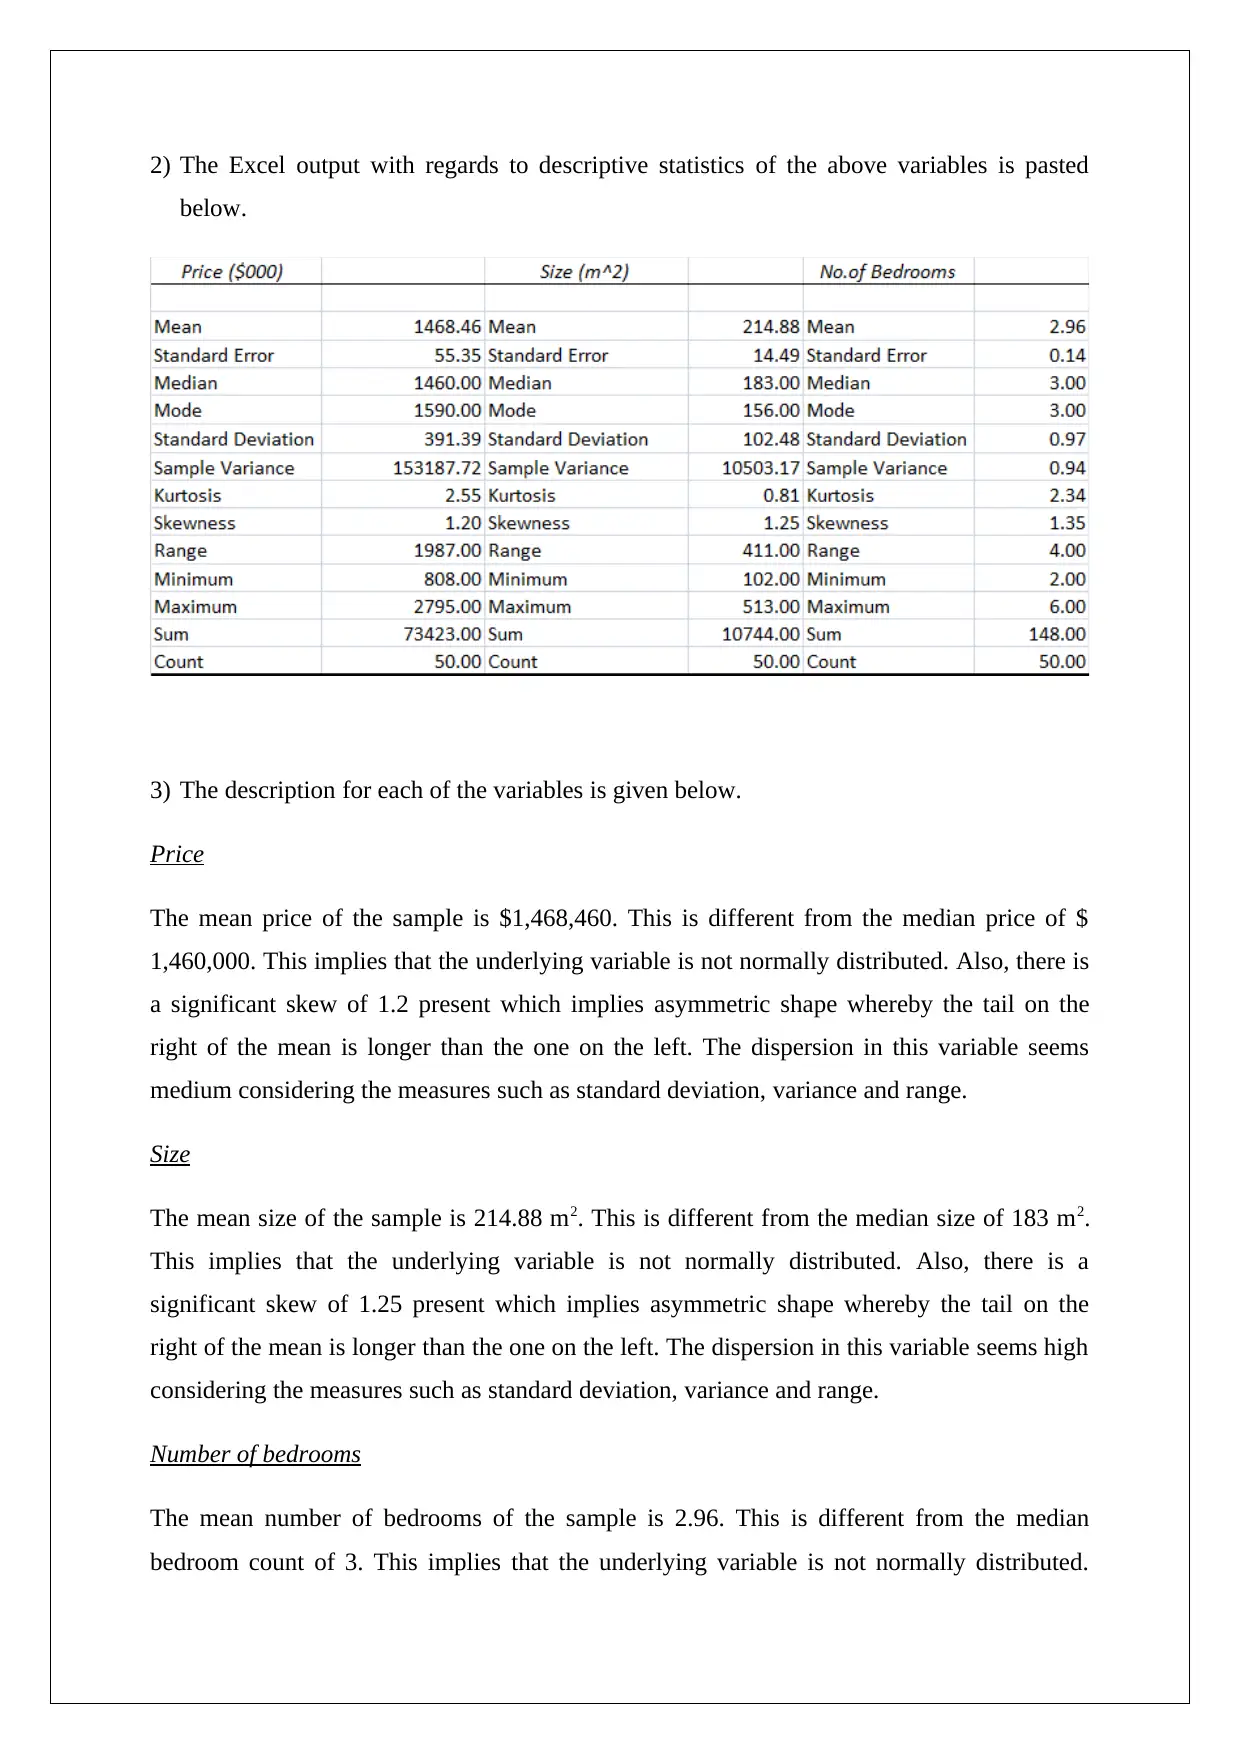
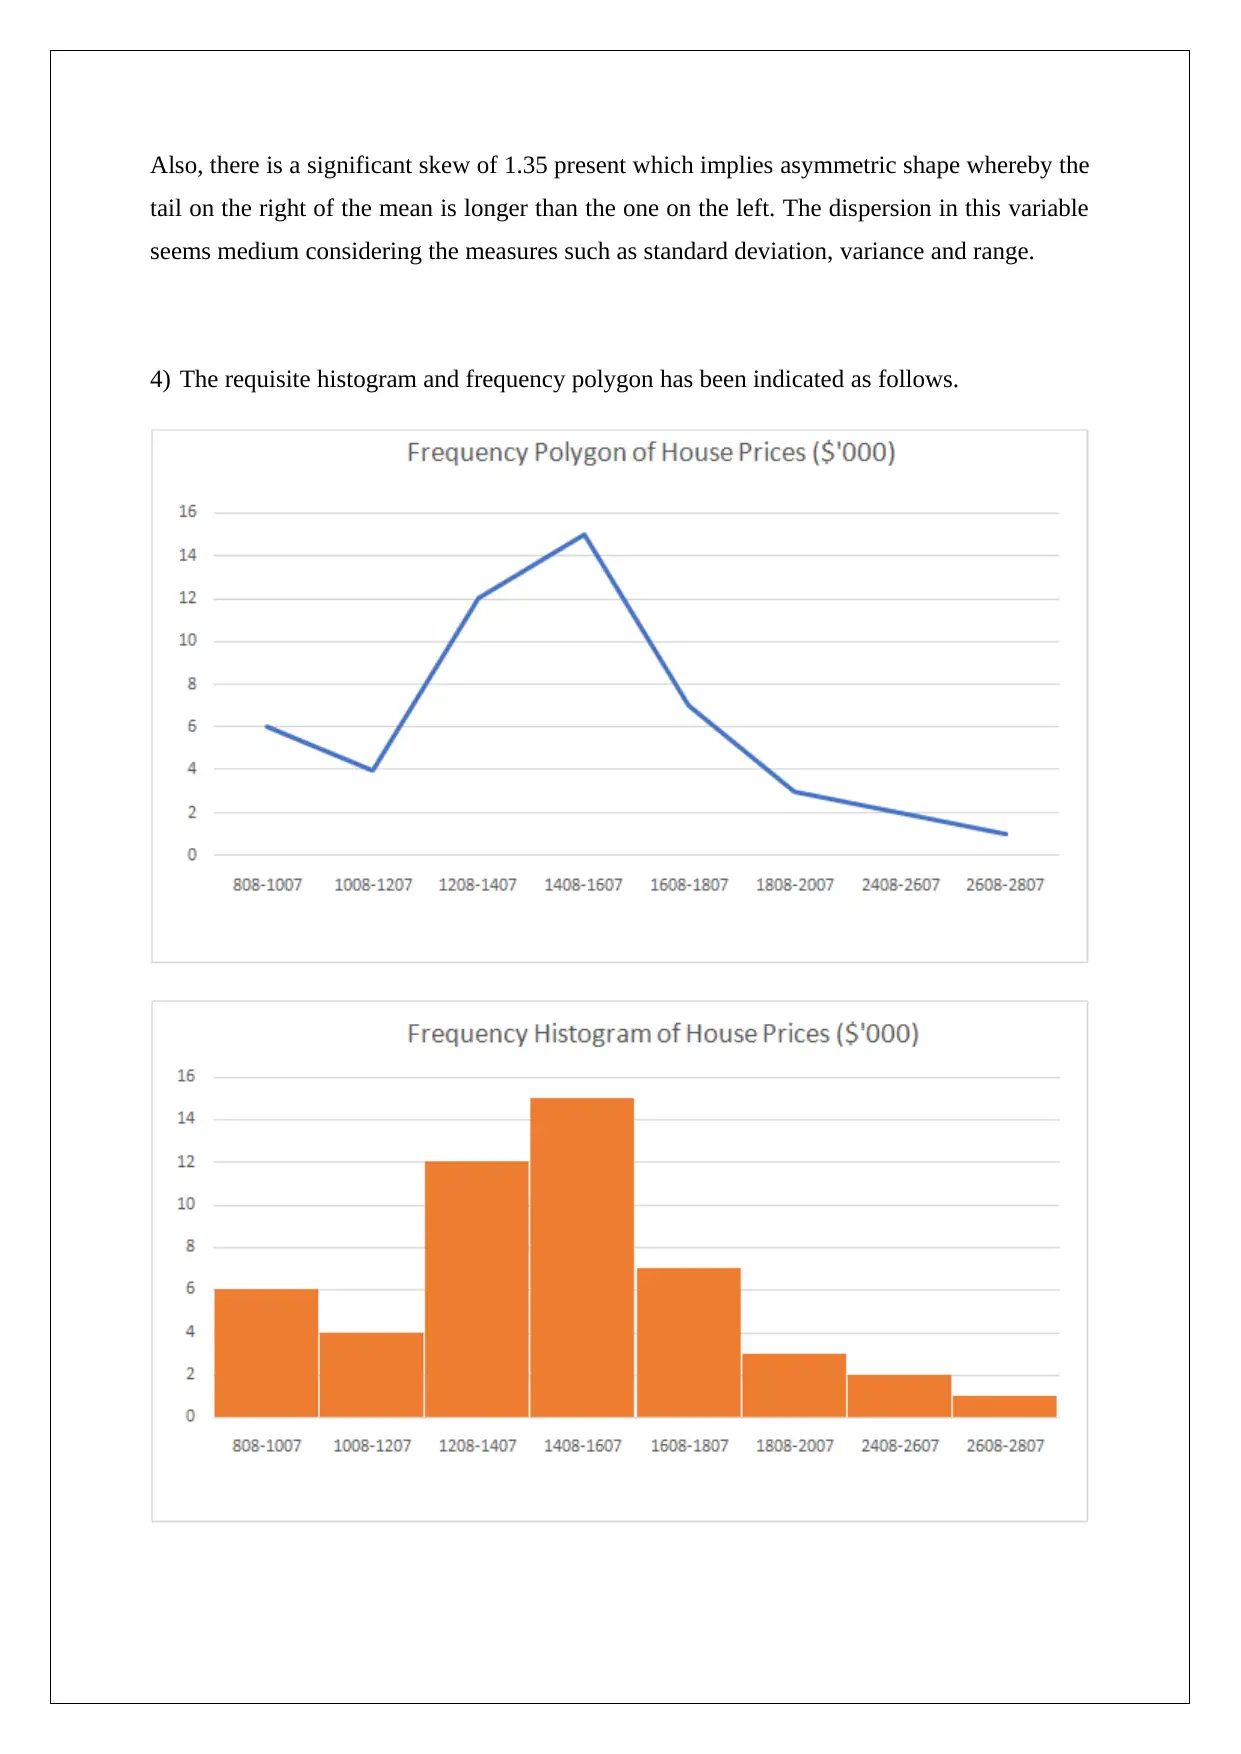
This report presents a statistical analysis of house prices in the Clifton Hill and Fitzroy North areas of Melbourne. It begins with descriptive statistics of key variables like price, size, and number of bedrooms, including their distributions and potential outliers. The analysis employs both simple and multiple linear regression models to estimate house prices, assessing the significance of various factors. The report includes hypothesis testing, confidence intervals, and the evaluation of regression coefficients. It explores model improvements and provides recommendations for enhancing predictive power. Furthermore, the report emphasizes the importance of presenting information in a manner accessible to a multilingual audience, including the use of visual aids and simplified representations of complex statistical results.
1 out of 16
Related Documents


Your All-in-One AI-Powered Toolkit for Academic Success.
+13062052269
info@desklib.com
Available 24*7 on WhatsApp / Email
![[object Object]](/_next/static/media/star-bottom.7253800d.svg)
Copyright © 2020–2026 A2Z Services. All Rights Reserved. Developed and managed by ZUCOL.